
Properties for sale in M
Manchester
- Info
- Price Paid By Year
- Property Type Price
House Prices in M
Properties in M have an average house price of £252,422 and had 51979 Property Transactions within the last 3 years.
The most expensive property was sold for £13,200,000.
Property Price Paid in M by Year
The average sold property price by year was:
| Year | Average Sold Price | Sold Properties |
|---|---|---|
| 2025 | £263,117.00 | 6,779 Properties |
| 2024 | £256,514.00 | 14,265 Properties |
| 2023 | £246,429.00 | 13,718 Properties |
| 2022 | £249,596.00 | 17,217 Properties |
| 2021 | £231,974.00 | 20,944 Properties |
| 2020 | £218,690.00 | 16,521 Properties |
| 2019 | £197,842.00 | 20,379 Properties |
| 2018 | £191,405.00 | 20,765 Properties |
| 2017 | £184,106.00 | 21,059 Properties |
| 2016 | £170,276.00 | 22,131 Properties |
| 2015 | £156,310.00 | 20,160 Properties |
| 2014 | £153,571.00 | 17,842 Properties |
| 2013 | £145,705.00 | 13,454 Properties |
| 2012 | £146,068.00 | 10,946 Properties |
| 2011 | £142,535.00 | 11,276 Properties |
| 2010 | £143,800.00 | 11,745 Properties |
| 2009 | £140,044.00 | 10,872 Properties |
| 2008 | £144,717.00 | 13,266 Properties |
| 2007 | £152,308.00 | 27,922 Properties |
| 2006 | £143,805.00 | 28,434 Properties |
| 2005 | £131,697.00 | 23,069 Properties |
| 2004 | £118,242.00 | 27,488 Properties |
| 2003 | £98,087.00 | 27,237 Properties |
| 2002 | £83,546.00 | 26,388 Properties |
| 2001 | £69,447.00 | 21,793 Properties |
| 2000 | £61,810.00 | 20,151 Properties |
| 1999 | £56,471.00 | 19,034 Properties |
| 1998 | £53,403.00 | 16,199 Properties |
| 1997 | £49,987.00 | 16,960 Properties |
| 1996 | £46,686.00 | 14,967 Properties |
| 1995 | £46,012.00 | 13,167 Properties |
Property Price per Property Type in M
Here you can find historic sold price data in order to help with your property search.
The average Property Paid Price for specific property types in the last three years are:
| Property Type | Average Sold Price | Sold Properties |
|---|---|---|
| Semi Detached House | £288,779.00 | 17,965 Semi Detached Houses |
| Terraced House | £216,932.00 | 18,454 Terraced Houses |
| Flat | £184,978.00 | 11,384 Flats |
| Detached House | £436,703.00 | 4,176 Detached Houses |
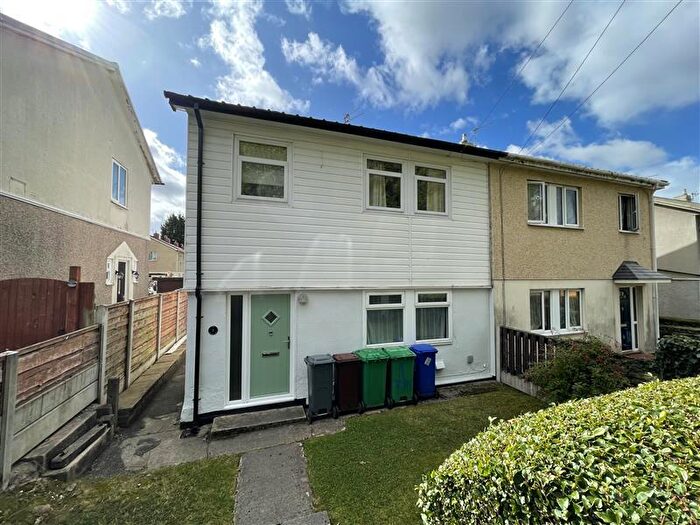
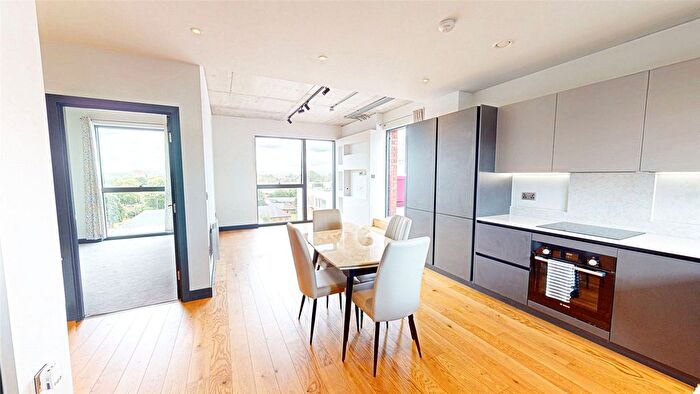
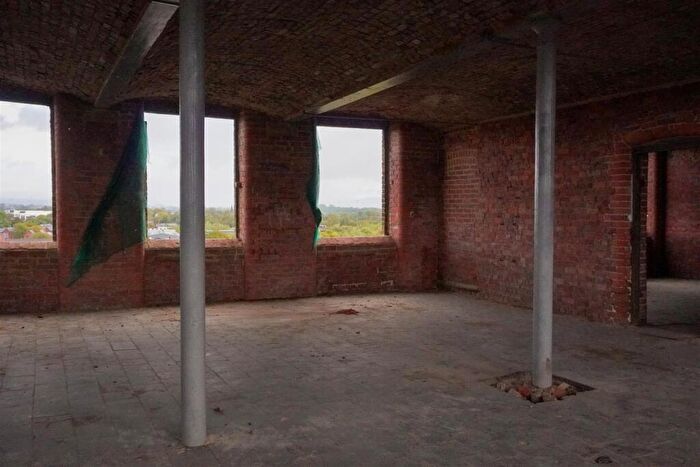
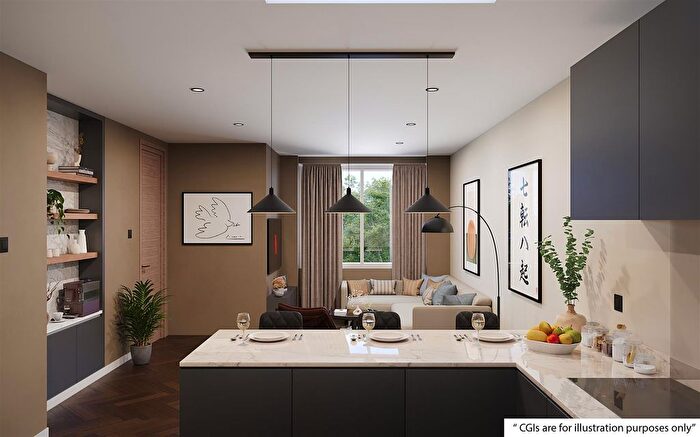
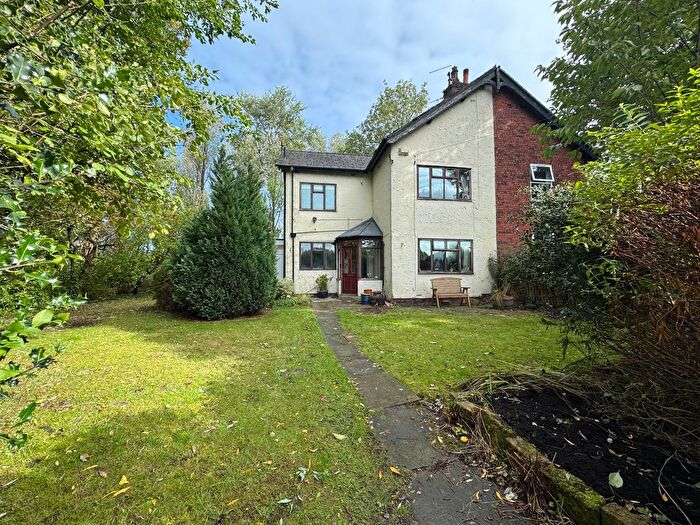
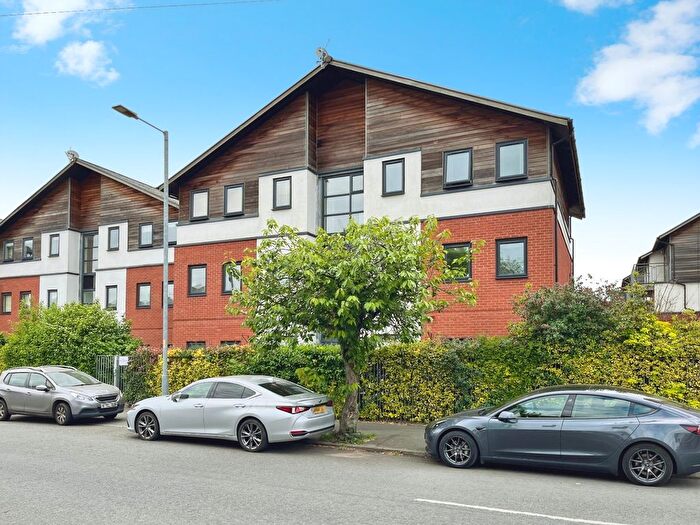
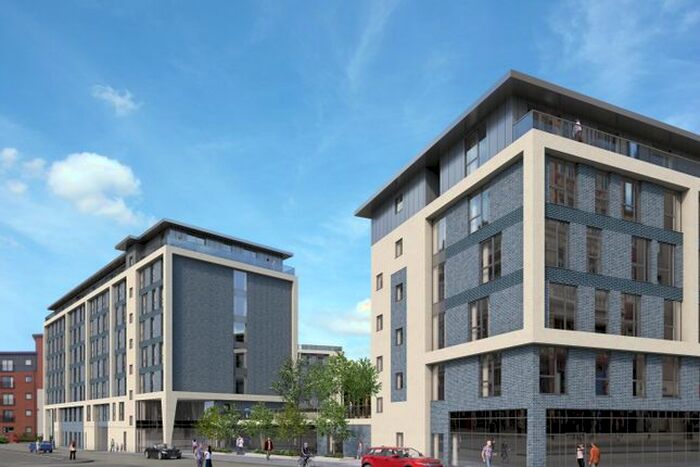
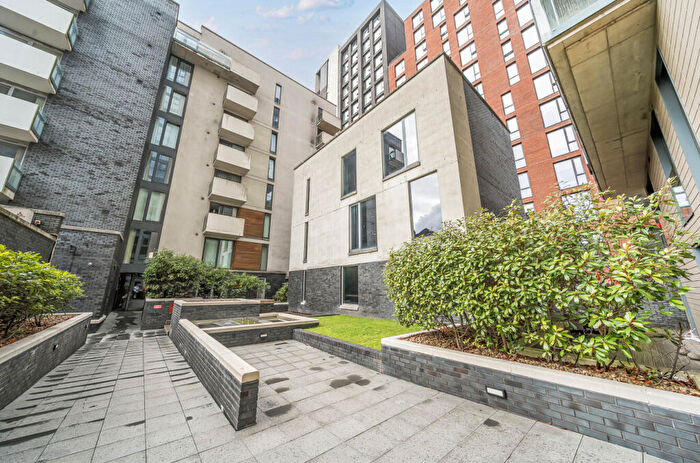
Houses and Flats for sale in M, Manchester

![]()
If you are looking to sell your house, let it out, or receive a property valuation, an expert can help you.
Click the button below to get started.


Postcode districts in M, Manchester
Navigate through our locations to find the location of your next house in M, Manchester, England for sale or to rent.
Transport in M, Manchester
Please see below transportation links in this area:
-
 Salford Crescent Station
 -
Salford Central Station
-
Deansgate Station
-
Manchester Oxford Road Station
-
Manchester Victoria Station
-
Manchester United Football Ground Station
-
Manchester Piccadilly Station
-
Trafford Park Station
-
Ardwick Station
-
Eccles Station
Frequently asked questions about M
What is the average price for a property for sale in M?
The average price for a property for sale in M is £252,422. This amount is 30% lower than the average price in England. There are 6,454 property listings for sale in M.
What locations have the most expensive properties for sale in M?
The locations with the most expensive properties for sale in M are M2 at an average of £488,532, M33 at an average of £396,720 and M21 at an average of £395,044.
What locations have the most affordable properties for sale in M?
The locations with the most affordable properties for sale in M are M38 at an average of £153,009, M18 at an average of £162,687 and M9 at an average of £166,945.
Which train stations are available in or near M?
Some of the train stations available in or near M are Salford Crescent, Salford Central and Deansgate.