
Properties for sale in M
Manchester
- Info
- Price Paid By Year
- Property Type Price
House Prices in M
Properties in M have an average house price of £256,701 and had 42323 Property Transactions within the last 3 years.
The most expensive property was sold for £5,535,402.
Property Price Paid in M by Year
The average sold property price by year was:
| Year | Average Sold Price | Sold Properties |
|---|---|---|
| 2026 | £281,558.00 | 247 Properties |
| 2025 | £266,486.00 | 13,324 Properties |
| 2024 | £257,141.00 | 14,982 Properties |
| 2023 | £246,309.00 | 13,770 Properties |
| 2022 | £249,488.00 | 17,256 Properties |
| 2021 | £232,035.00 | 20,962 Properties |
| 2020 | £218,705.00 | 16,531 Properties |
| 2019 | £197,840.00 | 20,379 Properties |
| 2018 | £191,407.00 | 20,767 Properties |
| 2017 | £184,106.00 | 21,059 Properties |
| 2016 | £170,276.00 | 22,131 Properties |
| 2015 | £156,338.00 | 20,164 Properties |
| 2014 | £153,567.00 | 17,843 Properties |
| 2013 | £145,692.00 | 13,456 Properties |
| 2012 | £146,068.00 | 10,946 Properties |
| 2011 | £142,535.00 | 11,276 Properties |
| 2010 | £143,800.00 | 11,745 Properties |
| 2009 | £140,044.00 | 10,872 Properties |
| 2008 | £144,717.00 | 13,266 Properties |
| 2007 | £152,309.00 | 27,926 Properties |
| 2006 | £143,804.00 | 28,435 Properties |
| 2005 | £131,748.00 | 23,072 Properties |
| 2004 | £118,242.00 | 27,488 Properties |
| 2003 | £98,093.00 | 27,240 Properties |
| 2002 | £83,546.00 | 26,389 Properties |
| 2001 | £69,447.00 | 21,793 Properties |
| 2000 | £61,813.00 | 20,152 Properties |
| 1999 | £56,472.00 | 19,036 Properties |
| 1998 | £53,406.00 | 16,200 Properties |
| 1997 | £49,990.00 | 16,961 Properties |
| 1996 | £46,686.00 | 14,967 Properties |
| 1995 | £46,012.00 | 13,167 Properties |
Property Price per Property Type in M
Here you can find historic sold price data in order to help with your property search.
The average Property Paid Price for specific property types in the last three years are:
| Property Type | Average Sold Price | Sold Properties |
|---|---|---|
| Semi Detached House | £294,015.00 | 14,803 Semi Detached Houses |
| Terraced House | £221,423.00 | 14,856 Terraced Houses |
| Detached House | £438,907.00 | 3,435 Detached Houses |
| Flat | £185,822.00 | 9,229 Flats |
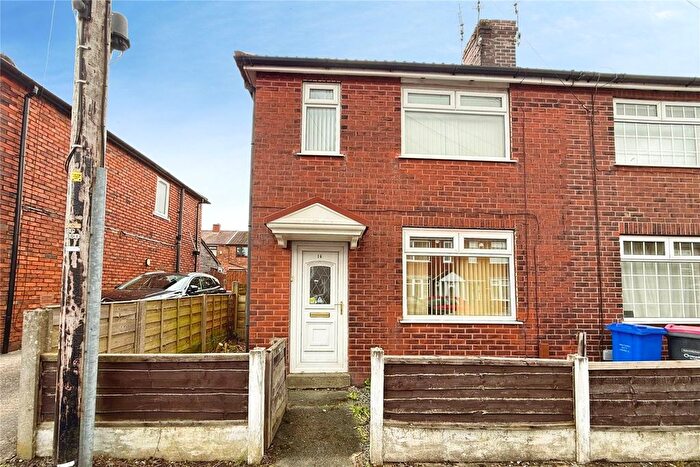
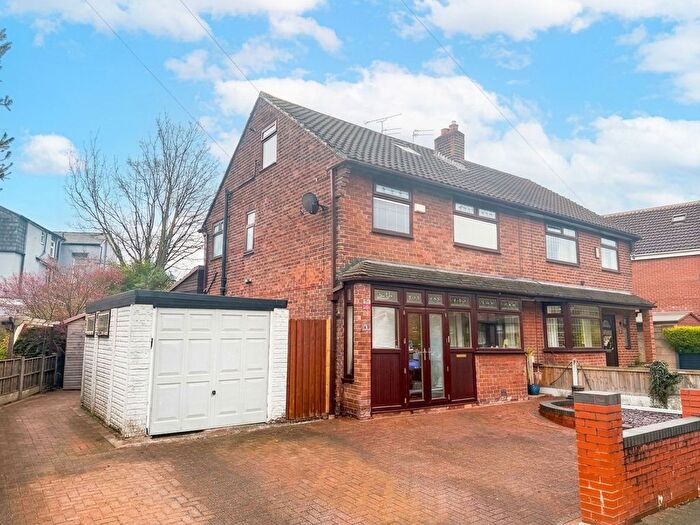
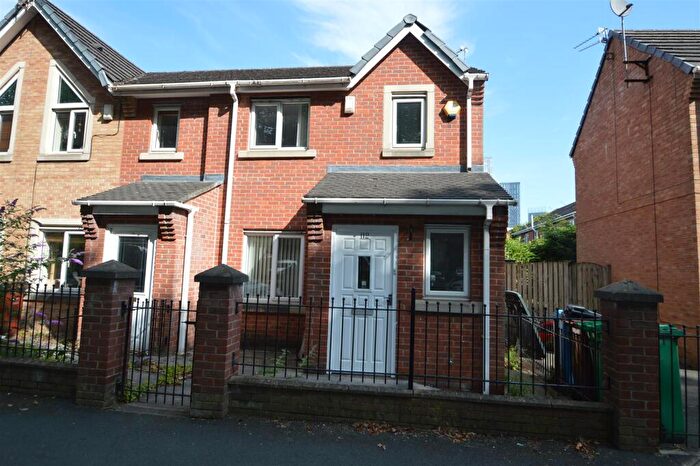
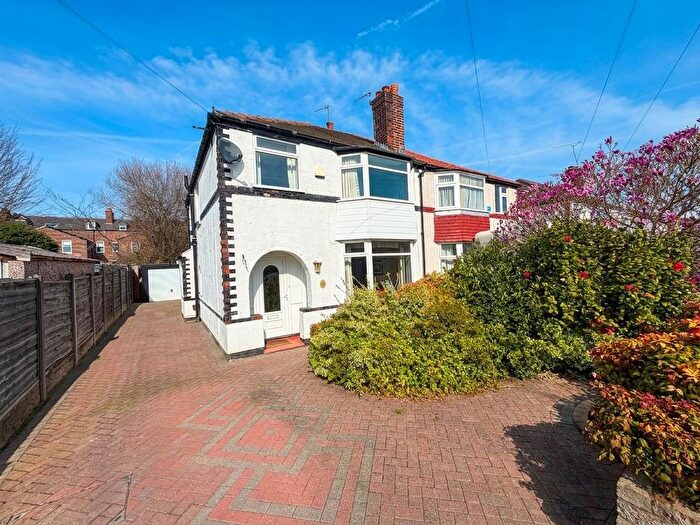
Houses and Flats for sale in M, Manchester
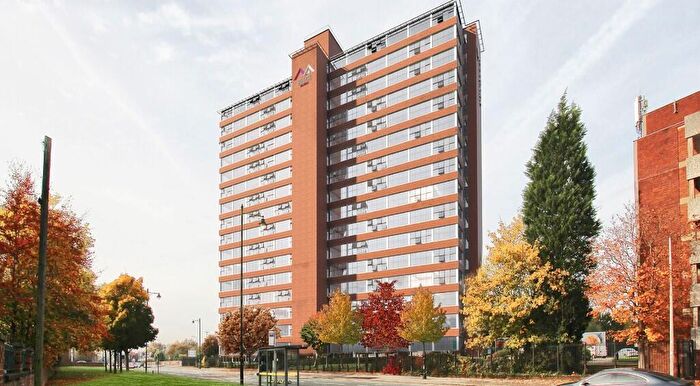
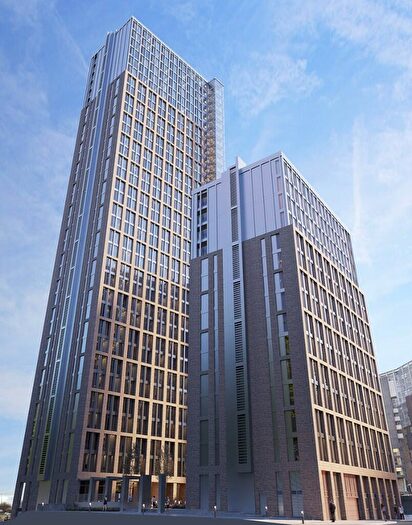
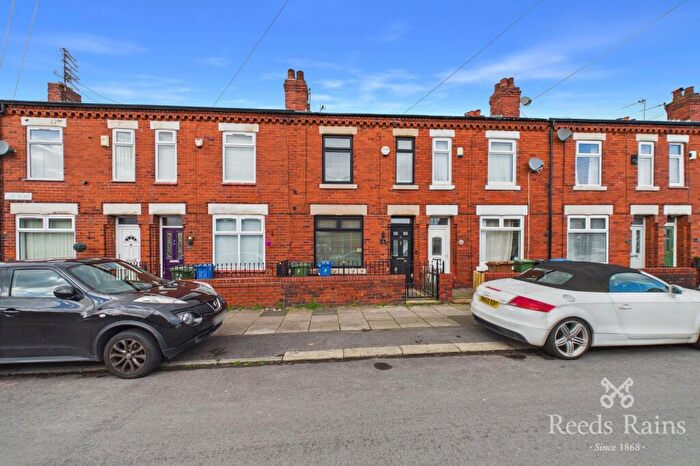

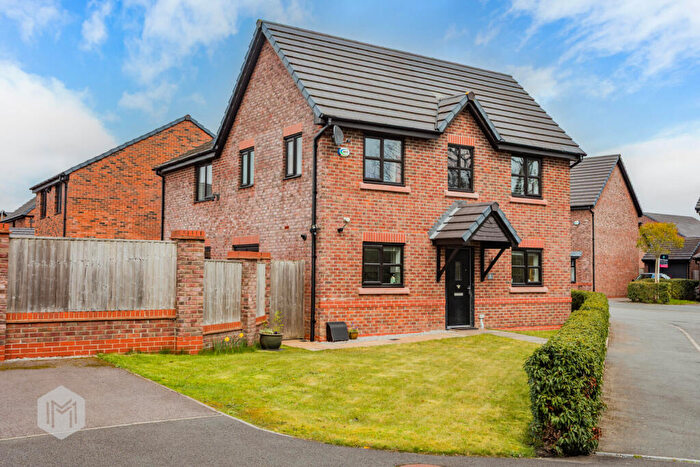
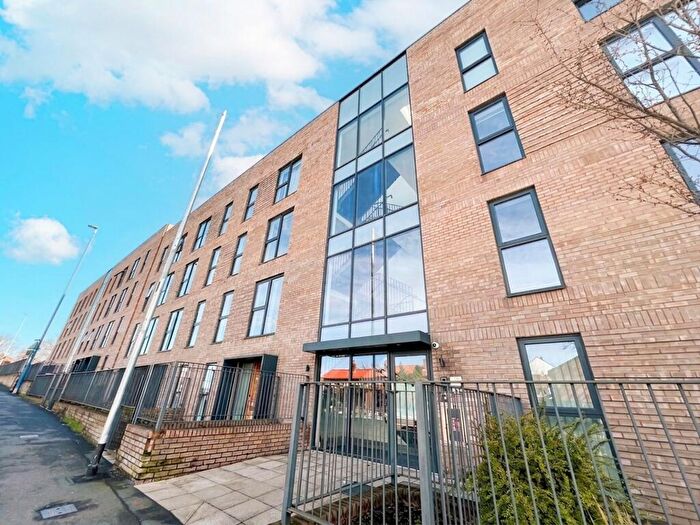
![]()
If you are looking to sell your house, let it out, or receive a property valuation, an expert can help you.
Click the button below to get started.
Postcode districts in M, Manchester
Navigate through our locations to find the location of your next house in M, Manchester, England for sale or to rent.
Transport in M, Manchester
Please see below transportation links in this area:
-
 Salford Crescent Station
 -
Salford Central Station
-
Deansgate Station
-
Manchester Oxford Road Station
-
Manchester Victoria Station
-
Manchester United Football Ground Station
-
Manchester Piccadilly Station
-
Trafford Park Station
-
Ardwick Station
-
Eccles Station
Frequently asked questions about M
What is the average price for a property for sale in M?
The average price for a property for sale in M is £256,701. This amount is 29% lower than the average price in England. There are 6,513 property listings for sale in M.
What locations have the most expensive properties for sale in M?
The locations with the most expensive properties for sale in M are M2 at an average of £598,693, M21 at an average of £409,302 and M33 at an average of £395,481.
What locations have the most affordable properties for sale in M?
The locations with the most affordable properties for sale in M are M38 at an average of £156,074, M18 at an average of £169,977 and M9 at an average of £174,091.
Which train stations are available in or near M?
Some of the train stations available in or near M are Salford Crescent, Salford Central and Deansgate.