
Houses for sale & to rent in Oakridge And Castlefield, High Wycombe
House Prices in Oakridge And Castlefield
Properties in Oakridge And Castlefield have an average house price of £265,819.00 and had 176 Property Transactions within the last 3 years¹.
Oakridge And Castlefield is an area in High Wycombe, Buckinghamshire with 2,964 households², where the most expensive property was sold for £625,000.00.
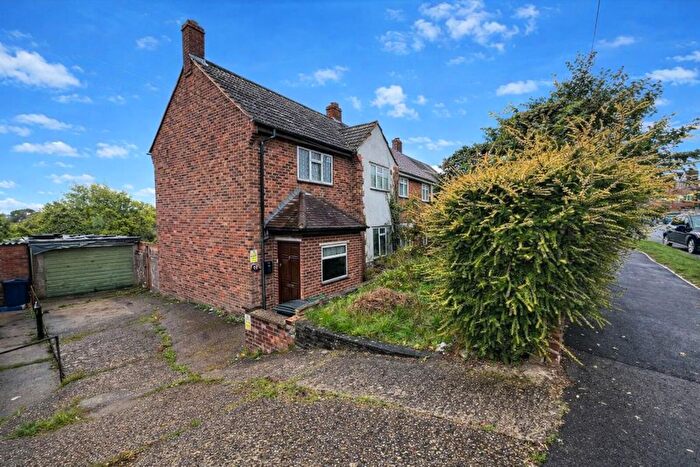
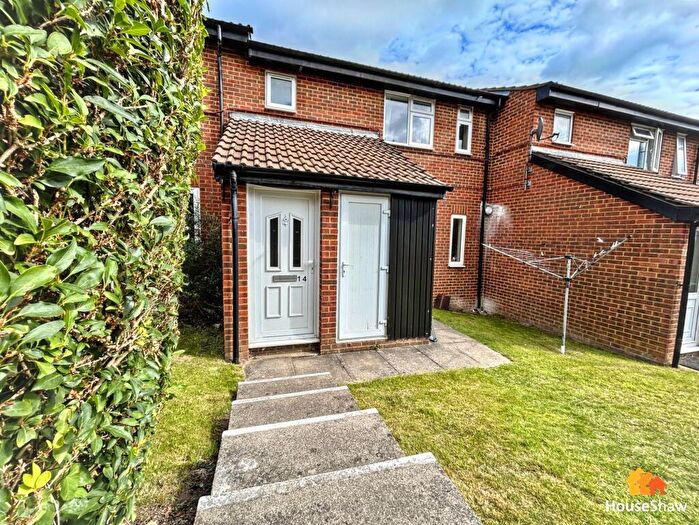
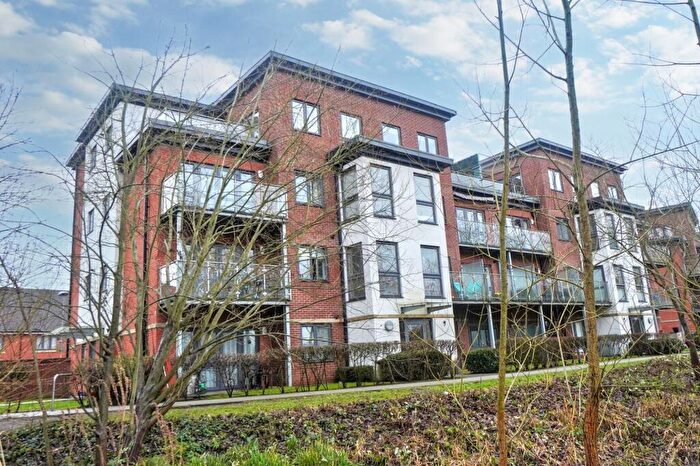
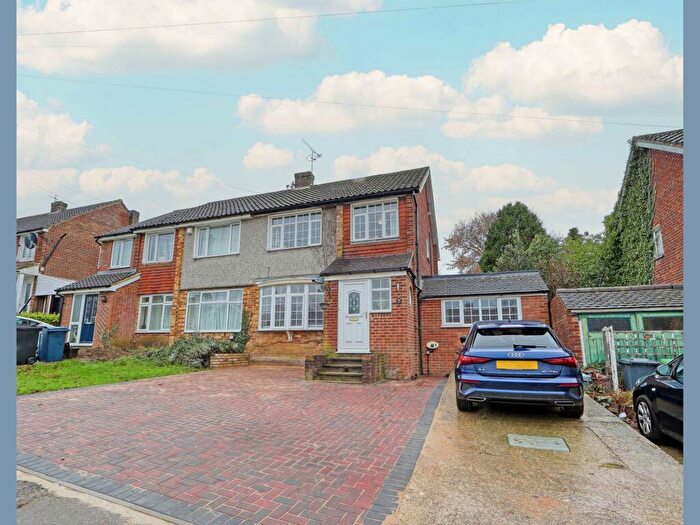
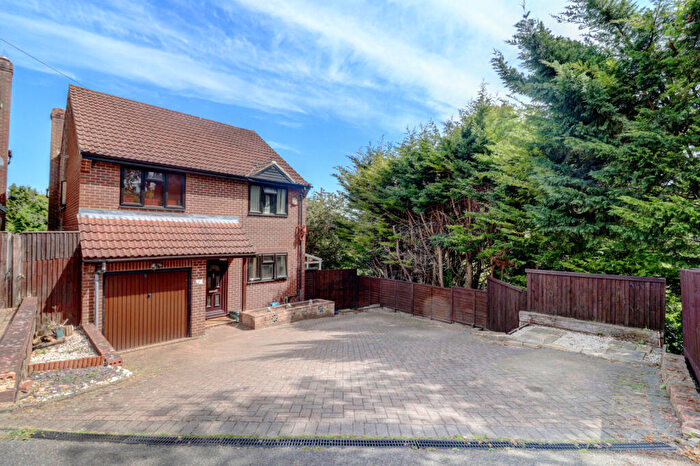
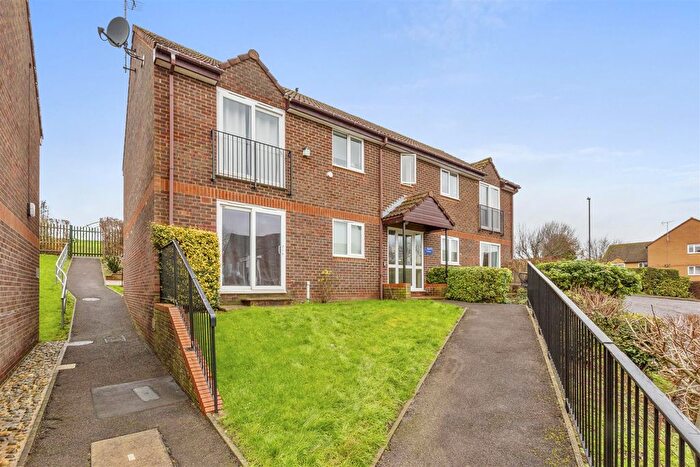
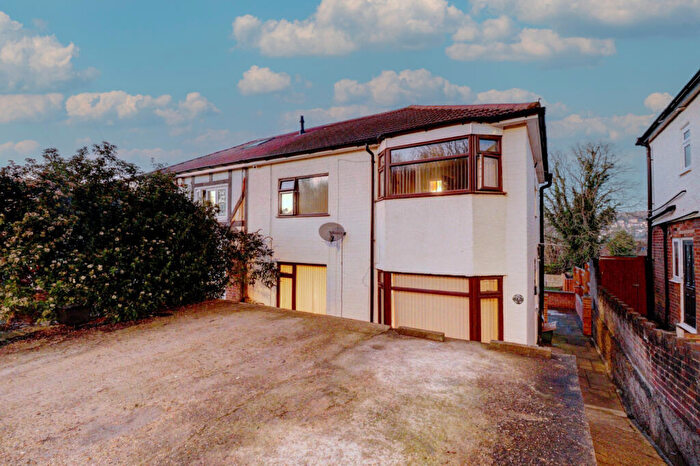
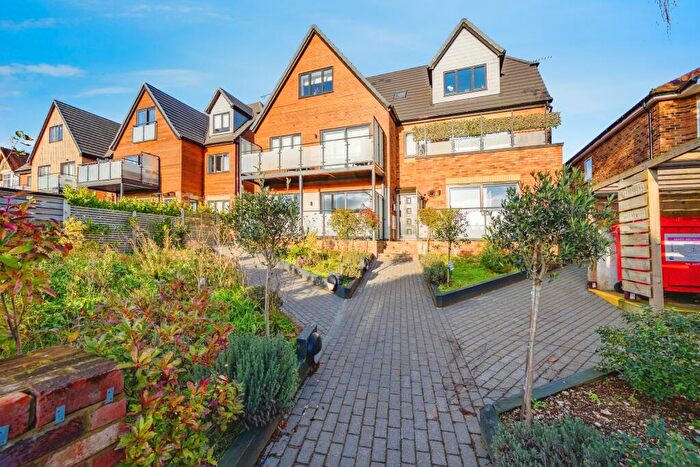
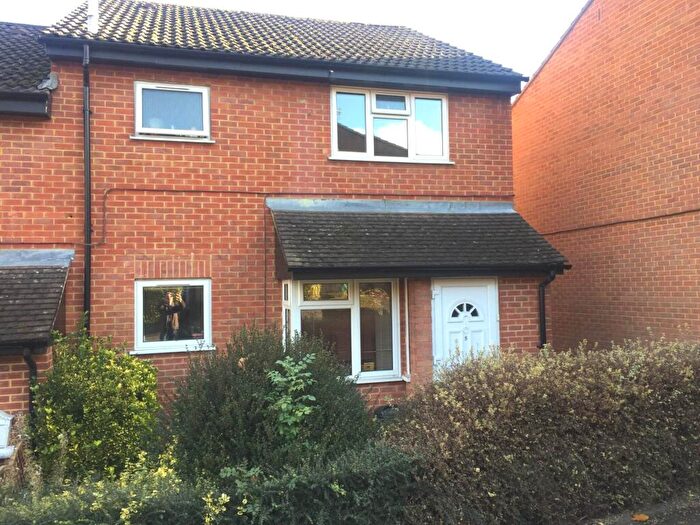
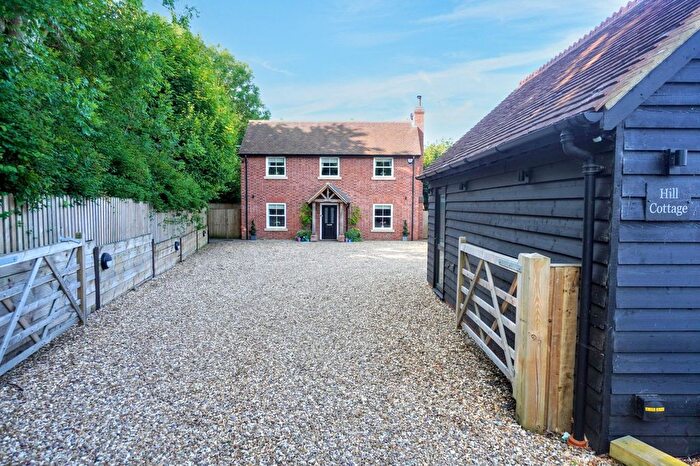
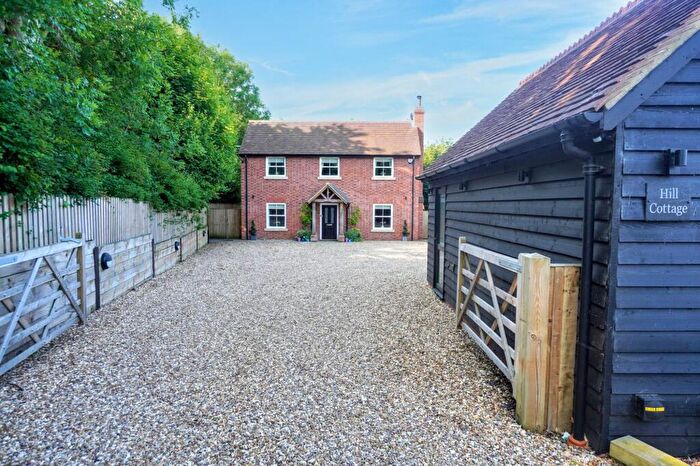
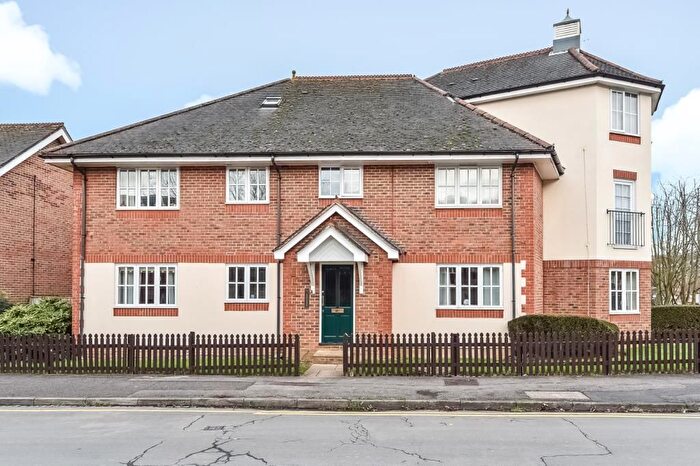
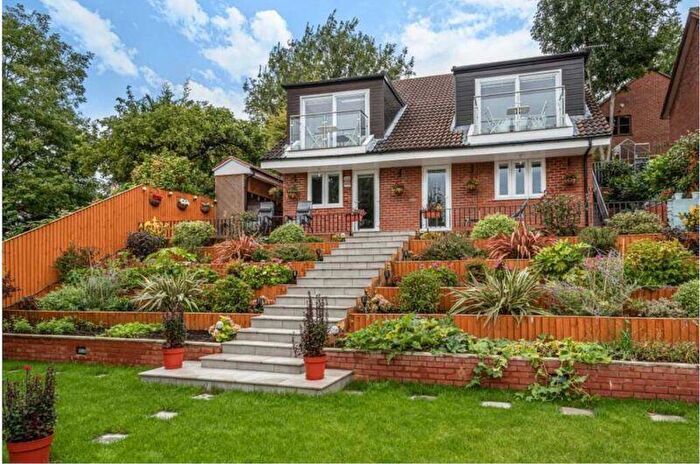
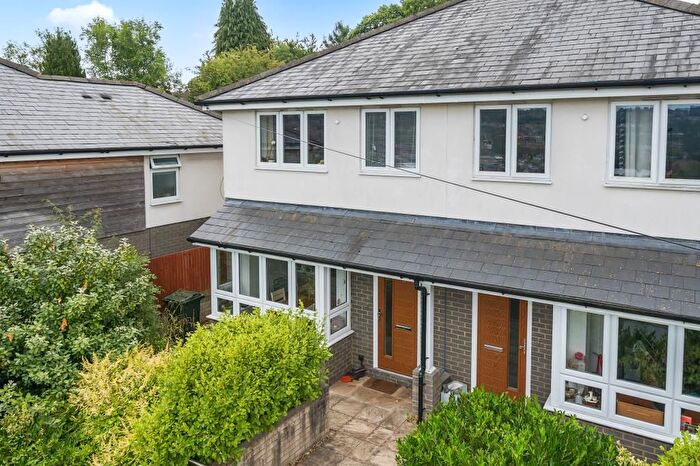
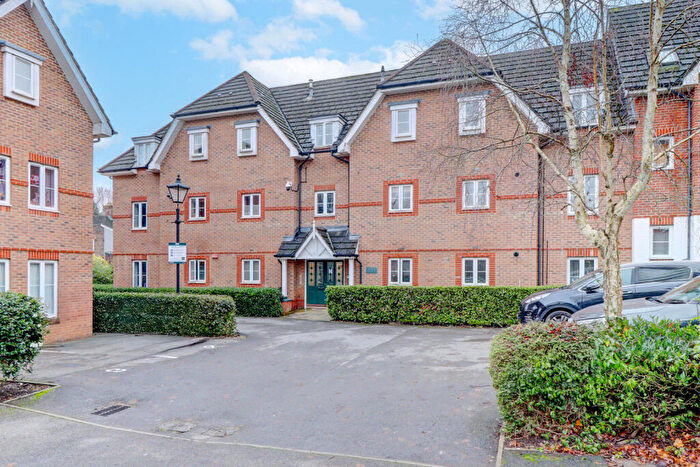
Properties for sale in Oakridge And Castlefield
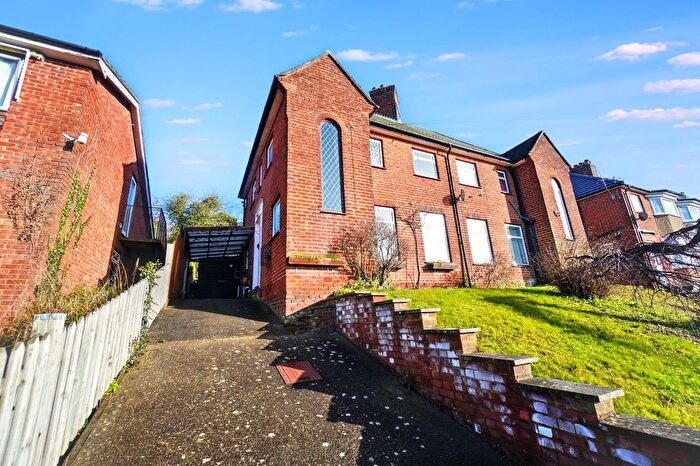

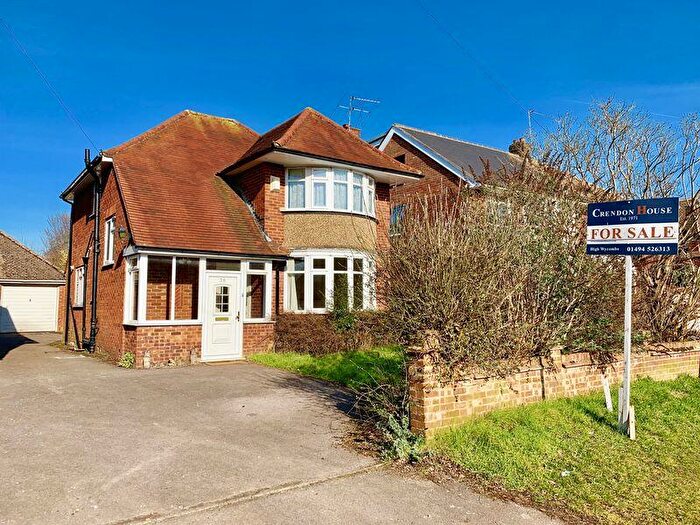
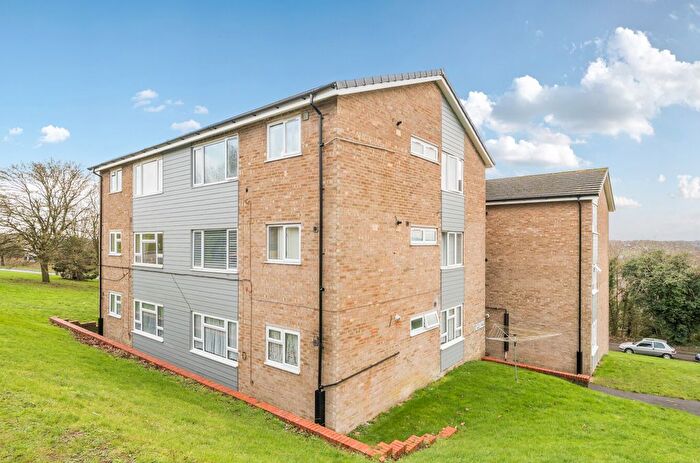
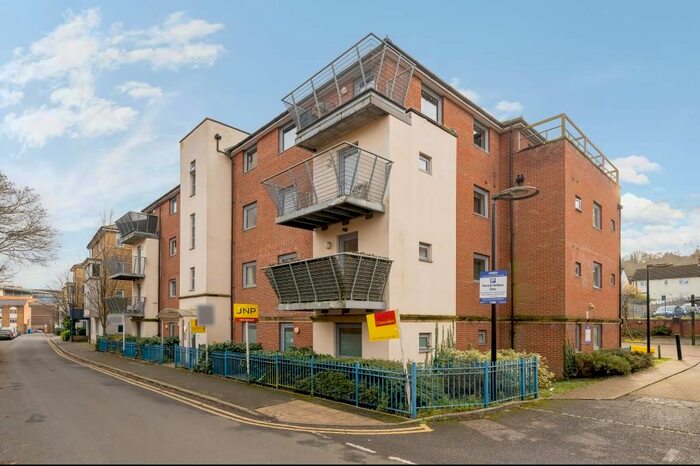
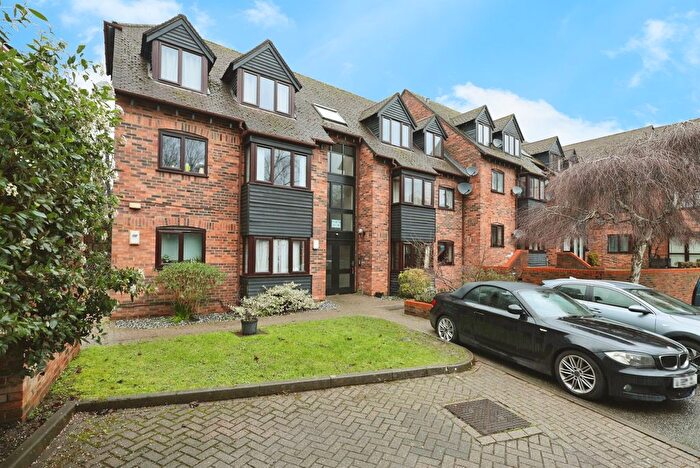
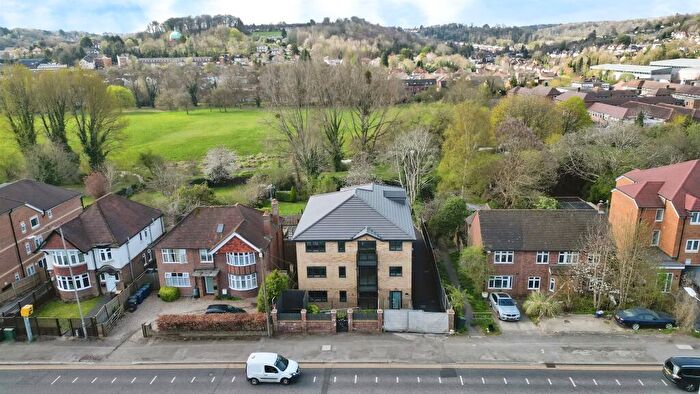
![]()
If you are looking to sell your house, let it out, or receive a property valuation, an expert can help you.
Click the button below to get started.


Roads and Postcodes in Oakridge And Castlefield
Navigate through our locations to find the location of your next house in Oakridge And Castlefield, High Wycombe for sale or to rent.
Transport near Oakridge And Castlefield

- FAQ
- Price Paid By Year
- Property Type Price
Frequently asked questions about Oakridge And Castlefield
What is the average price for a property for sale in Oakridge And Castlefield?
The average price for a property for sale in Oakridge And Castlefield is £265,819. This amount is 43% lower than the average price in High Wycombe. There are 1,591 property listings for sale in Oakridge And Castlefield.
What streets have the most expensive properties for sale in Oakridge And Castlefield?
The streets with the most expensive properties for sale in Oakridge And Castlefield are New Road at an average of £605,000, Ogilvie Road at an average of £440,000 and Juniper Drive at an average of £404,714.
What streets have the most affordable properties for sale in Oakridge And Castlefield?
The streets with the most affordable properties for sale in Oakridge And Castlefield are Tavistock Mews at an average of £166,800, Birches Rise at an average of £174,375 and Vipont Court at an average of £178,333.
Which train stations are available in or near Oakridge And Castlefield?
Some of the train stations available in or near Oakridge And Castlefield are High Wycombe, Saunderton and Marlow.
Property Price Paid in Oakridge And Castlefield by Year
The average sold property price by year was:
| Year | Average Sold Price | Price Change |
Sold Properties
|
|---|---|---|---|
| 2025 | £280,338 | 5% |
44 Properties |
| 2024 | £265,631 | 4% |
67 Properties |
| 2023 | £256,184 | -8% |
65 Properties |
| 2022 | £275,830 | 10% |
124 Properties |
| 2021 | £249,173 | 2% |
101 Properties |
| 2020 | £244,899 | -3% |
53 Properties |
| 2019 | £252,406 | 1% |
40 Properties |
| 2018 | £249,017 | -1% |
85 Properties |
| 2017 | £252,060 | 15% |
107 Properties |
| 2016 | £215,457 | 9% |
115 Properties |
| 2015 | £195,410 | 5% |
101 Properties |
| 2014 | £186,051 | 11% |
126 Properties |
| 2013 | £165,882 | 5% |
77 Properties |
| 2012 | £157,413 | -0,4% |
80 Properties |
| 2011 | £158,109 | 2% |
82 Properties |
| 2010 | £154,177 | 4% |
70 Properties |
| 2009 | £147,453 | -14% |
40 Properties |
| 2008 | £167,983 | -3% |
72 Properties |
| 2007 | £173,145 | 9% |
239 Properties |
| 2006 | £157,742 | 2% |
176 Properties |
| 2005 | £155,313 | 5% |
160 Properties |
| 2004 | £147,349 | 10% |
155 Properties |
| 2003 | £132,481 | 12% |
184 Properties |
| 2002 | £116,758 | 16% |
225 Properties |
| 2001 | £98,205 | 10% |
216 Properties |
| 2000 | £87,941 | 21% |
239 Properties |
| 1999 | £69,286 | 12% |
214 Properties |
| 1998 | £60,712 | 13% |
199 Properties |
| 1997 | £52,855 | 5% |
189 Properties |
| 1996 | £50,246 | 3% |
143 Properties |
| 1995 | £48,922 | - |
121 Properties |
Property Price per Property Type in Oakridge And Castlefield
Here you can find historic sold price data in order to help with your property search.
The average Property Paid Price for specific property types in the last three years are:
| Property Type | Average Sold Price | Sold Properties |
|---|---|---|
| Semi Detached House | £323,869.00 | 47 Semi Detached Houses |
| Detached House | £463,055.00 | 9 Detached Houses |
| Terraced House | £301,862.00 | 40 Terraced Houses |
| Flat | £191,504.00 | 80 Flats |