
Houses for sale & to rent in Disraeli, High Wycombe
House Prices in Disraeli
Properties in Disraeli have an average house price of £368k and had 170 Property Transactions within the last 3 years¹.
Disraeli is an area in High Wycombe, Buckinghamshire with 2,082 households², where the most expensive property was sold for £715k.
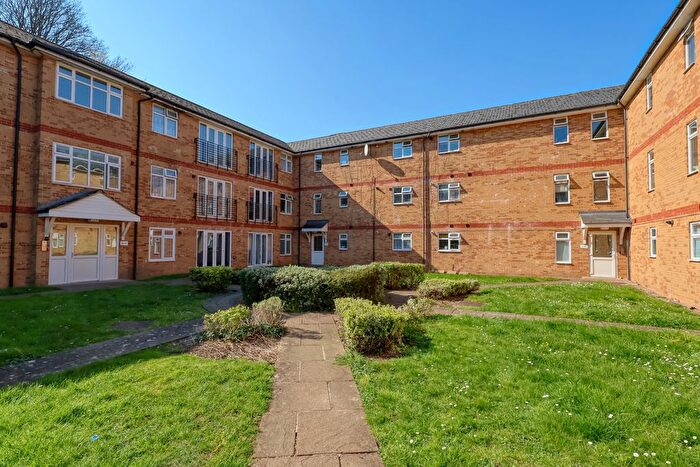
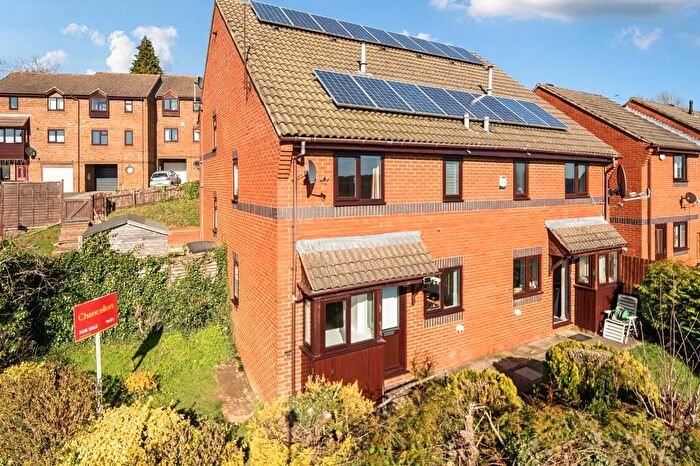
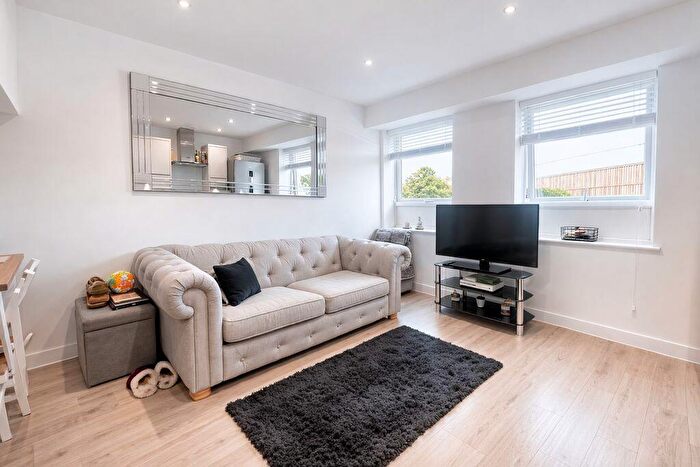
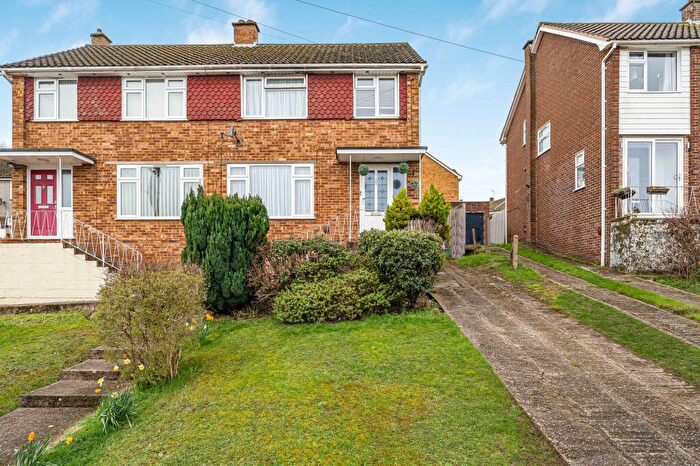
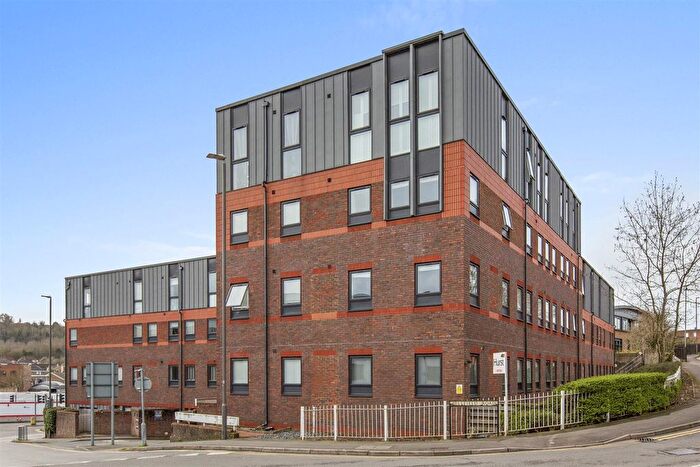
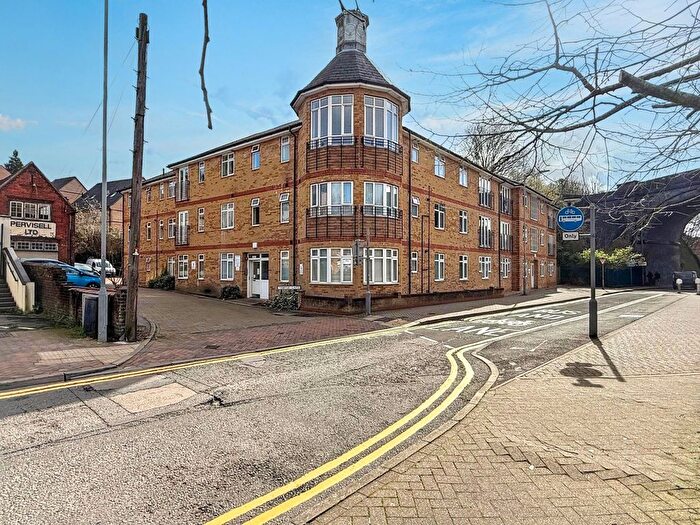
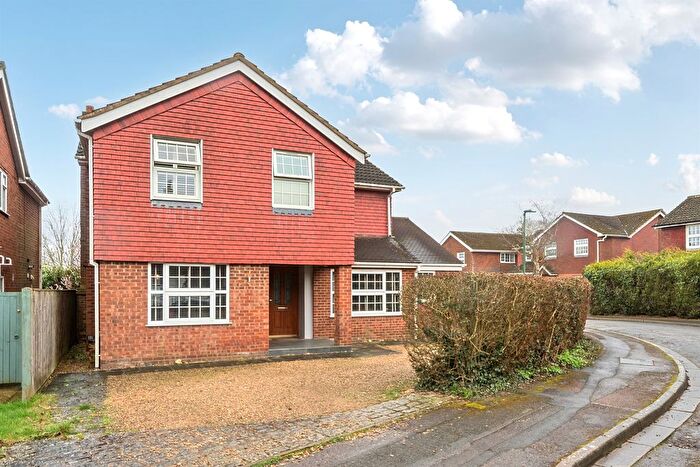
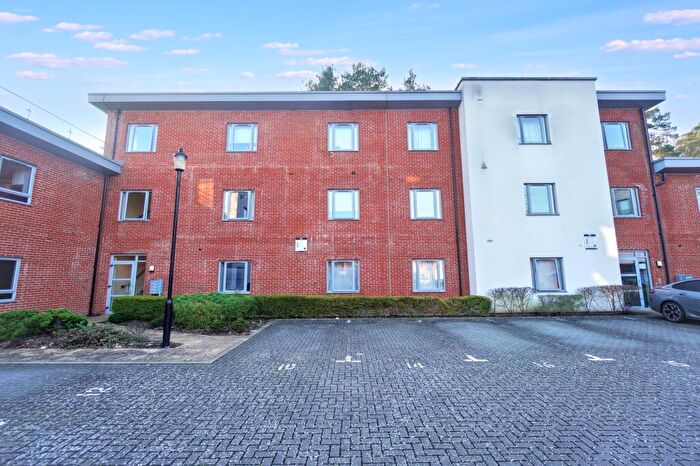
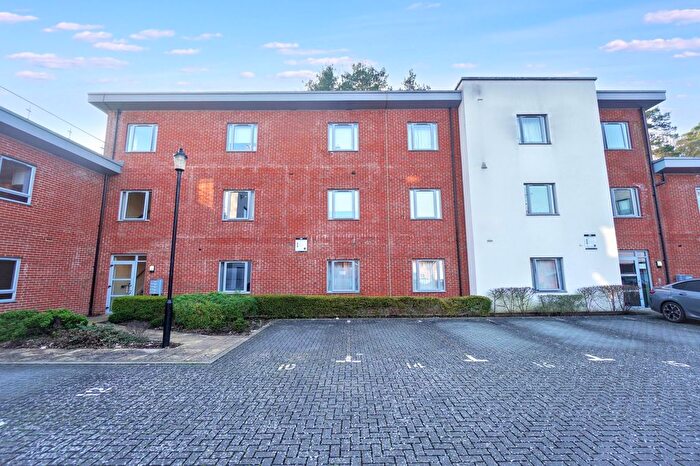
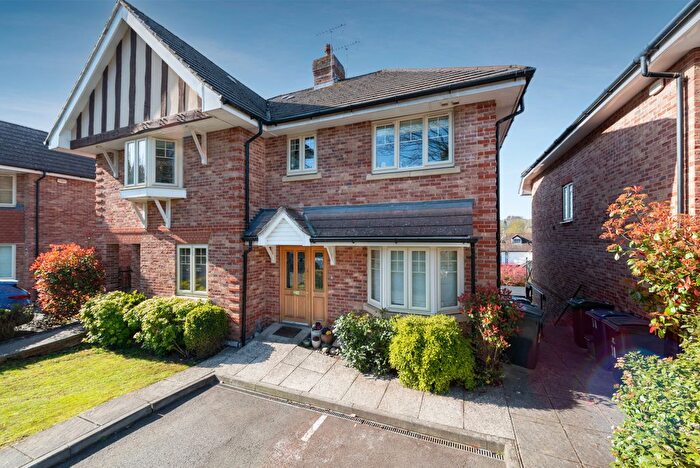
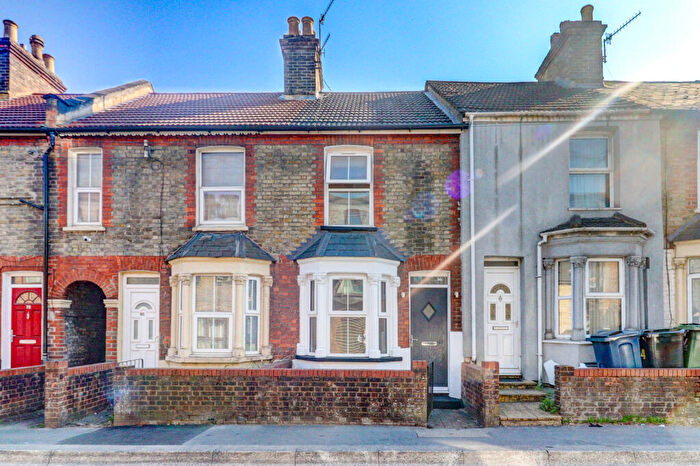
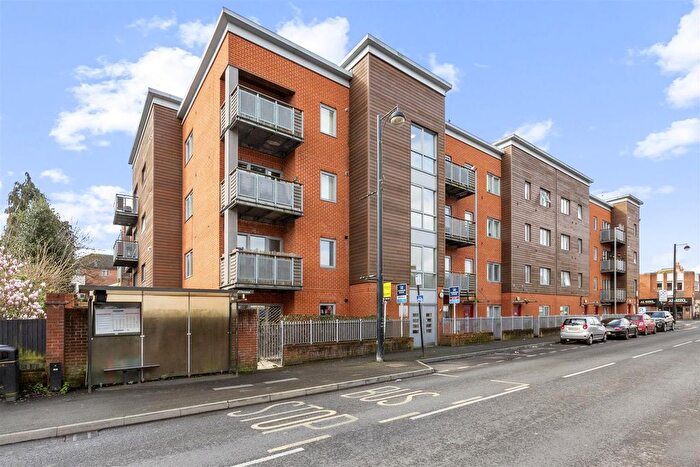
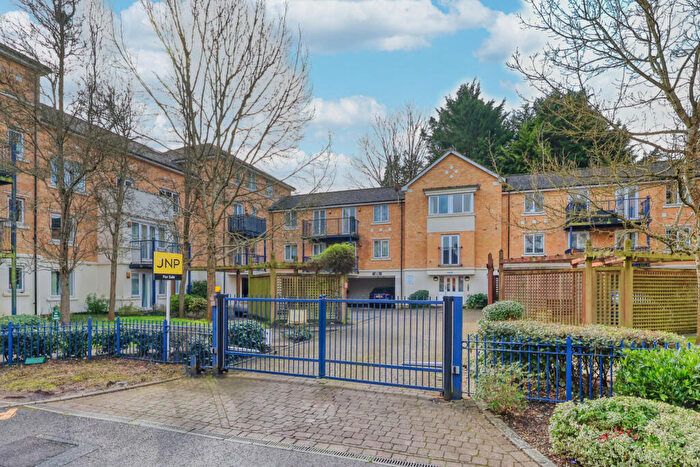
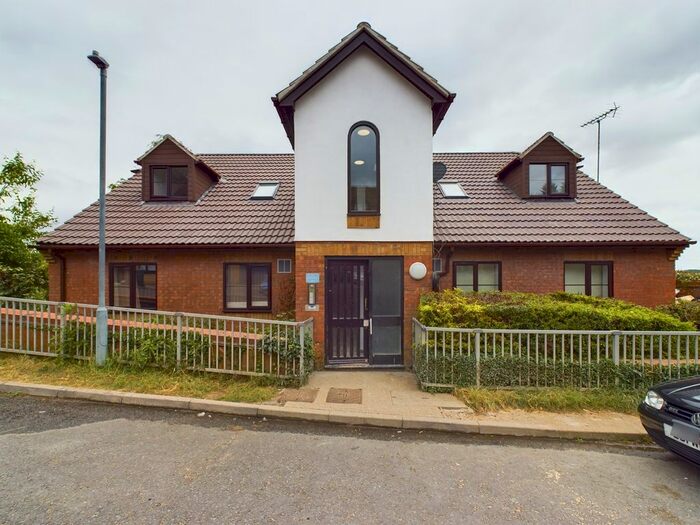
Properties for sale in Disraeli
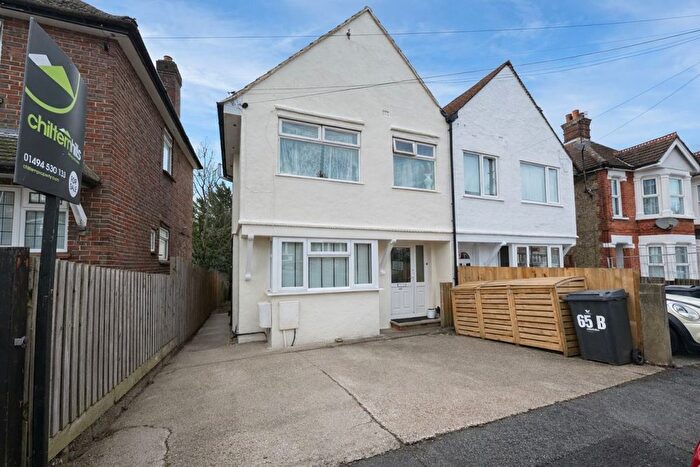
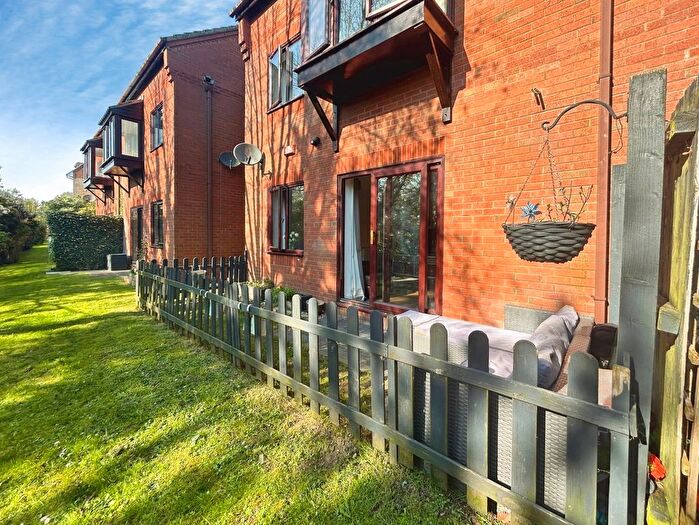
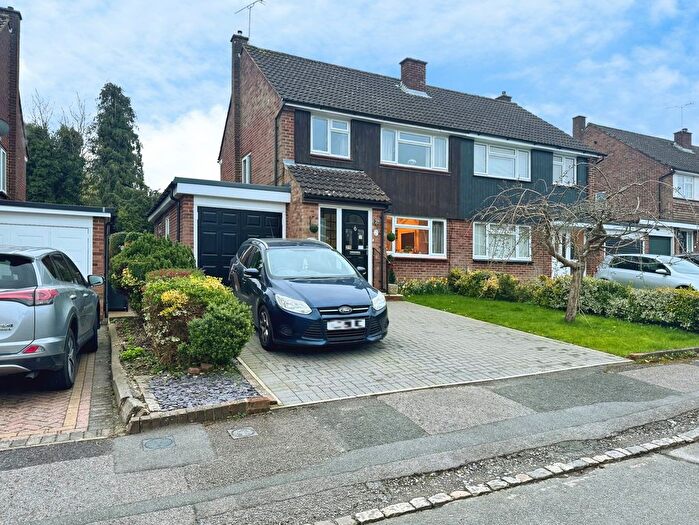

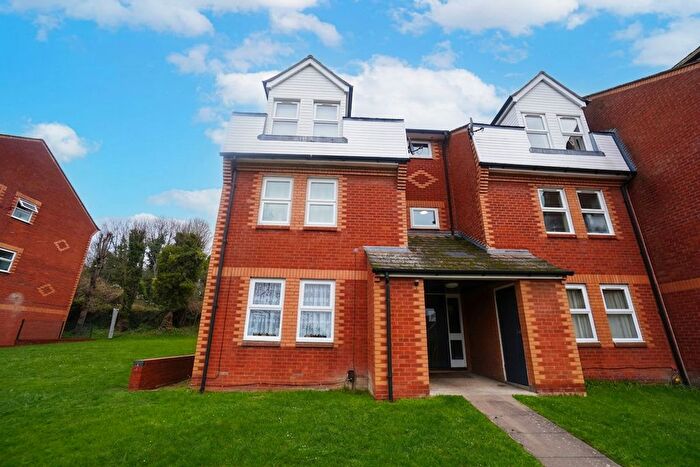
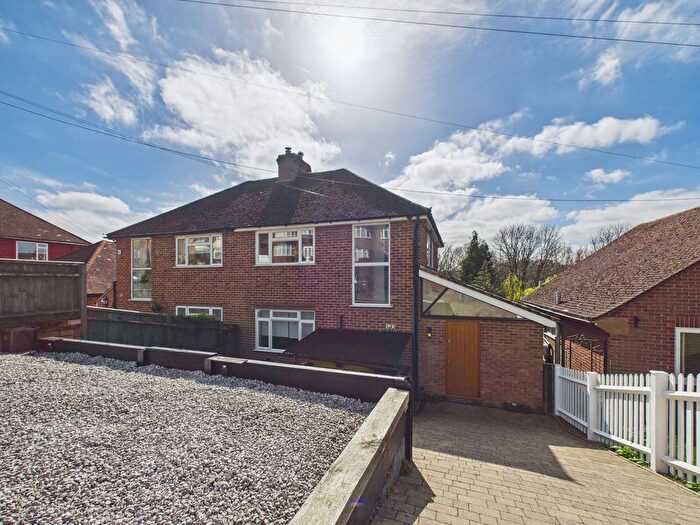
![]()
If you are looking to sell your house, let it out, or receive a property valuation, an expert can help you.
Click the button below to get started.


Roads and Postcodes in Disraeli
Navigate through our locations to find the location of your next house in Disraeli, High Wycombe for sale or to rent.
Transport near Disraeli

- FAQ
- Price Paid By Year
- Property Type Price
Frequently asked questions about Disraeli
What is the average price for a property for sale in Disraeli?
The average price for a property for sale in Disraeli is £368,115. This amount is 20% lower than the average price in High Wycombe. There are 1,435 property listings for sale in Disraeli.
What streets have the most expensive properties for sale in Disraeli?
The streets with the most expensive properties for sale in Disraeli are Wyndham Avenue at an average of £643,500, Coates Lane at an average of £641,666 and Beaconsfield Avenue at an average of £585,000.
What streets have the most affordable properties for sale in Disraeli?
The streets with the most affordable properties for sale in Disraeli are The Acres at an average of £177,500, Malvern Close at an average of £178,000 and Gandon Vale at an average of £207,916.
Which train stations are available in or near Disraeli?
Some of the train stations available in or near Disraeli are High Wycombe, Saunderton and Marlow.
Property Price Paid in Disraeli by Year
The average sold property price by year was:
| Year | Average Sold Price | Price Change |
Sold Properties
|
|---|---|---|---|
| 2025 | £361,097 | -5% |
74 Properties |
| 2024 | £377,842 | 2% |
49 Properties |
| 2023 | £369,025 | 4% |
47 Properties |
| 2022 | £353,186 | 8% |
67 Properties |
| 2021 | £323,463 | 10% |
104 Properties |
| 2020 | £291,945 | -12% |
61 Properties |
| 2019 | £325,797 | 3% |
73 Properties |
| 2018 | £314,944 | 4% |
77 Properties |
| 2017 | £303,208 | 5% |
81 Properties |
| 2016 | £289,003 | 14% |
85 Properties |
| 2015 | £247,374 | -4% |
94 Properties |
| 2014 | £256,918 | 7% |
124 Properties |
| 2013 | £239,207 | 17% |
100 Properties |
| 2012 | £197,462 | 2% |
59 Properties |
| 2011 | £193,616 | -10% |
51 Properties |
| 2010 | £212,626 | 11% |
51 Properties |
| 2009 | £189,729 | -5% |
55 Properties |
| 2008 | £199,578 | -2% |
44 Properties |
| 2007 | £204,218 | 9% |
142 Properties |
| 2006 | £186,270 | 6% |
135 Properties |
| 2005 | £175,809 | 1% |
116 Properties |
| 2004 | £174,883 | 12% |
132 Properties |
| 2003 | £153,294 | 13% |
149 Properties |
| 2002 | £133,545 | 15% |
146 Properties |
| 2001 | £113,861 | 6% |
125 Properties |
| 2000 | £106,535 | 19% |
146 Properties |
| 1999 | £86,683 | 4% |
144 Properties |
| 1998 | £83,548 | 20% |
122 Properties |
| 1997 | £67,248 | -1% |
121 Properties |
| 1996 | £68,093 | 8% |
129 Properties |
| 1995 | £62,846 | - |
93 Properties |
Property Price per Property Type in Disraeli
Here you can find historic sold price data in order to help with your property search.
The average Property Paid Price for specific property types in the last three years are:
| Property Type | Average Sold Price | Sold Properties |
|---|---|---|
| Semi Detached House | £408,359.00 | 54 Semi Detached Houses |
| Detached House | £576,222.00 | 18 Detached Houses |
| Terraced House | £356,460.00 | 66 Terraced Houses |
| Flat | £207,184.00 | 32 Flats |