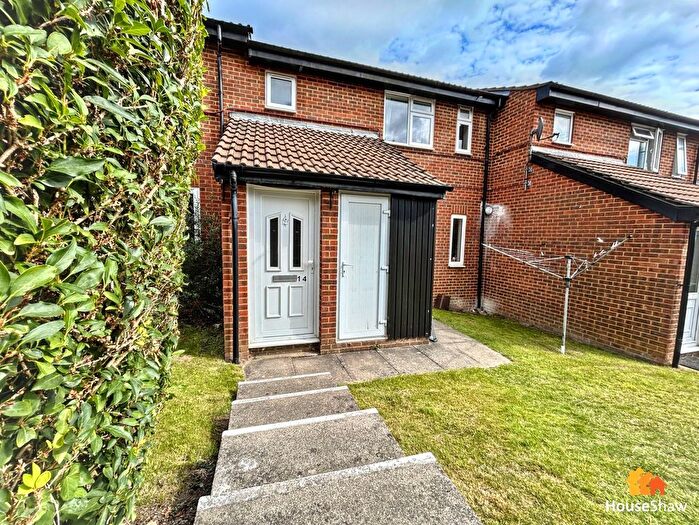
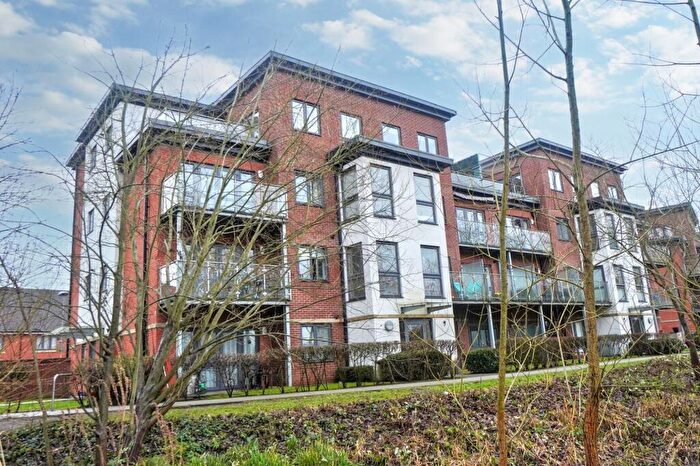
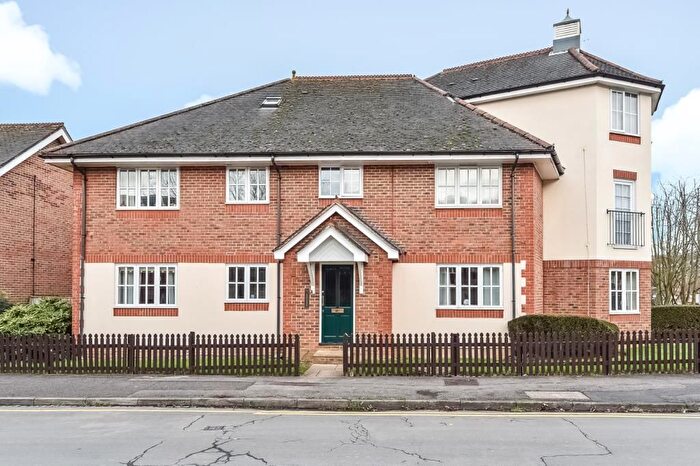
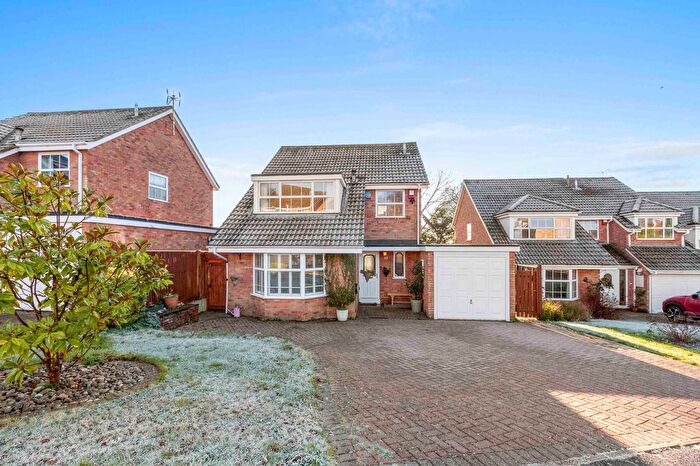
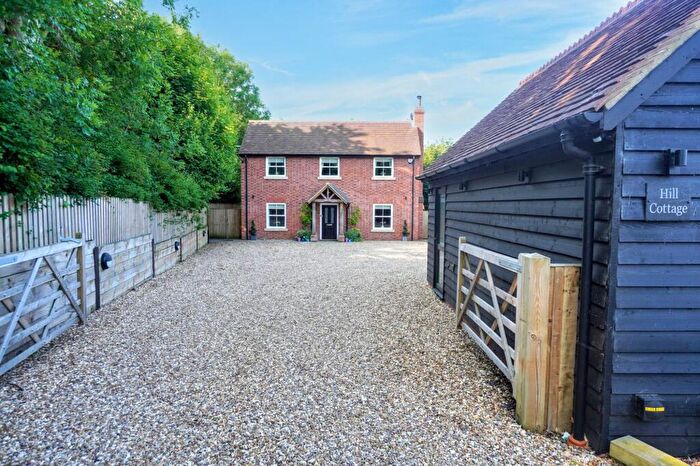
Houses for sale & to rent in Sands, High Wycombe
House Prices in Sands
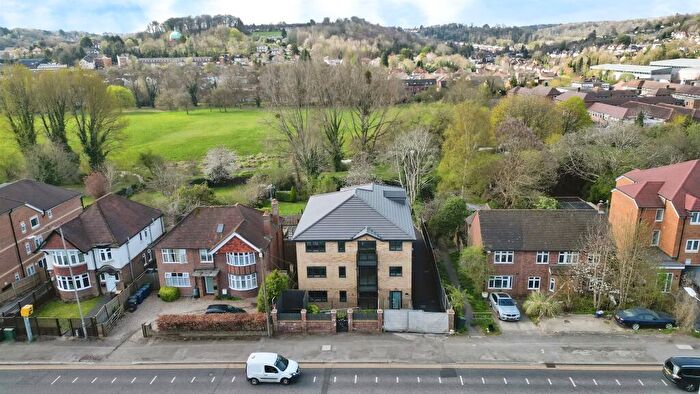
Properties in Sands have an average house price of £342,122.00 and had 235 Property Transactions within the last 3 years¹.
Sands is an area in High Wycombe, Buckinghamshire with 2,272 households², where the most expensive property was sold for £925,000.00.
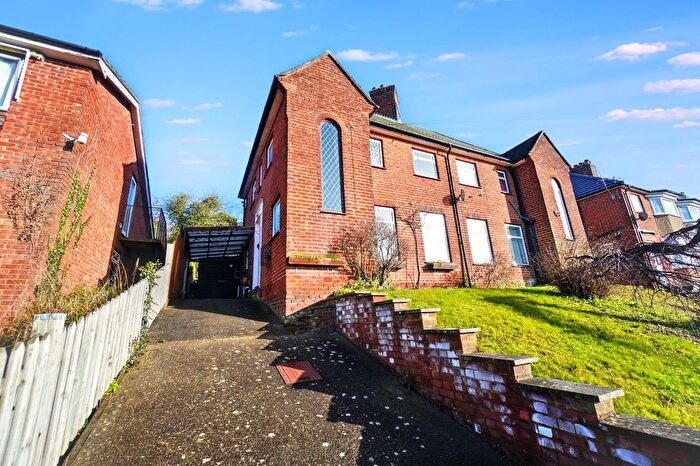
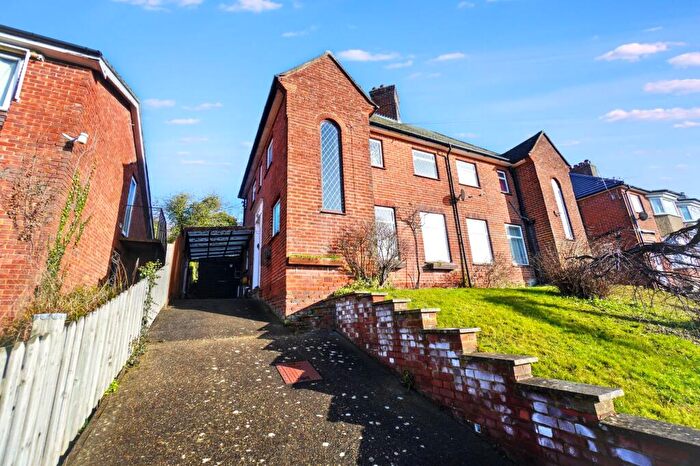
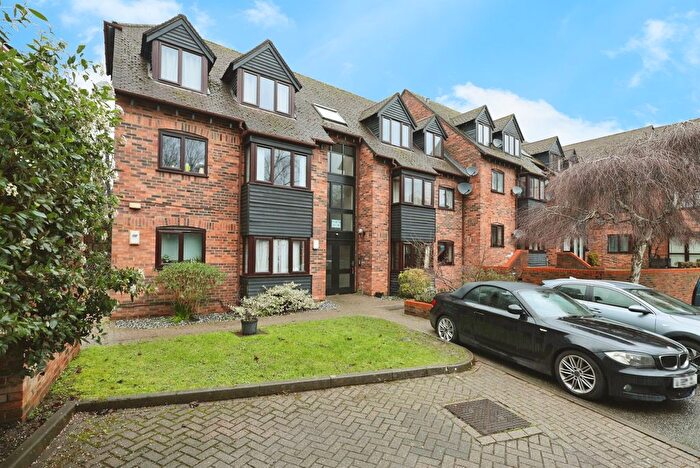
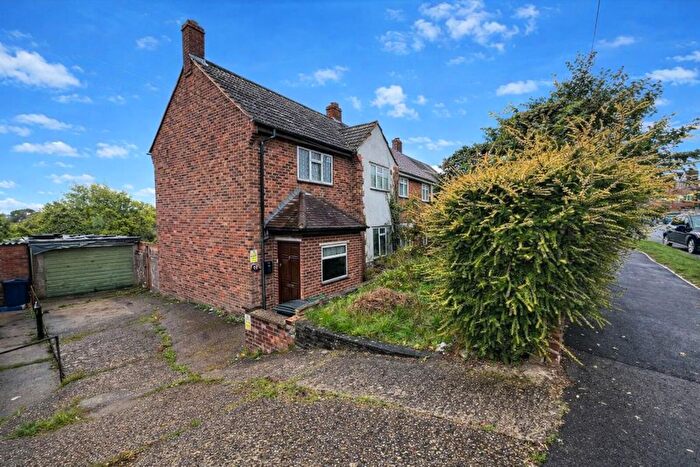
Properties for sale in Sands
Roads and Postcodes in Sands
Navigate through our locations to find the location of your next house in Sands, High Wycombe for sale or to rent.
| Streets | Postcodes |
|---|---|
| Abercromby Avenue | HP12 3BJ HP12 3BN HP12 3BY |
| Applewick Lane | HP12 4DS |
| Arundel Road | HP12 4NB HP12 4ND HP12 4NE HP12 4NF |
| Barn Court | HP12 4LQ |
| Bartlett Place | HP12 3ER |
| Bevelwood Gardens | HP12 3EZ |
| Birchwood Close | HP12 4QH |
| Bookerhill Road | HP12 4EU HP12 4EX HP12 4EY HP12 4EZ HP12 4HA |
| Carisbrooke Avenue | HP12 4NL |
| Carrs Drive | HP12 4BT |
| Chapel Lane | HP12 4BJ HP12 4BS HP12 4BY |
| Combe Rise | HP12 4JE |
| Dashwood Avenue | HP12 3DB HP12 3DD HP12 3EB HP12 3EE HP12 3FG |
| Desborough Park Road | HP12 3EF |
| Eaton Avenue | HP12 3AT HP12 3BP HP12 3BS HP12 3BU |
| Eaton Place | HP12 3AU |
| Edmunds Close | HP12 4ES |
| Edmunds Gardens | HP12 4LP |
| Field Road | HP12 4LR |
| Five Acre Wood | HP12 4LD |
| Fraser Road | HP12 4RP HP12 4RR |
| Fryers Lane | HP12 3AN HP12 3DU |
| Gallows Lane | HP12 4BP HP12 4BX |
| Gilletts Lane | HP12 4BB |
| Grove Road | HP12 4DW |
| Heathfield Road | HP12 4DG HP12 4DQ |
| High Beeches | HP12 4HT |
| Highwood Avenue | HP12 4LS HP12 4LT |
| Highwood Crescent | HP12 4LY HP12 4LZ HP12 4NA |
| Hillbottom Road | HP12 4HJ |
| Hylton Road | HP12 4BZ |
| Lane End Road | HP12 4HF HP12 4HX HP12 4JF |
| Mentmore Close | HP12 4LX |
| Mentmore Road | HP12 4LU |
| Mill End Road | HP12 4AX HP12 4JN HP12 4JP HP12 4JR HP12 4JY |
| New Road | HP12 4LA HP12 4LG HP12 4LH |
| New Road Close | HP12 4LE |
| Park View Court | HP12 3AY |
| Penmoor Close | HP12 4BU |
| Pinewood Road | HP12 4DA HP12 4DD |
| Prestwood Close | HP12 3DE |
| Roundwood Road | HP12 4HD HP12 4HE |
| Rydal Way | HP12 4NS |
| St Georges Court | HP12 3EU |
| Stanley Road | HP12 4DB |
| Templeside Gardens | HP12 3FQ |
| Toweridge Lane | HP12 4DF HP12 4DH |
| Walnut Tree Close | HP12 4DE |
| Warwick Avenue | HP12 4NG |
| West Wycombe Road | HP12 3AP HP12 3AR HP12 3AS HP12 3AW HP12 3DF HP12 4AA HP12 4AB |
| Woodland Close | HP12 4HB |
| Wychwood Gardens | HP12 4LJ |
| Youens Road | HP12 4RW |
Transport near Sands
- FAQ
- Price Paid By Year
- Property Type Price
Frequently asked questions about Sands
What is the average price for a property for sale in Sands?
The average price for a property for sale in Sands is £342,122. This amount is 26% lower than the average price in High Wycombe. There are 1,227 property listings for sale in Sands.
What streets have the most expensive properties for sale in Sands?
The streets with the most expensive properties for sale in Sands are Heathfield Road at an average of £885,000, Stanley Road at an average of £690,000 and Toweridge Lane at an average of £611,250.
What streets have the most affordable properties for sale in Sands?
The streets with the most affordable properties for sale in Sands are Bevelwood Gardens at an average of £155,100, St Georges Court at an average of £178,277 and High Beeches at an average of £185,700.
Which train stations are available in or near Sands?
Some of the train stations available in or near Sands are High Wycombe, Saunderton and Marlow.
Property Price Paid in Sands by Year
The average sold property price by year was:
| Year | Average Sold Price | Price Change |
Sold Properties
|
|---|---|---|---|
| 2025 | £350,375 | 1% |
66 Properties |
| 2024 | £348,034 | 7% |
108 Properties |
| 2023 | £322,726 | -9% |
61 Properties |
| 2022 | £352,597 | 9% |
105 Properties |
| 2021 | £320,880 | -5% |
139 Properties |
| 2020 | £337,371 | 2% |
71 Properties |
| 2019 | £331,111 | 5% |
89 Properties |
| 2018 | £315,182 | -0,3% |
93 Properties |
| 2017 | £316,046 | 14% |
111 Properties |
| 2016 | £270,454 | 6% |
122 Properties |
| 2015 | £252,922 | 6% |
110 Properties |
| 2014 | £236,744 | 5% |
125 Properties |
| 2013 | £223,989 | 11% |
99 Properties |
| 2012 | £198,952 | -5% |
71 Properties |
| 2011 | £209,813 | 8% |
58 Properties |
| 2010 | £193,675 | 2% |
70 Properties |
| 2009 | £190,478 | -9% |
82 Properties |
| 2008 | £207,762 | -0,3% |
88 Properties |
| 2007 | £208,428 | 10% |
156 Properties |
| 2006 | £188,458 | 5% |
175 Properties |
| 2005 | £179,707 | -3% |
106 Properties |
| 2004 | £184,200 | 12% |
153 Properties |
| 2003 | £162,113 | 13% |
146 Properties |
| 2002 | £141,757 | 13% |
182 Properties |
| 2001 | £123,289 | 12% |
171 Properties |
| 2000 | £107,940 | 11% |
156 Properties |
| 1999 | £96,227 | 24% |
191 Properties |
| 1998 | £72,858 | -4% |
151 Properties |
| 1997 | £75,742 | 5% |
169 Properties |
| 1996 | £71,915 | 12% |
137 Properties |
| 1995 | £62,930 | - |
89 Properties |
Property Price per Property Type in Sands
Here you can find historic sold price data in order to help with your property search.
The average Property Paid Price for specific property types in the last three years are:
| Property Type | Average Sold Price | Sold Properties |
|---|---|---|
| Semi Detached House | £398,145.00 | 85 Semi Detached Houses |
| Detached House | £552,982.00 | 28 Detached Houses |
| Terraced House | £334,725.00 | 30 Terraced Houses |
| Flat | £228,600.00 | 92 Flats |

