
Houses for sale & to rent in SL1 8JY, Dropmore View, Burnham Church, Slough
House Prices in SL1 8JY, Dropmore View, Burnham Church
Properties in SL1 8JY have no sales history available within the last 3 years. SL1 8JY is a postcode in Dropmore View located in Burnham Church, an area in Slough, Buckinghamshire, with 2 households².
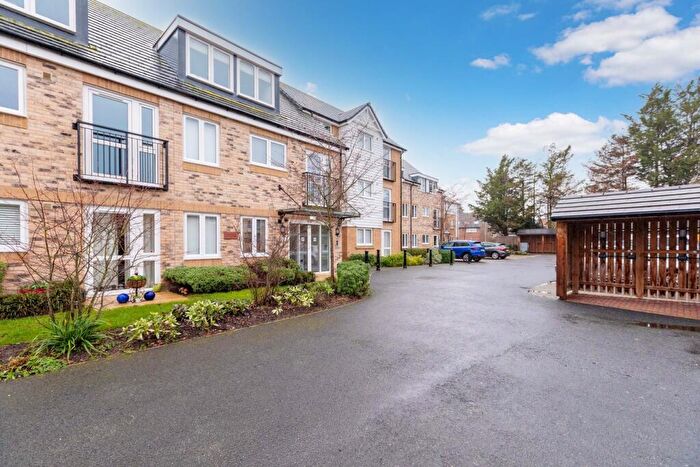
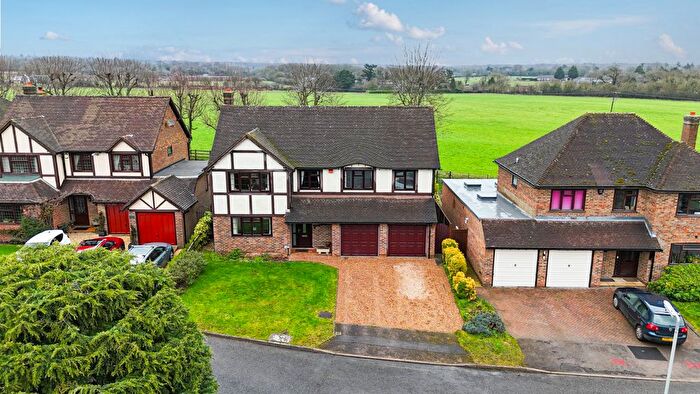
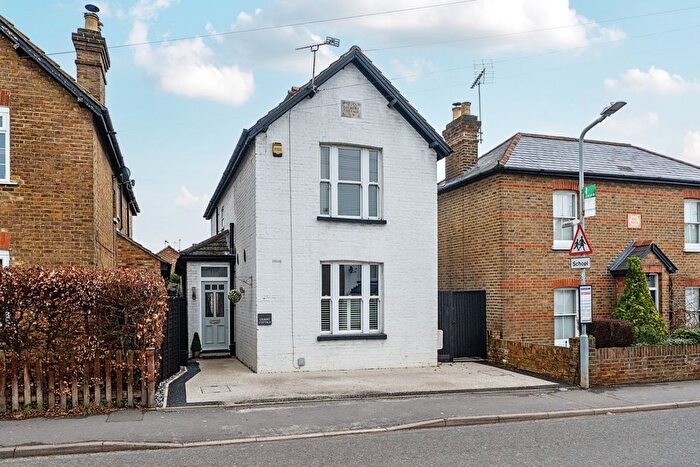
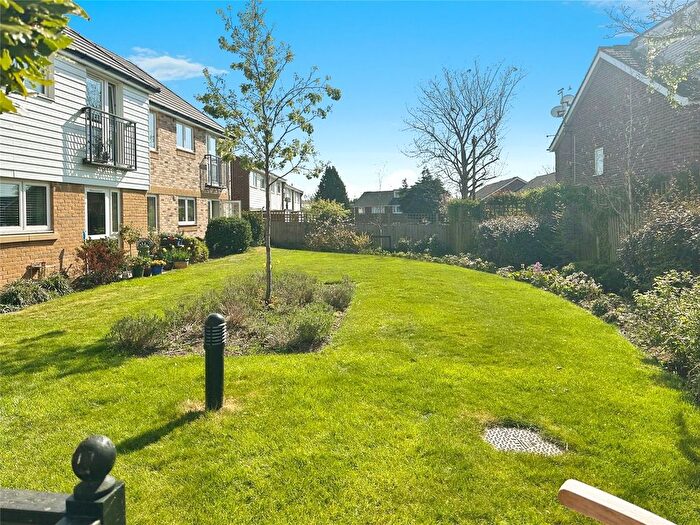
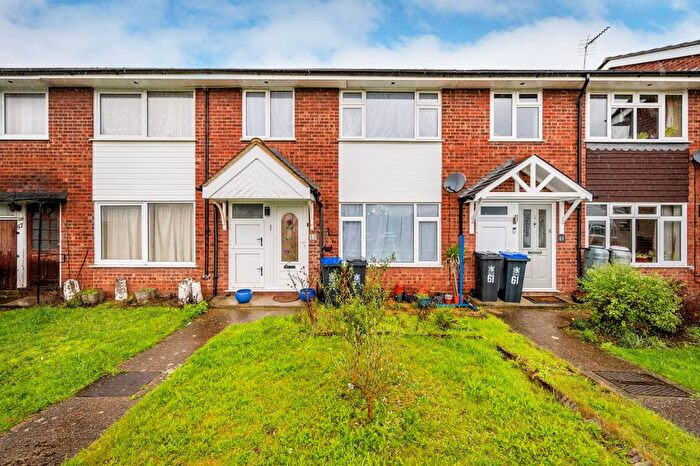
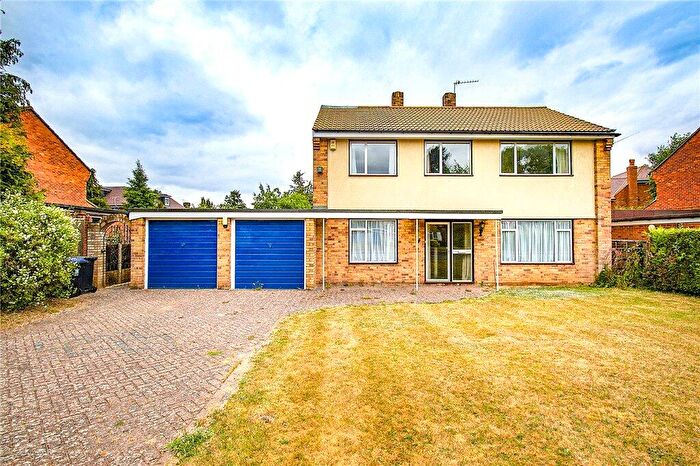
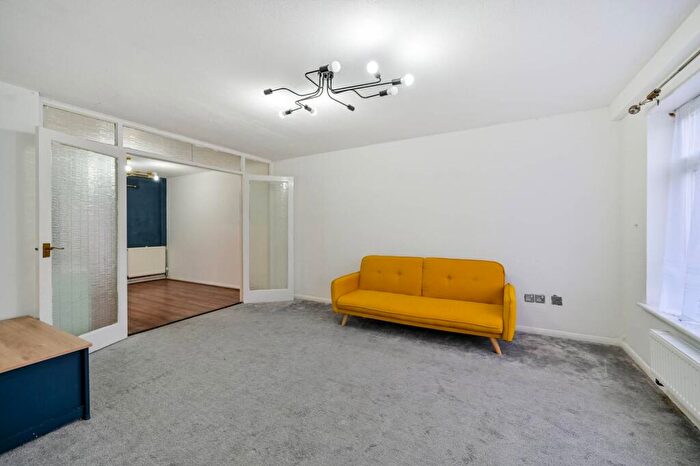
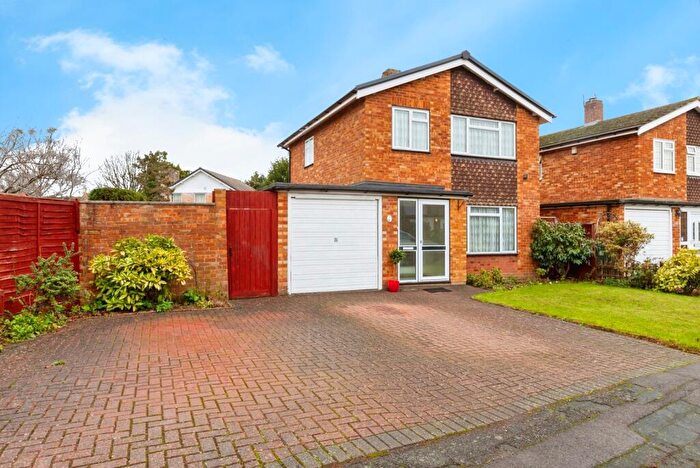
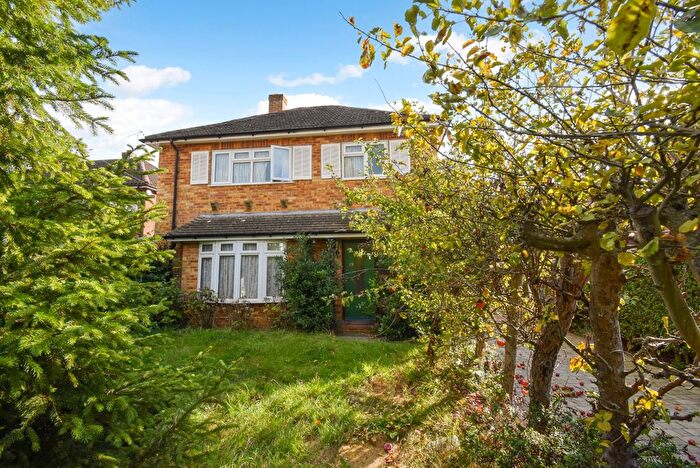
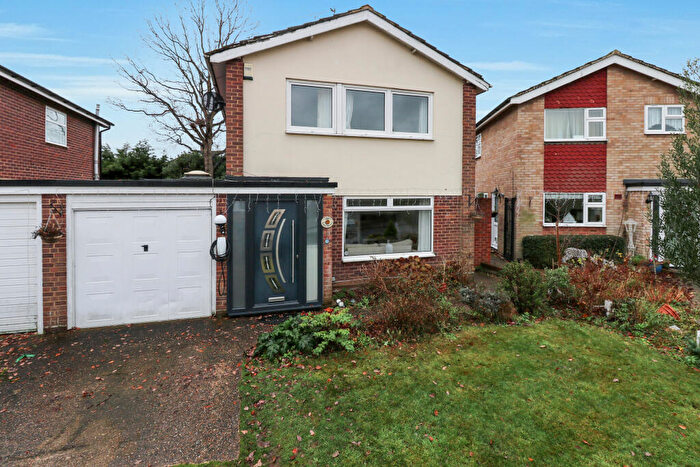
Properties for sale near SL1 8JY, Dropmore View

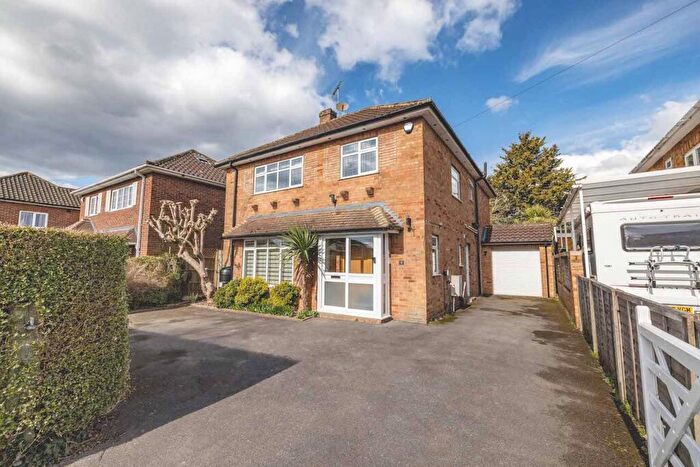
![]()
If you are looking to sell your house, let it out, or receive a property valuation, an expert can help you.
Click the button below to get started.


Price Paid in Dropmore View, SL1 8JY, Burnham Church
DROPMORE VIEW 2 Dropmore View, SL1 8JY, Burnham Church Slough
Property DROPMORE VIEW 2 has been sold 2 times. The last time it was sold was in 25/11/2024 and the sold price was £547,000.00.
This is a Other Property which was sold as a freehold in 25/11/2024
| Date | Price | Property Type | Tenure | Classification |
|---|---|---|---|---|
| 25/11/2024 | £547,000.00 | Other Property | freehold | Established Building |
| 25/11/2024 | £547,000.00 | Other Property | freehold | Established Building |
1 Dropmore View, SL1 8JY, Burnham Church Slough
Property 1 has been sold 3 times. The last time it was sold was in 24/10/2022 and the sold price was £750,000.00.
This semi detached house, sold as a freehold on 24/10/2022, is a 135 sqm semi-detached house with an EPC rating of C.
| Date | Price | Property Type | Tenure | Classification |
|---|---|---|---|---|
| 24/10/2022 | £750,000.00 | Semi Detached House | freehold | Established Building |
| 31/07/2009 | £370,000.00 | Semi Detached House | freehold | Established Building |
| 23/12/1996 | £120,000.00 | Semi Detached House | freehold | Established Building |
2 Dropmore View Poyle Lane Burnham, SL1 8JY, Burnham Church Slough
This is a 99 square meter Semi-detached House with an EPC rating of D. Currently, there is no transaction history available for this property.
Transport near SL1 8JY, Dropmore View


House price paid reports for SL1 8JY, Dropmore View
Click on the buttons below to see price paid reports by year or property price:
- Price Paid By Year
Property Price Paid in SL1 8JY, Dropmore View by Year
The average sold property price by year was:
| Year | Average Sold Price | Price Change |
Sold Properties
|
|---|---|---|---|
| 2022 | £750,000 | 51% |
1 Property |
| 2009 | £370,000 | 68% |
1 Property |
| 1996 | £120,000 | - |
1 Property |