
Houses for sale & to rent in LE4 7QH, Claremont Street, Belgrave, Leicester
House Prices in LE4 7QH, Claremont Street, Belgrave
Properties in LE4 7QH have an average house price of £312,000.00 and had 2 Property Transactions within the last 3 years.¹ LE4 7QH is a postcode in Claremont Street located in Belgrave, an area in Leicester, City of Leicester, with 11 households², where the most expensive property was sold for £312,000.00.
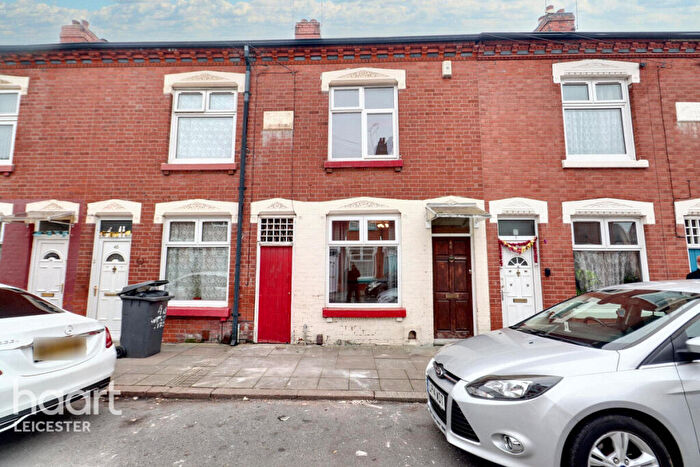
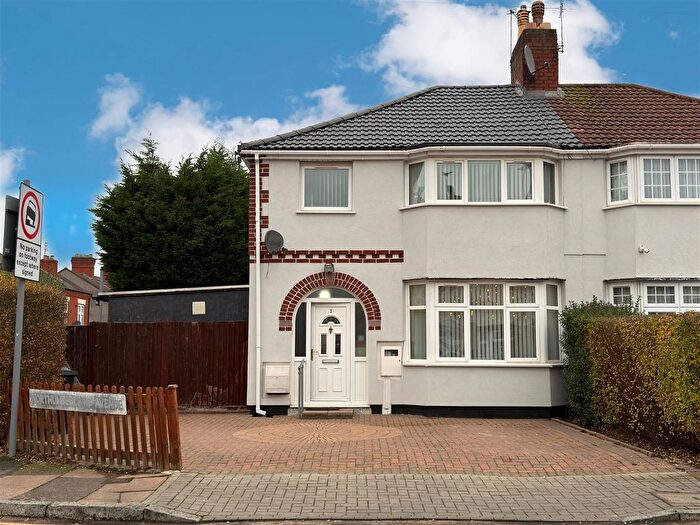
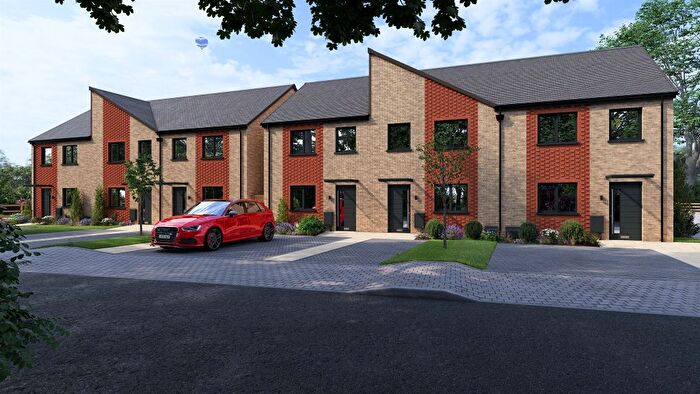
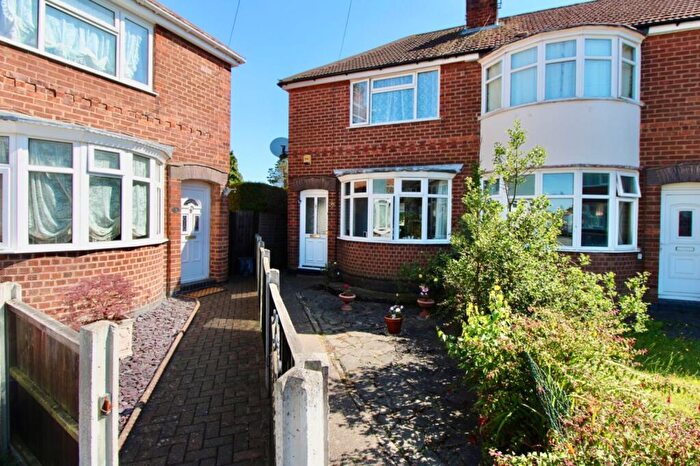
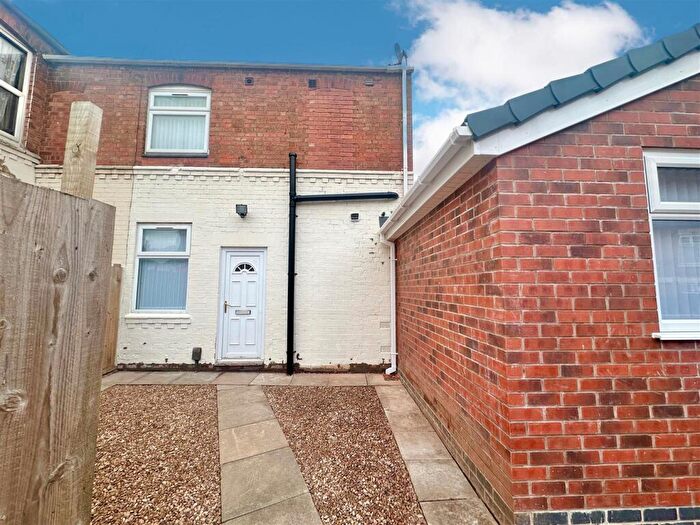
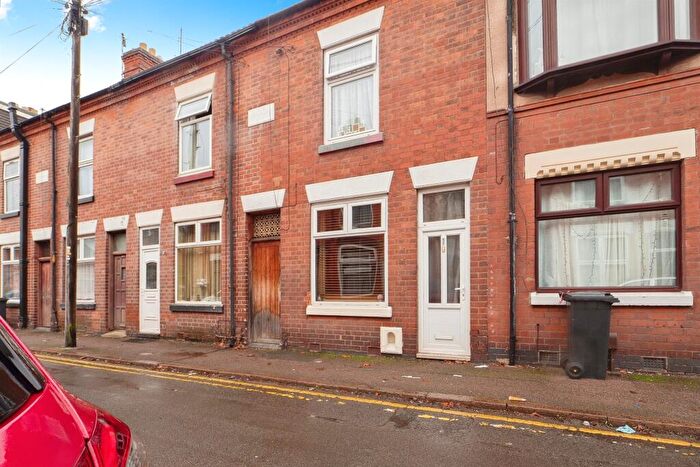
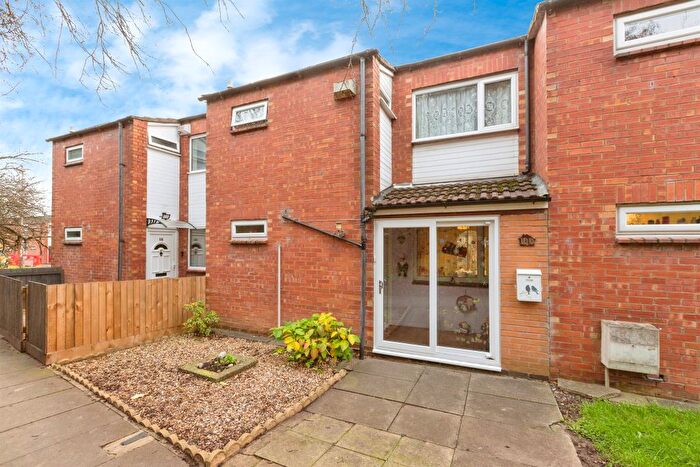
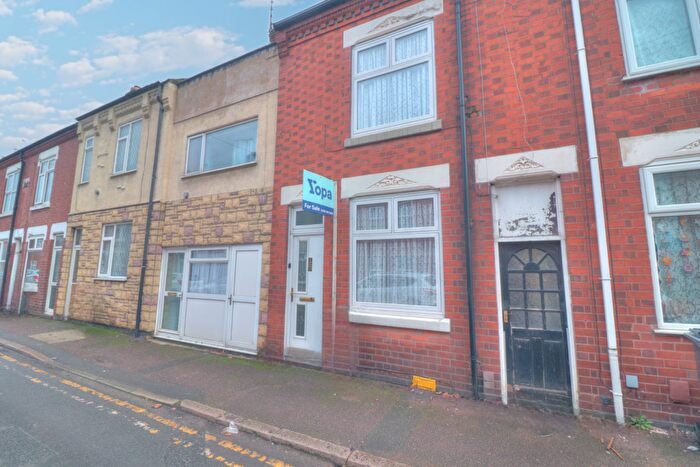
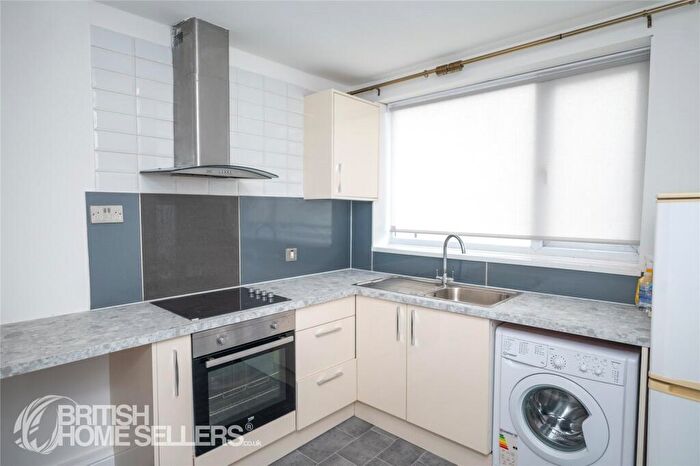
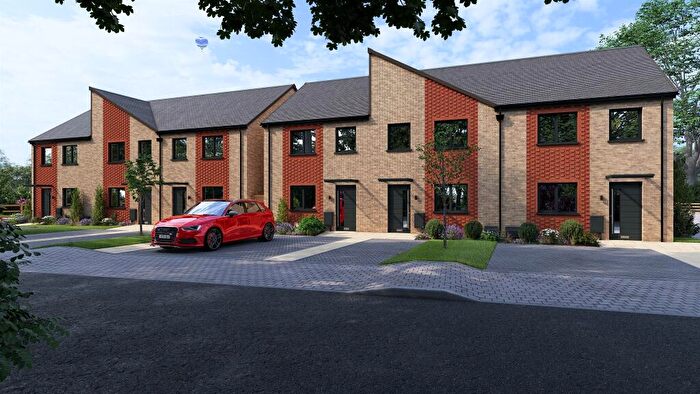
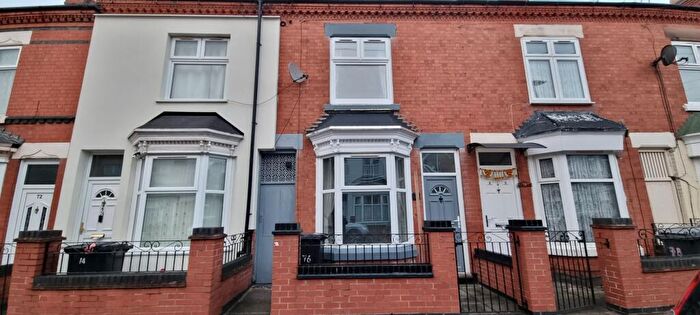
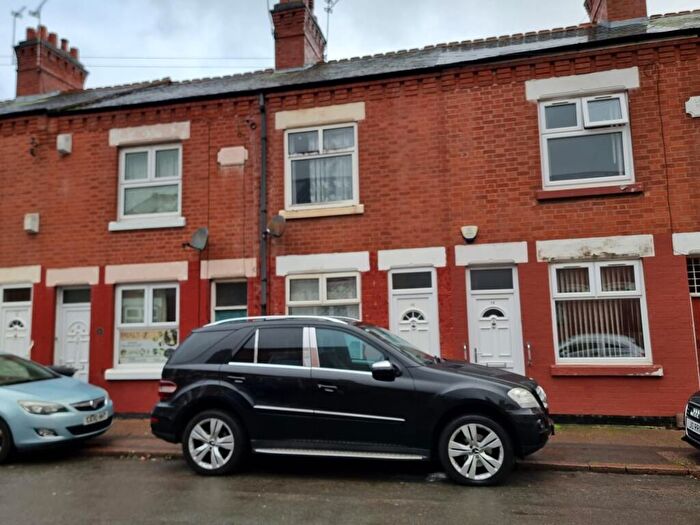
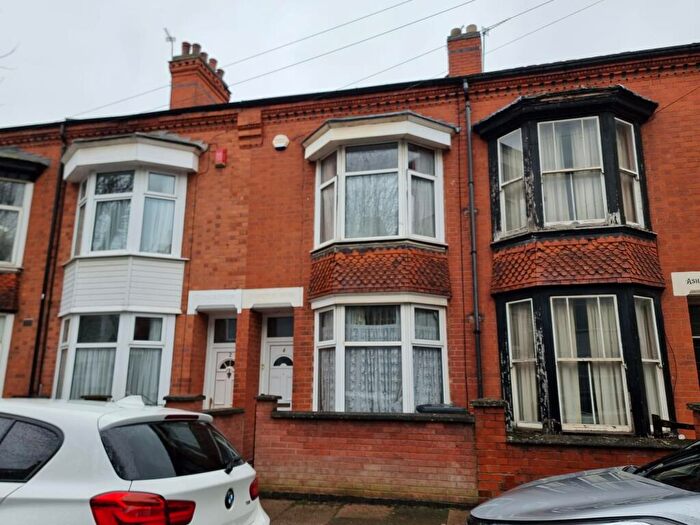
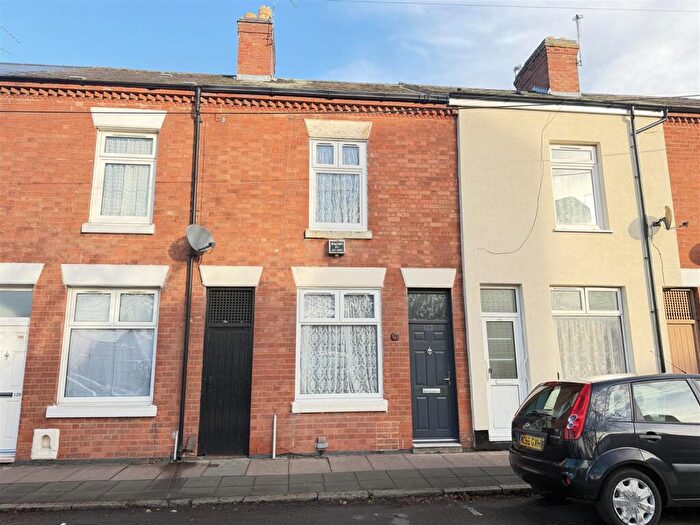
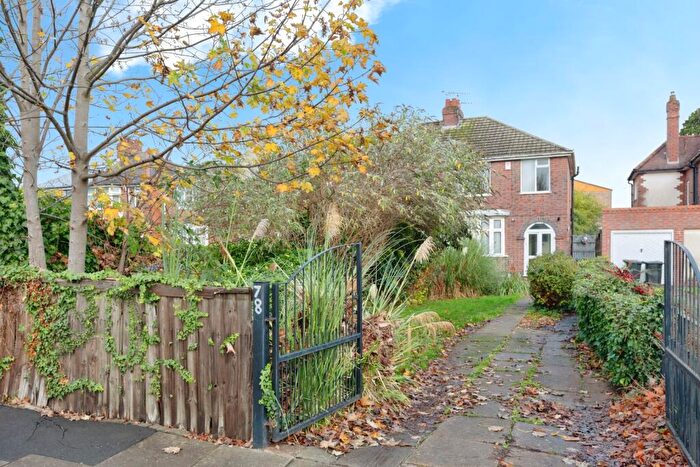
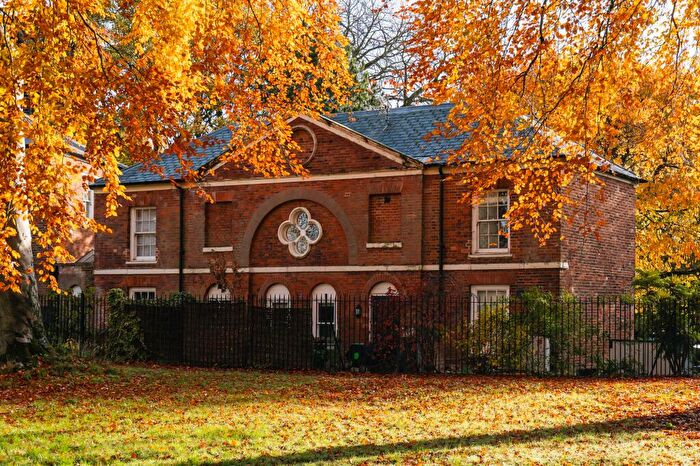
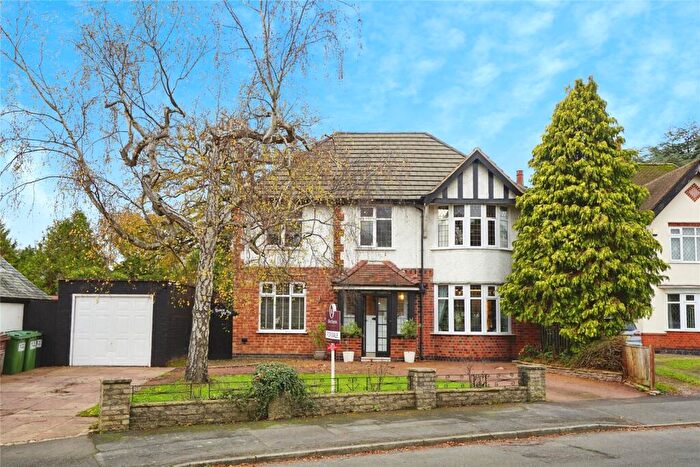
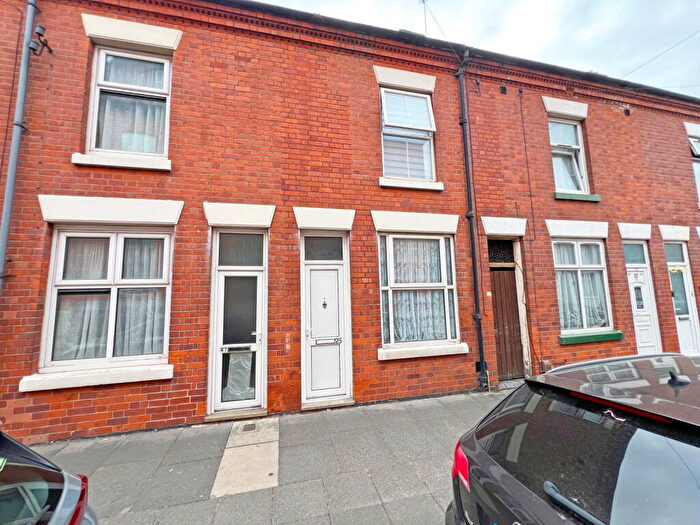
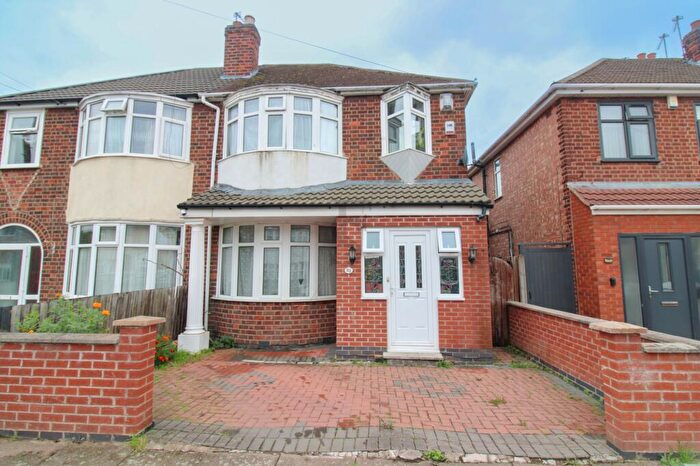
Properties for sale near LE4 7QH, Claremont Street
![]()
If you are looking to sell your house, let it out, or receive a property valuation, an expert can help you.
Click the button below to get started.


Price Paid in Claremont Street, LE4 7QH, Belgrave
57 Claremont Street, LE4 7QH, Belgrave Leicester
Property 57 has been sold 3 times. The last time it was sold was in 09/08/2024 and the sold price was £312,000.00.
This terraced house, sold as a freehold on 09/08/2024, is a 230 sqm detached house with an EPC rating of F.
| Date | Price | Property Type | Tenure | Classification |
|---|---|---|---|---|
| 09/08/2024 | £312,000.00 | Terraced House | freehold | Established Building |
| 09/08/2024 | £312,000.00 | Terraced House | freehold | Established Building |
| 28/01/2011 | £240,000.00 | Terraced House | freehold | Established Building |
17 Claremont Street, LE4 7QH, Belgrave Leicester
Property 17 has been sold 2 times. The last time it was sold was in 06/03/2015 and the sold price was £123,000.00.
This terraced house, sold as a freehold on 06/03/2015, is a 79 sqm end-terrace house with an EPC rating of D.
| Date | Price | Property Type | Tenure | Classification |
|---|---|---|---|---|
| 06/03/2015 | £123,000.00 | Terraced House | freehold | Established Building |
| 27/09/1996 | £34,000.00 | Terraced House | freehold | Established Building |
7 Claremont Street, LE4 7QH, Belgrave Leicester
This is a 47 square meter Top-floor Flat with an EPC rating of C. Currently, there is no transaction history available for this property.
Transport near LE4 7QH, Claremont Street
-
 Leicester Station
 -
Syston Station
-
Sileby Station
-
South Wigston Station
-
Barrow-Upon-Soar Station
-
Narborough Station
-
Loughborough Station
House price paid reports for LE4 7QH, Claremont Street
Click on the buttons below to see price paid reports by year or property price:
- Price Paid By Year
- Property Type Price
Property Price Paid in LE4 7QH, Claremont Street by Year
The average sold property price by year was:
| Year | Average Sold Price | Price Change |
Sold Properties
|
|---|---|---|---|
| 2024 | £312,000 | 61% |
2 Properties |
| 2015 | £123,000 | -95% |
1 Property |
| 2011 | £240,000 | 86% |
1 Property |
| 1996 | £34,000 | - |
1 Property |
Property Price per Property Type in LE4 7QH, Claremont Street
Here you can find historic sold price data in order to help with your property search.
The average Property Paid Price for specific property types in the last three years are:
| Property Type | Average Sold Price | Sold Properties |
|---|---|---|
| Terraced House | £312,000.00 | 2 Terraced Houses |