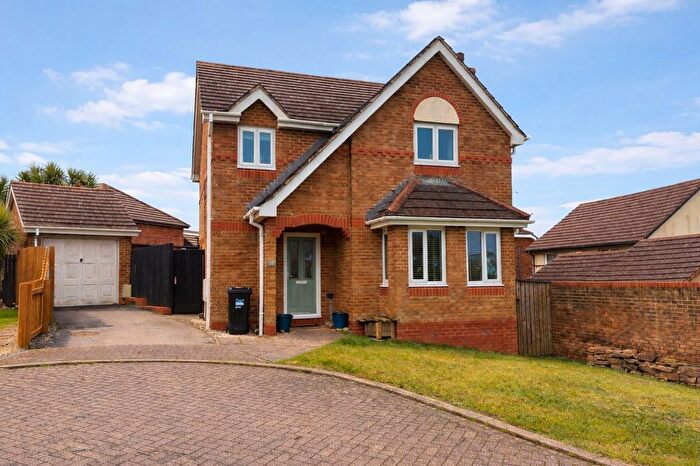
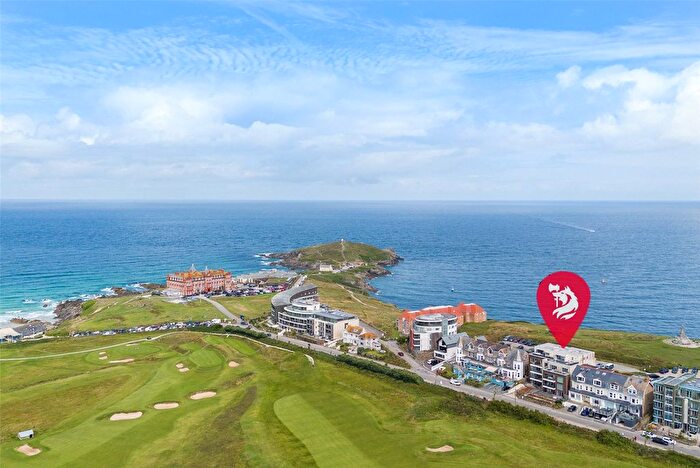
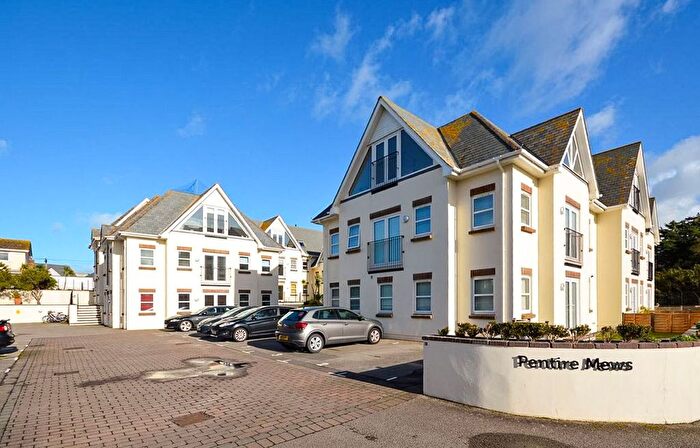
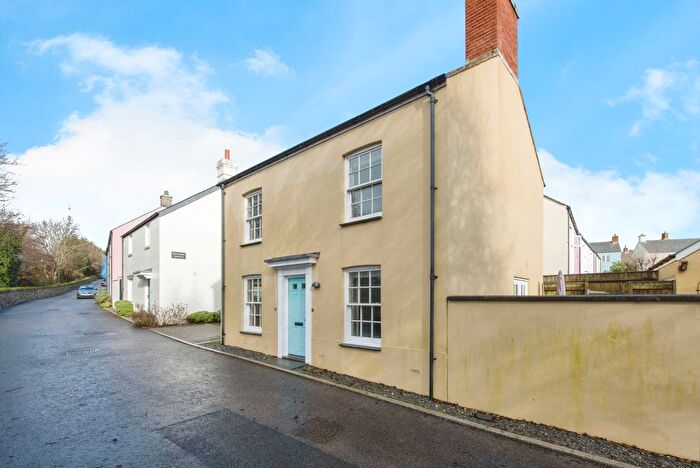
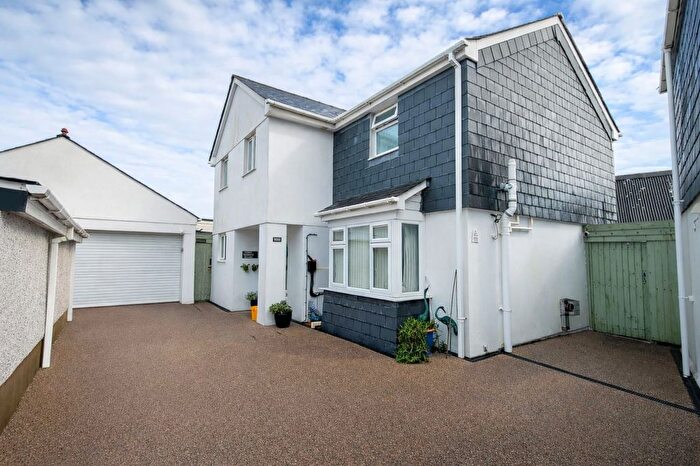
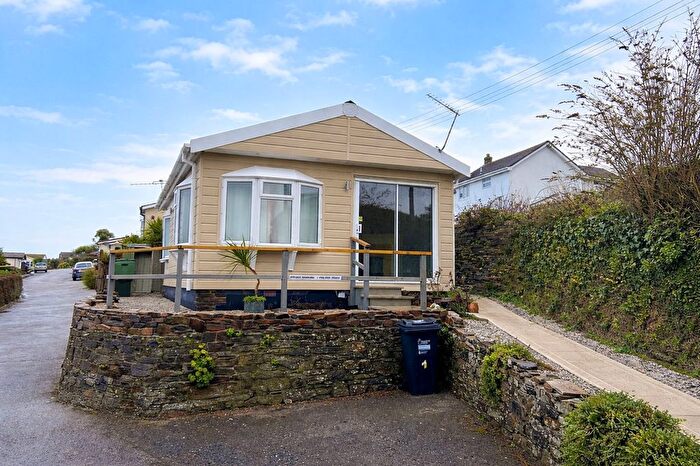
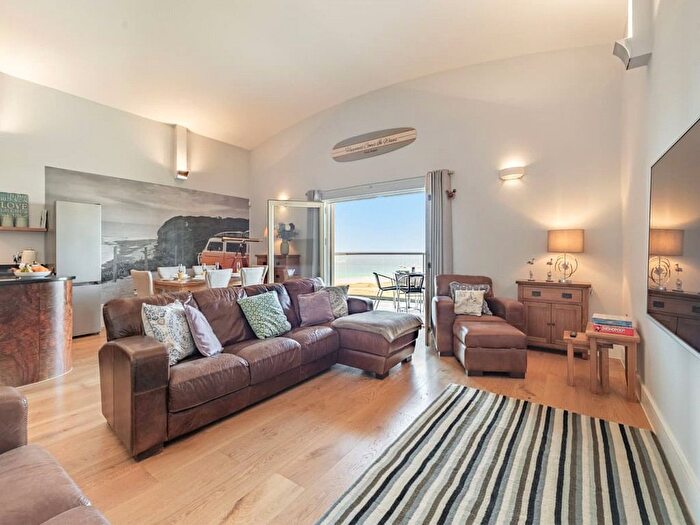
Houses for sale & to rent in Newquay Pentire, Newquay
House Prices in Newquay Pentire
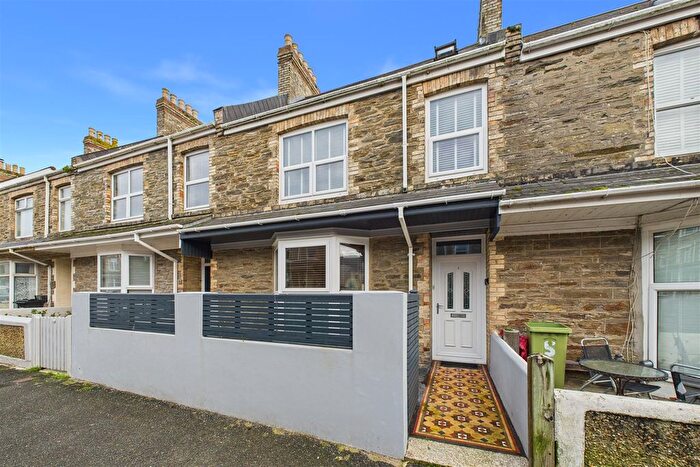
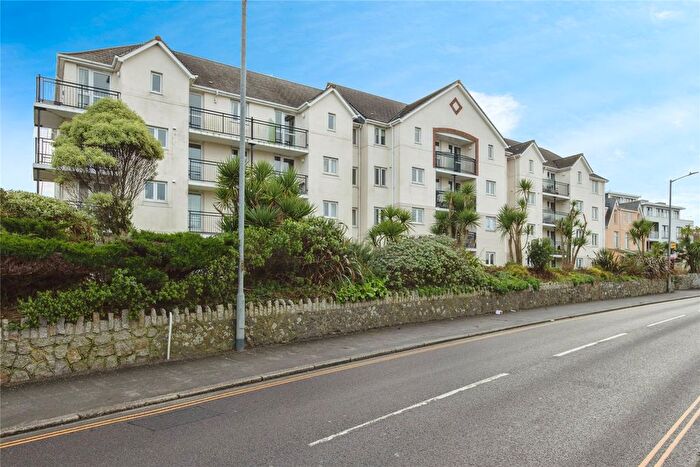
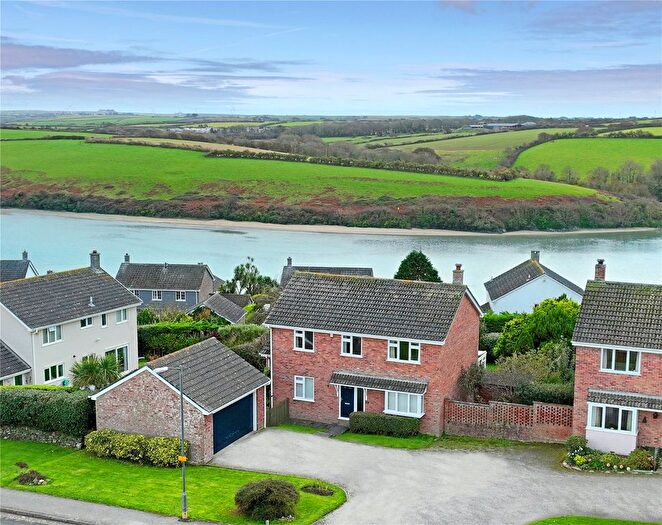
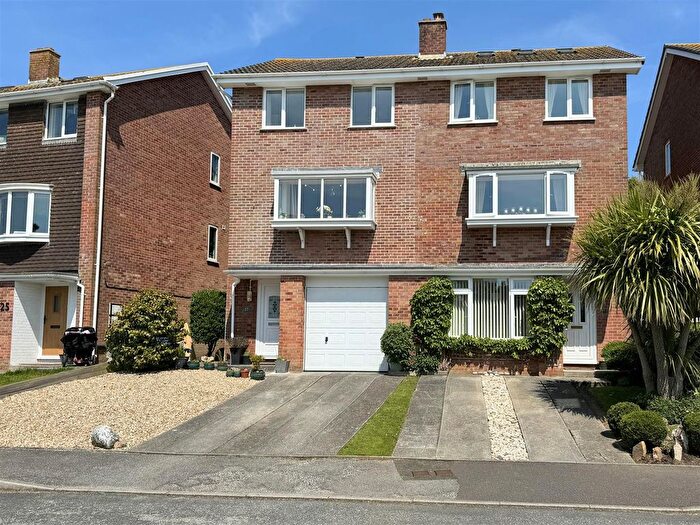
Properties in Newquay Pentire have an average house price of £399,288.00 and had 304 Property Transactions within the last 3 years¹.
Newquay Pentire is an area in Newquay, Cornwall with 1,780 households², where the most expensive property was sold for £4,400,000.00.
Properties for sale in Newquay Pentire
Roads and Postcodes in Newquay Pentire
Navigate through our locations to find the location of your next house in Newquay Pentire, Newquay for sale or to rent.
| Streets | Postcodes |
|---|---|
| Anthony Road | TR7 2AS |
| Atlantic Road | TR7 1QJ |
| Bezant Place | TR7 1SJ |
| Bodvean Court | TR7 1SB |
| Bownder Bors | TR7 1GJ |
| Bownder Corbenic | TR7 1GR |
| Bownder Gareth | TR7 1GL |
| Bownder Marhaus | TR7 1GP |
| Bownder Sarras | TR7 1GQ |
| Bownder Ywain | TR7 1GN |
| Camullas Way | TR7 1PP |
| Chynance Drive | TR7 2AA TR7 2AB |
| Chyverton Close | TR7 2AR |
| Clemens Avenue | TR7 2AW |
| Crantock Street | TR7 1JP TR7 1JR TR7 1JW TR7 1JG |
| Curlew Close | TR7 1SU |
| Esplanade Road | TR7 1FR TR7 1PY TR7 1PZ TR7 1QA TR7 1QB TR7 1QD TR7 1SY TR7 1PS TR7 1PT TR7 1US |
| Estuary View | TR7 1QX |
| Farfield Place | TR7 1NY |
| Fistral Crescent | TR7 1PH TR7 1PQ |
| Frazer Road | TR7 2AH |
| Galleon Court | TR7 2AU |
| Gannel Road | TR7 2AF |
| Hampton Close | TR7 1JZ |
| Hatfield Crescent | TR7 1SL |
| Hawkins Road | TR7 2DZ |
| Higher Tower Road | TR7 1QL |
| Hillside | TR7 2AJ |
| Holt Crescent | TR7 2AX |
| Lawton Close | TR7 1QF TR7 1SR |
| Listry Road | TR7 2DR |
| Marks Way | TR7 2AN |
| Morris Gardens | TR7 2AP |
| Mount Close | TR7 2AQ |
| Mount Wise | TR7 1QN TR7 1QP TR7 1QR TR7 1QW TR7 2BT TR7 1GG |
| Old Barn Court | TR7 1QU |
| Parc Godrevy | TR7 1TY |
| Pengannel Close | TR7 2AT |
| Penmere Drive | TR7 1NG TR7 1NS TR7 1QQ TR7 1RX TR7 1RY |
| Pentire Avenue | TR7 1FB TR7 1FS TR7 1GX TR7 1NZ TR7 1PA TR7 1PB TR7 1PD TR7 1PE TR7 1PF TR7 1TH TR7 1TN TR7 1TQ TR7 1TT TR7 1FJ TR7 1FY TR7 1NU TR7 1UA |
| Pentire Crescent | TR7 1FQ TR7 1GW TR7 1PG TR7 1PU TR7 1PX TR7 1FT |
| Pentire Road | TR7 1NX |
| Playingfield Lane | TR7 2DB |
| Polvella Close | TR7 1QG |
| Reeds Way | TR7 1TS |
| Riverside Avenue | TR7 1PL TR7 1PN TR7 1PW |
| Riverside Crescent | TR7 1PJ |
| Rubble Lane | TR7 1QE |
| St Cuthberts Road | TR7 1JX |
| St Georges Road | TR7 1RD TR7 1RE |
| St Johns Road | TR7 1JT |
| St Marys Court | TR7 1JD |
| St Marys Road | TR7 1JU |
| St Pirans Court | TR7 1HZ |
| St Pirans Road | TR7 1JY |
| Stret Caradoc | TR7 1GE |
| Stret Constantine | TR7 1GH |
| Stret Morgan Le Fay | TR7 1GS |
| Treffry Court | TR7 1LQ |
| Tregunnel Hill | TR7 1QT |
| Trehellan Heights | TR7 1SX |
| Trembath Crescent | TR7 2DX |
| Trenarth Road | TR7 2DU |
| Trethellan Hill | TR7 1QS |
| Trethewey Way | TR7 2AD TR7 2AE |
| Trevanson Mews | TR7 1FW |
| Trevean Way | TR7 1TW |
| Warnes Way | TR7 1QH |
| Windsor Court | TR7 2DD |
| TR7 1GF TR7 1GU TR7 1UX |
Transport near Newquay Pentire
- FAQ
- Price Paid By Year
- Property Type Price
Frequently asked questions about Newquay Pentire
What is the average price for a property for sale in Newquay Pentire?
The average price for a property for sale in Newquay Pentire is £399,288. This amount is 9% higher than the average price in Newquay. There are 834 property listings for sale in Newquay Pentire.
What streets have the most expensive properties for sale in Newquay Pentire?
The streets with the most expensive properties for sale in Newquay Pentire are Riverside Avenue at an average of £1,481,250, Trevean Way at an average of £768,333 and Trethellan Hill at an average of £737,500.
What streets have the most affordable properties for sale in Newquay Pentire?
The streets with the most affordable properties for sale in Newquay Pentire are Windsor Court at an average of £110,450, Bownder Marhaus at an average of £165,150 and Trembath Crescent at an average of £174,000.
Which train stations are available in or near Newquay Pentire?
Some of the train stations available in or near Newquay Pentire are Newquay, Quintrell Downs and St.Columb Road.
Property Price Paid in Newquay Pentire by Year
The average sold property price by year was:
| Year | Average Sold Price | Price Change |
Sold Properties
|
|---|---|---|---|
| 2025 | £414,130 | 6% |
91 Properties |
| 2024 | £390,020 | -2% |
109 Properties |
| 2023 | £396,014 | -16% |
104 Properties |
| 2022 | £460,096 | 19% |
110 Properties |
| 2021 | £371,996 | -5% |
134 Properties |
| 2020 | £389,694 | 24% |
132 Properties |
| 2019 | £295,987 | 3% |
122 Properties |
| 2018 | £286,826 | 2% |
147 Properties |
| 2017 | £282,039 | 6% |
147 Properties |
| 2016 | £264,656 | 3% |
180 Properties |
| 2015 | £257,253 | 10% |
142 Properties |
| 2014 | £230,423 | 10% |
177 Properties |
| 2013 | £207,127 | -4% |
119 Properties |
| 2012 | £215,586 | -8% |
119 Properties |
| 2011 | £232,295 | -19% |
75 Properties |
| 2010 | £275,764 | 15% |
60 Properties |
| 2009 | £233,980 | -8% |
56 Properties |
| 2008 | £253,355 | -11% |
70 Properties |
| 2007 | £282,348 | 27% |
135 Properties |
| 2006 | £207,396 | -10% |
160 Properties |
| 2005 | £229,170 | 12% |
117 Properties |
| 2004 | £202,658 | 17% |
148 Properties |
| 2003 | £169,146 | 10% |
150 Properties |
| 2002 | £151,986 | 28% |
172 Properties |
| 2001 | £109,395 | 17% |
150 Properties |
| 2000 | £90,859 | 5% |
136 Properties |
| 1999 | £86,198 | 7% |
144 Properties |
| 1998 | £80,349 | 19% |
108 Properties |
| 1997 | £65,271 | -1% |
101 Properties |
| 1996 | £66,213 | 12% |
81 Properties |
| 1995 | £58,326 | - |
74 Properties |
Property Price per Property Type in Newquay Pentire
Here you can find historic sold price data in order to help with your property search.
The average Property Paid Price for specific property types in the last three years are:
| Property Type | Average Sold Price | Sold Properties |
|---|---|---|
| Semi Detached House | £389,140.00 | 40 Semi Detached Houses |
| Detached House | £682,735.00 | 67 Detached Houses |
| Terraced House | £358,838.00 | 48 Terraced Houses |
| Flat | £287,587.00 | 149 Flats |

