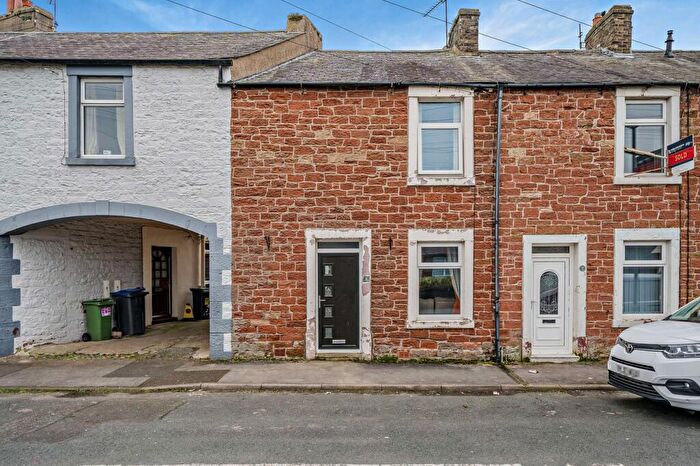
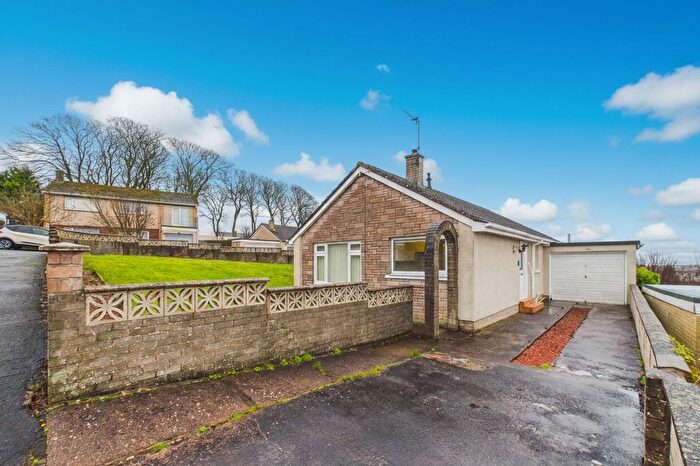
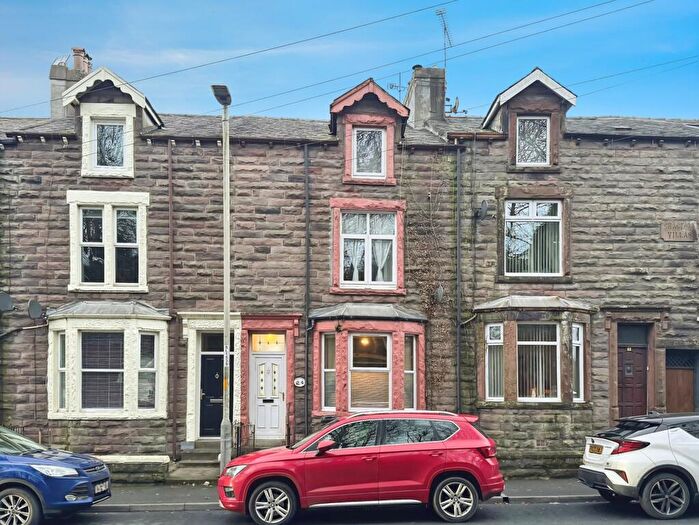
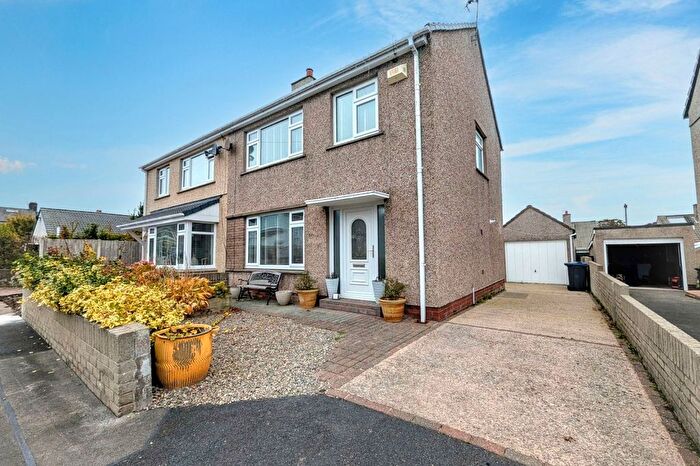
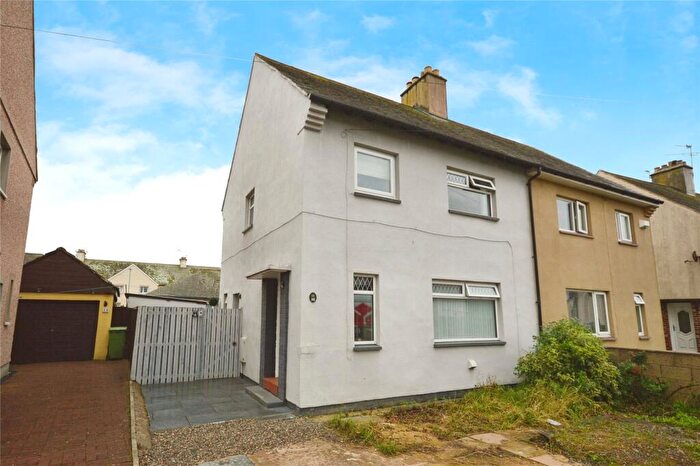
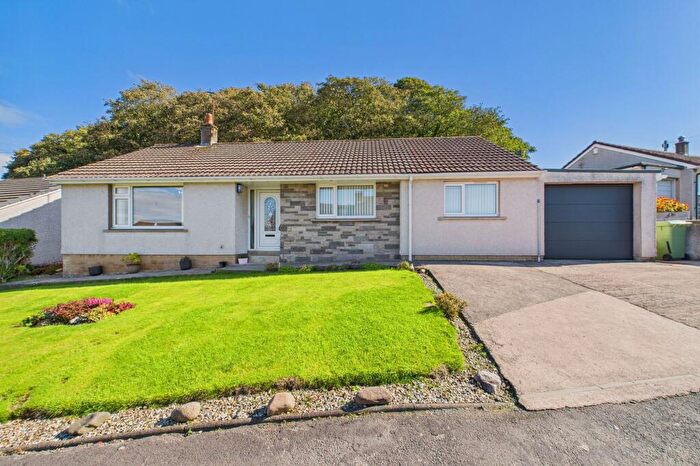
Houses for sale & to rent in Ellenborough, Maryport
House Prices in Ellenborough
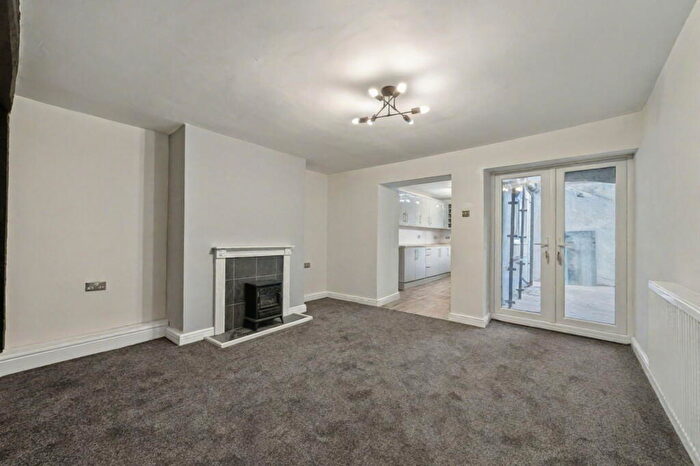
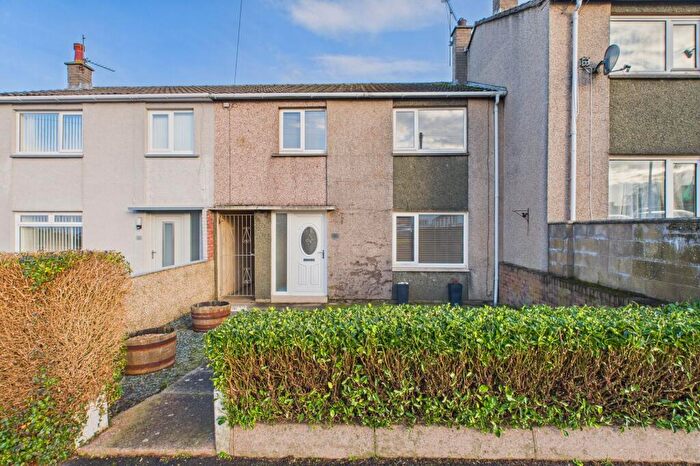
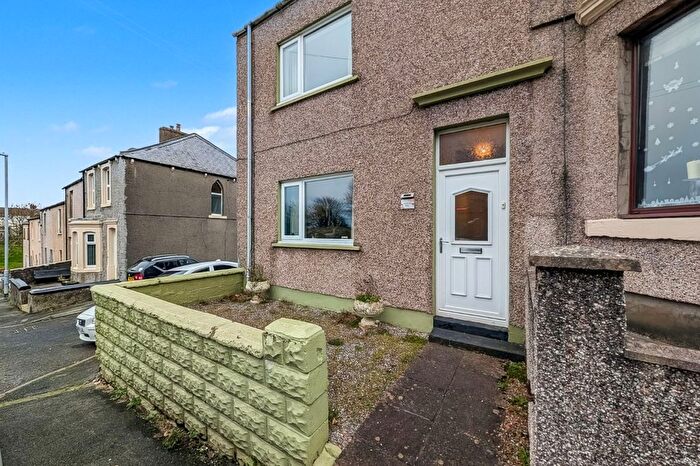
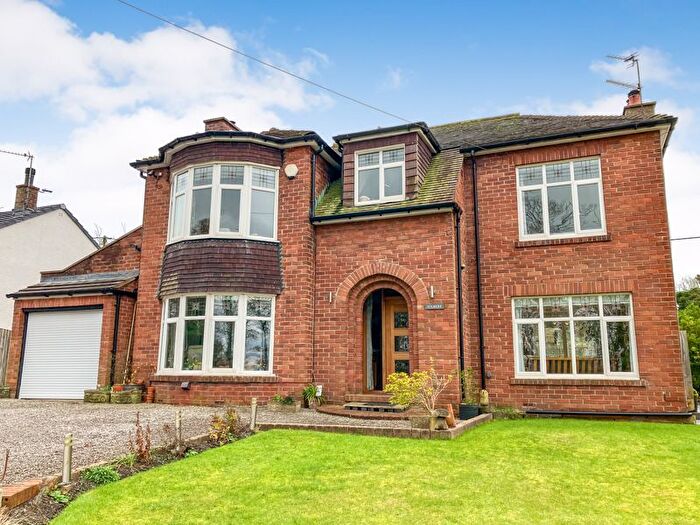
Properties in Ellenborough have an average house price of £144,546.00 and had 128 Property Transactions within the last 3 years¹.
Ellenborough is an area in Maryport, Cumbria with 1,451 households², where the most expensive property was sold for £314,000.00.
Properties for sale in Ellenborough
Previously listed properties in Ellenborough
Roads and Postcodes in Ellenborough
Navigate through our locations to find the location of your next house in Ellenborough, Maryport for sale or to rent.
| Streets | Postcodes |
|---|---|
| Abbotsford Place | CA15 7PD |
| Ada Street | CA15 7PQ |
| Albert Terrace | CA15 7NT |
| Alder Avenue | CA15 7AL |
| Ash Close | CA15 7DP |
| Ashby Street | CA15 7NL |
| Beechwood Close | CA15 7BZ |
| Borriskill | CA15 7RF |
| Boyd Street | CA15 7NN |
| Bradbury Avenue | CA15 7LY CA15 7NQ |
| Brook Side | CA15 7AF |
| Brooklands Avenue | CA15 7PY CA15 7PZ CA15 7QA CA15 7QB |
| Buchanan Terrace | CA15 7DS |
| Cedar Crescent | CA15 7BT CA15 7BX CA15 7DE CA15 7DG CA15 7DW |
| Chagford Villas | CA15 7BH |
| Chapel Gardens | CA15 7LX |
| Cherrytree Drive | CA15 7DH |
| Church Terrace | CA15 7PS |
| Crerar Close | CA15 7QY |
| Derwent Avenue | CA15 7LZ CA15 7NG |
| Edith Terrace | CA15 7NR |
| Elbra Farm Close | CA15 7RG |
| Elizabeth Street | CA15 7NZ CA15 7PA |
| Elizabeth Terrace | CA15 7BB |
| Ellen Villa | CA15 7BJ |
| Ellenborough Old Road | CA15 7PG |
| Ewanrigg Brow | CA15 7QU |
| Florence Terrace | CA15 7NX |
| George Terrace | CA15 7NP |
| Ghyll Mount | CA15 7BN |
| Gillbeck Park | CA15 7BF |
| Grasmere Terrace | CA15 7QD |
| Greenwood Terrace | CA15 7QH |
| Hawthorn Avenue | CA15 7AB |
| Hillside Close | CA15 7DZ |
| James Street | CA15 7NU |
| Jane Street | CA15 7NW |
| Laburnum Grove | CA15 7AP |
| Lancaster Terrace | CA15 7LP |
| Lime Grove | CA15 7DQ |
| Lowfield Bungalows | CA15 7BG |
| Lyalls Place | CA15 7PF |
| Main Street | CA15 7DN CA15 7DX |
| Mandle Terrace | CA15 7BA |
| Maple Close | CA15 7DF |
| Marsh Terrace | CA15 7DJ |
| Mccarron Close | CA15 7QX |
| Meadow Close | CA15 7AS |
| Meadow Way | CA15 7AZ |
| Moorside Drive | CA15 7DR |
| Mulgrew Close | CA15 7DD |
| Nether View | CA15 7AR |
| Oakland Avenue | CA15 7BU |
| Pecklewell Terrace | CA15 7QJ |
| Pinewood Drive | CA15 7BY |
| Railway Terrace | CA15 7LN |
| Ramsay Terrace | CA15 7NY |
| Robinsons Terrace | CA15 7BS |
| Rydal Avenue | CA15 7LU |
| Sandy Lonning | CA15 7LL CA15 7LW |
| Scotts Brow | CA15 7DA |
| Selina Terrace | CA15 7BL |
| Shaw Street | CA15 7PH |
| Short Acres | CA15 7LG |
| Spring Field Road | CA15 7AY |
| Sycamore Road | CA15 7AE CA15 7AG |
| The Beeches | CA15 7AH CA15 7AW |
| The Ghyll | CA15 7BQ |
| The Green | CA15 7LJ |
| Victoria Terrace | CA15 7AA |
| Victory Crescent | CA15 7LF |
| Ward Street | CA15 7PE |
| Woodlands Drive | CA15 7AD CA15 7AX |
| CA15 7BP CA15 7BW CA15 7DL CA15 7DT CA15 7RB CA15 7RD CA15 7RE |
Transport near Ellenborough
- FAQ
- Price Paid By Year
- Property Type Price
Frequently asked questions about Ellenborough
What is the average price for a property for sale in Ellenborough?
The average price for a property for sale in Ellenborough is £144,546. This amount is 7% lower than the average price in Maryport. There are 318 property listings for sale in Ellenborough.
What streets have the most expensive properties for sale in Ellenborough?
The streets with the most expensive properties for sale in Ellenborough are Sandy Lonning at an average of £285,000, Nether View at an average of £265,000 and Meadow Way at an average of £250,500.
What streets have the most affordable properties for sale in Ellenborough?
The streets with the most affordable properties for sale in Ellenborough are Ellenborough Old Road at an average of £54,333, James Street at an average of £55,625 and Ward Street at an average of £57,250.
Which train stations are available in or near Ellenborough?
Some of the train stations available in or near Ellenborough are Maryport, Flimby and Workington.
Property Price Paid in Ellenborough by Year
The average sold property price by year was:
| Year | Average Sold Price | Price Change |
Sold Properties
|
|---|---|---|---|
| 2025 | £143,831 | 0,4% |
32 Properties |
| 2024 | £143,283 | -2% |
49 Properties |
| 2023 | £146,348 | -9% |
47 Properties |
| 2022 | £159,387 | 27% |
36 Properties |
| 2021 | £117,028 | -14% |
51 Properties |
| 2020 | £133,807 | 12% |
41 Properties |
| 2019 | £118,157 | 7% |
38 Properties |
| 2018 | £110,184 | -10% |
50 Properties |
| 2017 | £121,748 | 11% |
40 Properties |
| 2016 | £108,068 | 8% |
51 Properties |
| 2015 | £99,516 | -10% |
40 Properties |
| 2014 | £109,227 | -2% |
46 Properties |
| 2013 | £111,200 | 1% |
52 Properties |
| 2012 | £110,300 | 4% |
35 Properties |
| 2011 | £105,382 | -19% |
26 Properties |
| 2010 | £125,525 | 9% |
35 Properties |
| 2009 | £113,856 | 3% |
33 Properties |
| 2008 | £110,641 | -6% |
35 Properties |
| 2007 | £116,995 | 6% |
71 Properties |
| 2006 | £109,642 | 12% |
76 Properties |
| 2005 | £95,939 | 17% |
74 Properties |
| 2004 | £79,397 | 3% |
66 Properties |
| 2003 | £77,236 | 27% |
124 Properties |
| 2002 | £56,154 | 3% |
96 Properties |
| 2001 | £54,239 | 23% |
90 Properties |
| 2000 | £41,606 | -0,2% |
64 Properties |
| 1999 | £41,688 | -5% |
62 Properties |
| 1998 | £43,585 | -4% |
60 Properties |
| 1997 | £45,256 | 5% |
63 Properties |
| 1996 | £42,848 | 4% |
61 Properties |
| 1995 | £41,045 | - |
43 Properties |
Property Price per Property Type in Ellenborough
Here you can find historic sold price data in order to help with your property search.
The average Property Paid Price for specific property types in the last three years are:
| Property Type | Average Sold Price | Sold Properties |
|---|---|---|
| Semi Detached House | £156,644.00 | 27 Semi Detached Houses |
| Detached House | £229,055.00 | 36 Detached Houses |
| Terraced House | £92,715.00 | 65 Terraced Houses |

