
Houses for sale & to rent in Park West, Darlington
House Prices in Park West
Properties in Park West have an average house price of £319k and had 174 Property Transactions within the last 3 years¹.
Park West is an area in Darlington, Darlington with 1,613 households², where the most expensive property was sold for £1.1M.
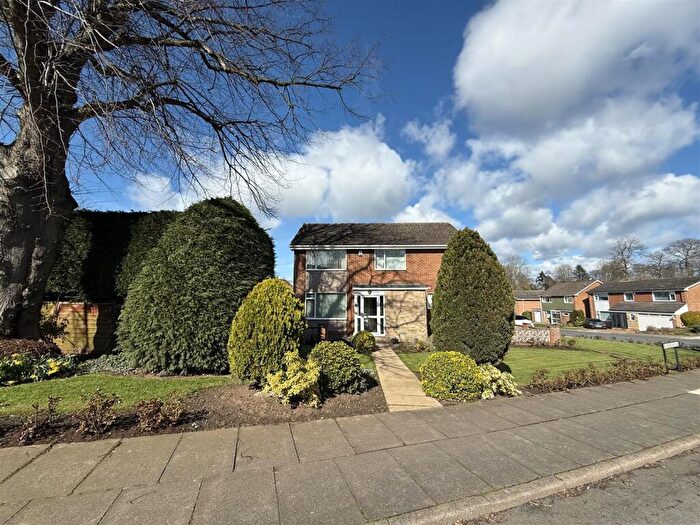
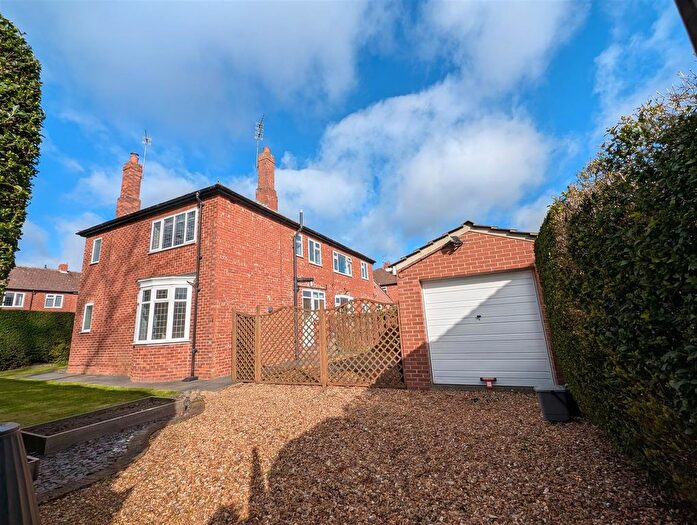
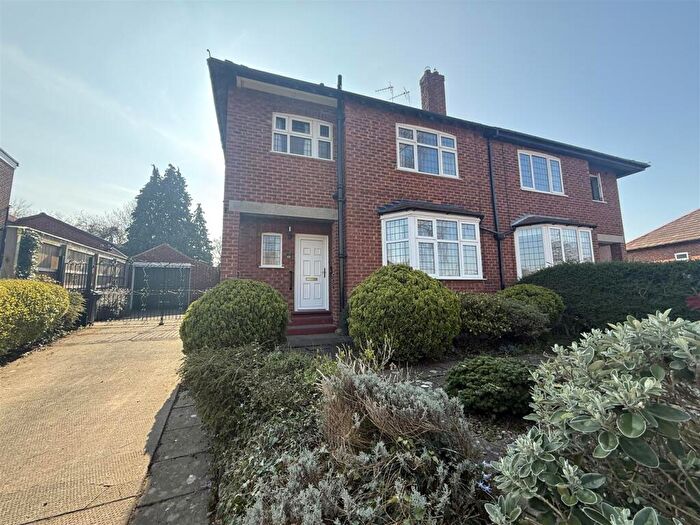
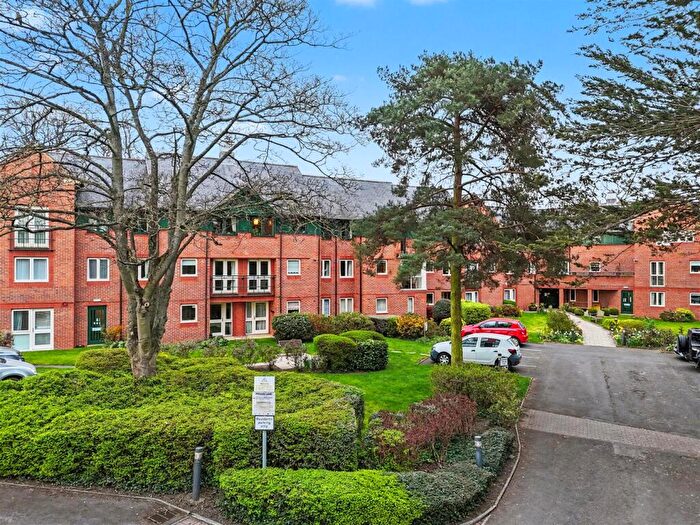
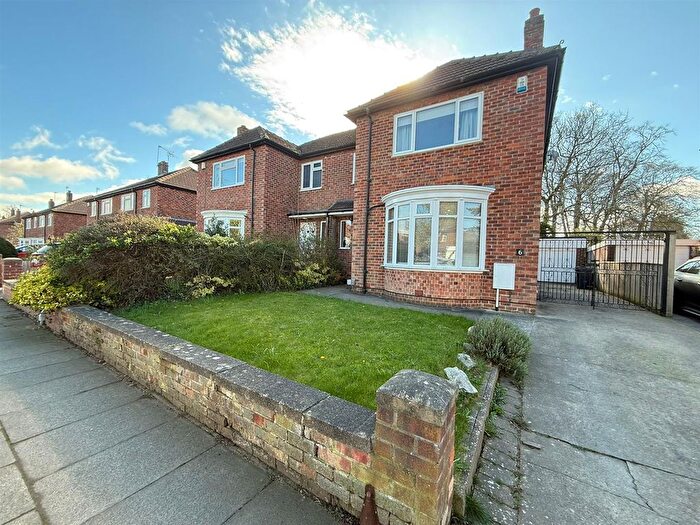
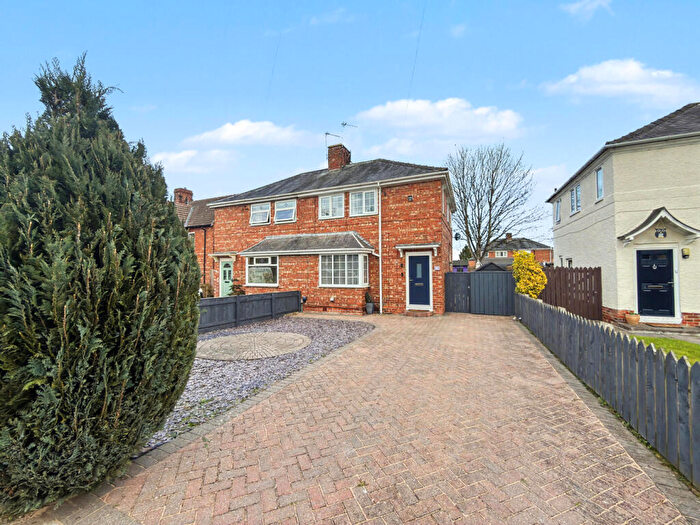
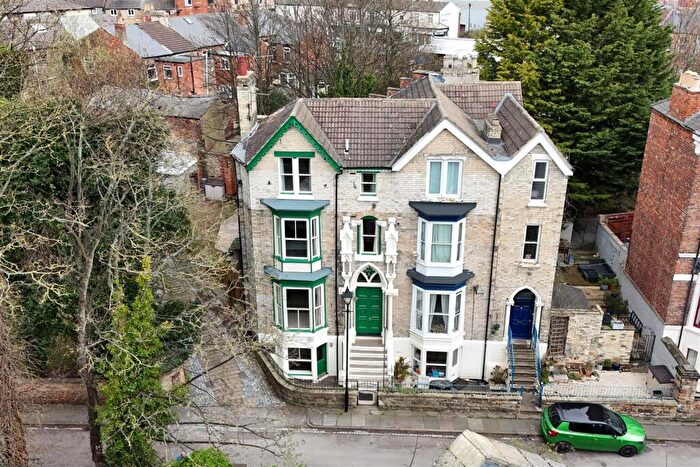
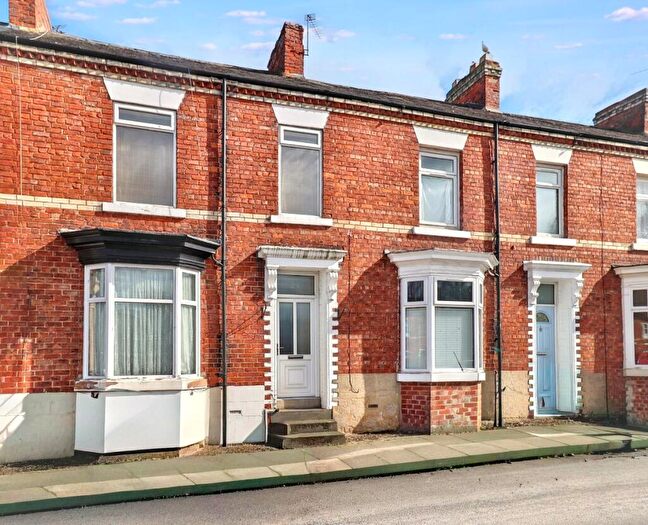
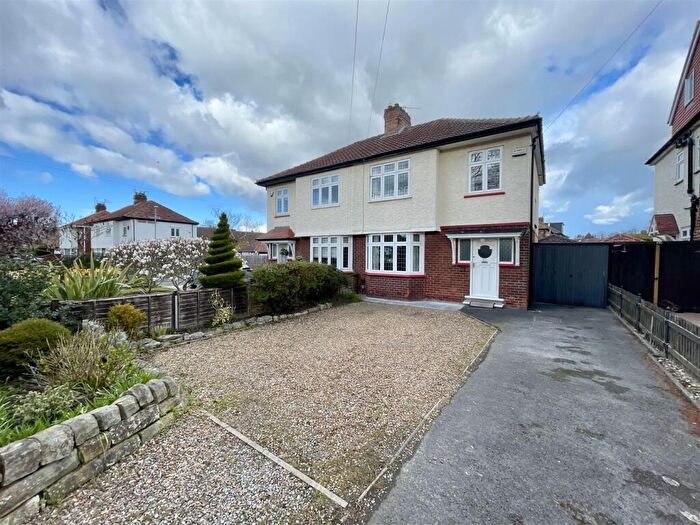
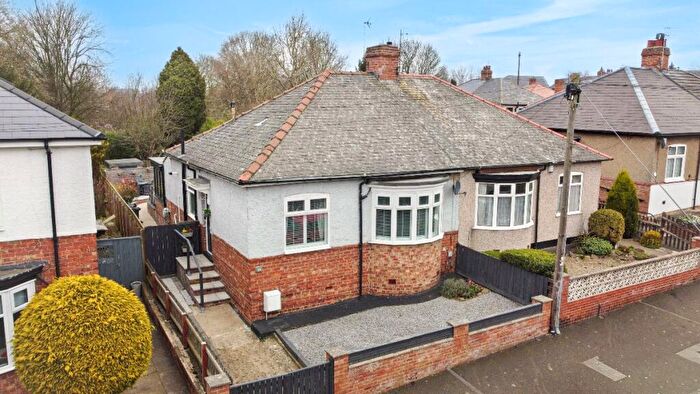
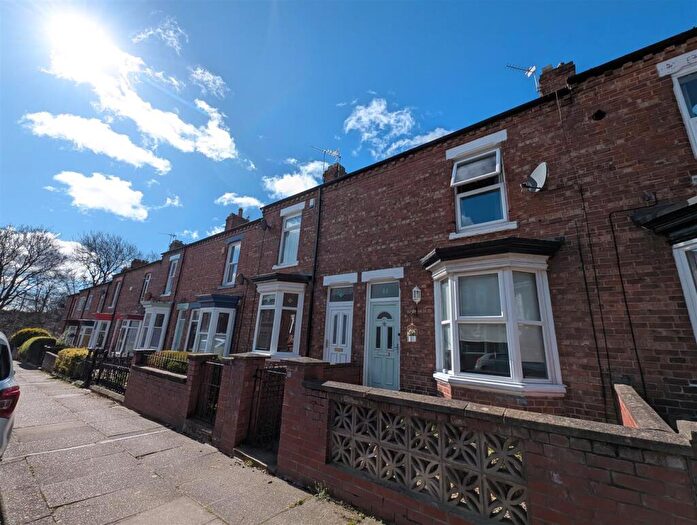
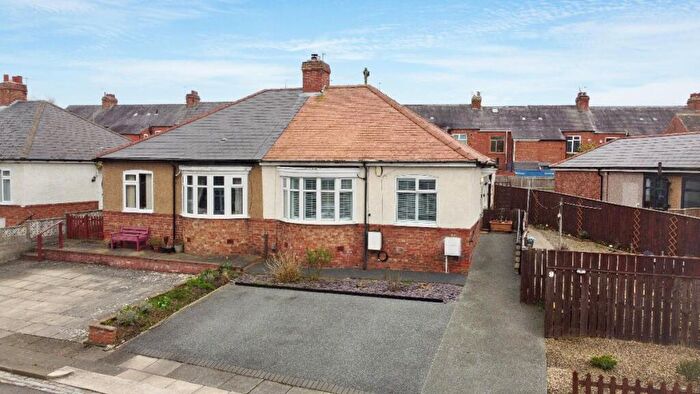
Properties for sale in Park West
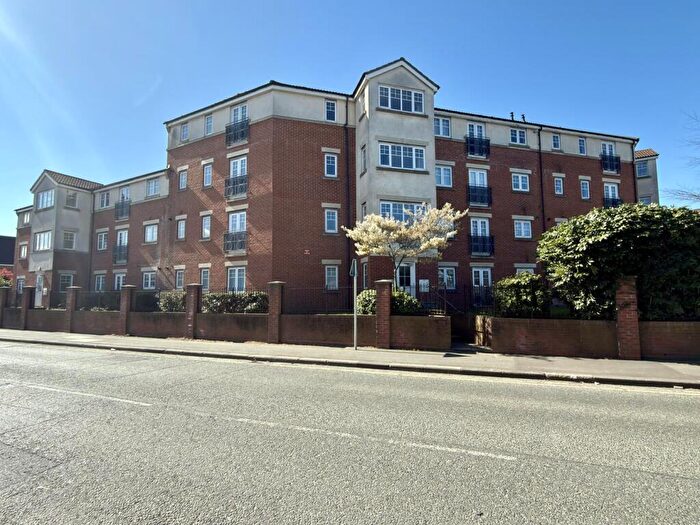

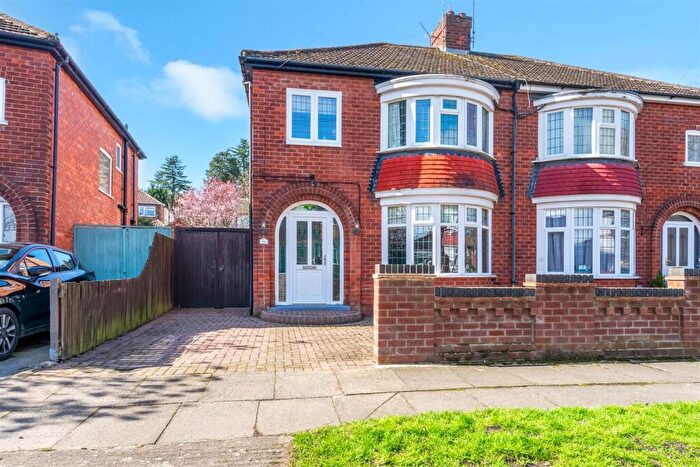
![]()
If you are looking to sell your house, let it out, or receive a property valuation, an expert can help you.
Click the button below to get started.
Roads and Postcodes in Park West
Navigate through our locations to find the location of your next house in Park West, Darlington for sale or to rent.
| Streets | Postcodes |
|---|---|
| Ashcroft Road | DL3 8PD |
| Ayton Drive | DL3 8DN |
| Blackwell | DL3 8QT DL3 8QW DL3 8QY |
| Blackwell Close | DL3 8QP |
| Blackwell Grove | DL3 8QS |
| Blackwell Lane | DL3 8QD DL3 8QF DL3 8QG DL3 8QQ DL3 8QH |
| Blackwell Scar | DL3 8DL |
| Briar Close | DL3 8QX |
| Briar Walk | DL3 8QU |
| Bridge Road | DL3 8TN DL3 8TW |
| Carmel Gardens | DL3 8JD |
| Carmel Grove | DL3 8EQ |
| Carmel Road North | DL3 8JE |
| Carmel Road South | DL3 8DJ DL3 8DQ DL3 8DR DL3 8DS DL3 8DW DL3 8QN |
| Cleveland Avenue | DL3 7HE |
| Cleveland Terrace | DL3 7HD DL3 8HN DL3 8HX DL3 8JA |
| Coniscliffe Road | DL3 7ET DL3 7RW DL3 8AA DL3 8AG DL3 8AH DL3 8AJ DL3 8AL DL3 8AQ DL3 8DE DL3 8EU DL3 8EX DL3 8PA DL3 8PG DL3 8PL DL3 8PU DL3 8TE DL3 8TG DL3 7RT DL3 8DG DL3 8DF |
| Croft Villas | DL3 8EW |
| Cypress Close | DL3 8QR |
| Draycote Crescent | DL3 8DX |
| Elton Parade | DL3 8PJ DL3 8PQ |
| Farr Holme | DL3 8QZ |
| Flora Avenue | DL3 8PE DL3 8PF |
| Glendale Drive | DL3 8DY |
| Glenfield Road | DL3 8DZ |
| Grange Road | DL1 5NP DL1 5NG DL1 5NH DL1 5NQ DL1 5NR DL1 5PA DL1 5PE DL1 5YL |
| Grangeside | DL3 8QJ |
| Greencroft Close | DL3 8HW DL3 8JG DL3 8JQ DL3 8BF |
| Greener Drive | DL1 5JP |
| Greenmount Road | DL3 8EP |
| Hadrian Court | DL3 8RE |
| Harewood Grove | DL3 7HU |
| Harewood Hill | DL3 7HY |
| Harewood Terrace | DL3 7HX |
| Hartford Road | DL3 8EY DL3 8HE DL3 8HF |
| Hillside Road | DL3 8HB |
| Kendal Close | DL1 5NS |
| Knoll Avenue | DL3 8PT |
| Linden Avenue | DL3 8PN DL3 8PP DL3 8PS |
| Linden Drive | DL3 8PW |
| Linwood Grove | DL3 8DP |
| Manor Road | DL3 8ER DL3 8ET |
| Marlborough Drive | DL1 5YF |
| Northumberland Street | DL3 7HJ |
| Peverell Walk | DL1 5LY |
| Pine Grove | DL3 8JF |
| Ravensdale Road | DL3 8DT DL3 8DU DL3 8EA DL3 8EB |
| Ravensdale Walk | DL3 8ED |
| Rustland Drive | DL3 8EG |
| South Terrace | DL1 5JD DL1 5JE |
| Southend Avenue | DL3 7HT DL3 7HZ |
| Sylvan Grove | DL3 8PR |
| The Rise | DL3 8HD |
| The Spinney | DL3 8QL |
| Upsall Drive | DL3 8RB |
| Woodburn Drive | DL3 8AB |
| Woodcrest Road | DL3 8EE DL3 8EF |
| Woodside Drive | DL3 8ES |
| Woodvale Road | DL3 8EZ DL3 8HA |
| DL3 8EJ |
Transport near Park West

- FAQ
- Price Paid By Year
- Property Type Price
Frequently asked questions about Park West
What is the average price for a property for sale in Park West?
The average price for a property for sale in Park West is £319,450. This amount is 95% higher than the average price in Darlington. There are 2,361 property listings for sale in Park West.
What streets have the most expensive properties for sale in Park West?
The streets with the most expensive properties for sale in Park West are Ashcroft Road at an average of £550,000, Grangeside at an average of £519,166 and Elton Parade at an average of £505,000.
What streets have the most affordable properties for sale in Park West?
The streets with the most affordable properties for sale in Park West are Knoll Avenue at an average of £111,800, Greener Drive at an average of £140,750 and South Terrace at an average of £180,000.
Which train stations are available in or near Park West?
Some of the train stations available in or near Park West are Darlington, North Road and Dinsdale.
Property Price Paid in Park West by Year
The average sold property price by year was:
| Year | Average Sold Price | Price Change |
Sold Properties
|
|---|---|---|---|
| 2026 | £91,500 | -248% |
1 Property |
| 2025 | £318,824 | 11% |
53 Properties |
| 2024 | £284,747 | -24% |
56 Properties |
| 2023 | £353,897 | -6% |
64 Properties |
| 2022 | £376,765 | 7% |
79 Properties |
| 2021 | £349,713 | 12% |
108 Properties |
| 2020 | £307,110 | 4% |
79 Properties |
| 2019 | £294,804 | 11% |
72 Properties |
| 2018 | £262,114 | -4% |
97 Properties |
| 2017 | £273,039 | 10% |
88 Properties |
| 2016 | £244,420 | -5% |
101 Properties |
| 2015 | £256,501 | -1% |
97 Properties |
| 2014 | £260,286 | 10% |
51 Properties |
| 2013 | £234,579 | -0,1% |
61 Properties |
| 2012 | £234,904 | -0,2% |
49 Properties |
| 2011 | £235,430 | -12% |
43 Properties |
| 2010 | £264,526 | 12% |
44 Properties |
| 2009 | £233,993 | -7% |
45 Properties |
| 2008 | £250,686 | -1% |
48 Properties |
| 2007 | £252,701 | 2% |
91 Properties |
| 2006 | £246,861 | -1% |
105 Properties |
| 2005 | £248,917 | -0,2% |
52 Properties |
| 2004 | £249,406 | 29% |
57 Properties |
| 2003 | £177,611 | 6% |
76 Properties |
| 2002 | £167,309 | 13% |
76 Properties |
| 2001 | £146,001 | 21% |
94 Properties |
| 2000 | £114,860 | 6% |
82 Properties |
| 1999 | £107,958 | 5% |
76 Properties |
| 1998 | £102,694 | 8% |
72 Properties |
| 1997 | £94,491 | 15% |
81 Properties |
| 1996 | £79,871 | -18% |
71 Properties |
| 1995 | £94,616 | - |
57 Properties |
Property Price per Property Type in Park West
Here you can find historic sold price data in order to help with your property search.
The average Property Paid Price for specific property types in the last three years are:
| Property Type | Average Sold Price | Sold Properties |
|---|---|---|
| Semi Detached House | £300,245.00 | 90 Semi Detached Houses |
| Detached House | £458,426.00 | 42 Detached Houses |
| Terraced House | £297,980.00 | 25 Terraced Houses |
| Flat | £109,347.00 | 17 Flats |