
Houses for sale in EX39 1TH, Conybeare Drive, Northam, Bideford
House Prices in EX39 1TH, Conybeare Drive, Northam
Properties in EX39 1TH have no sales history available within the last 3 years. EX39 1TH is a postcode in Conybeare Drive located in Northam, an area in Bideford, Devon, with 5 households².
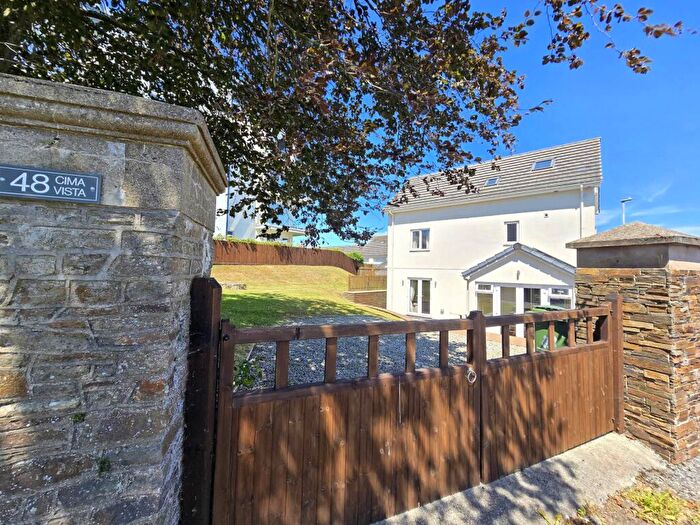
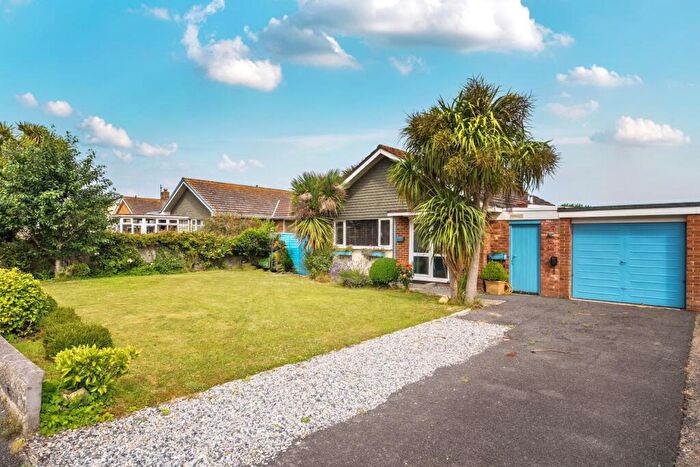
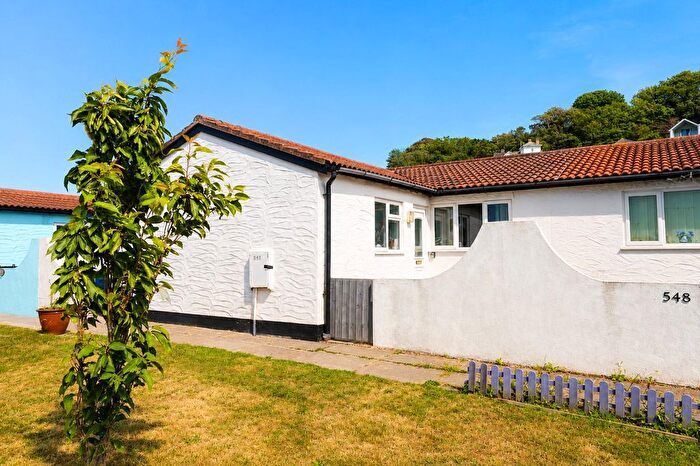
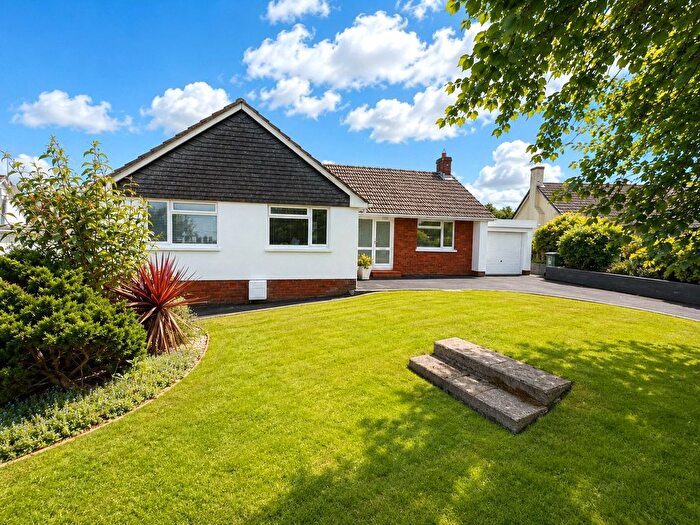
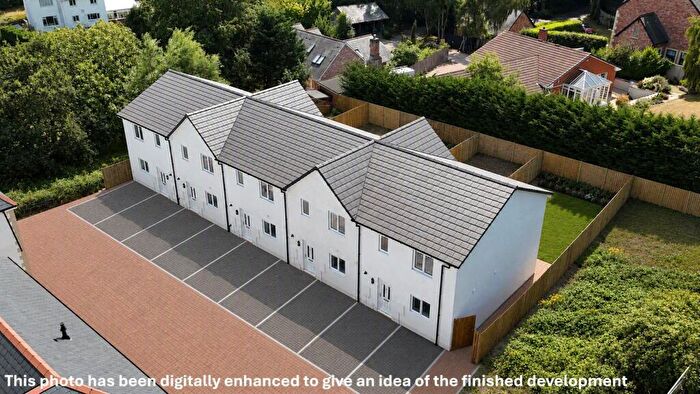
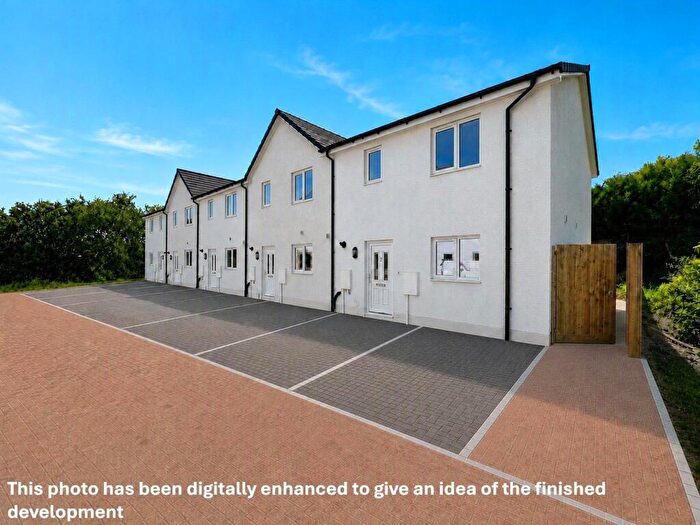
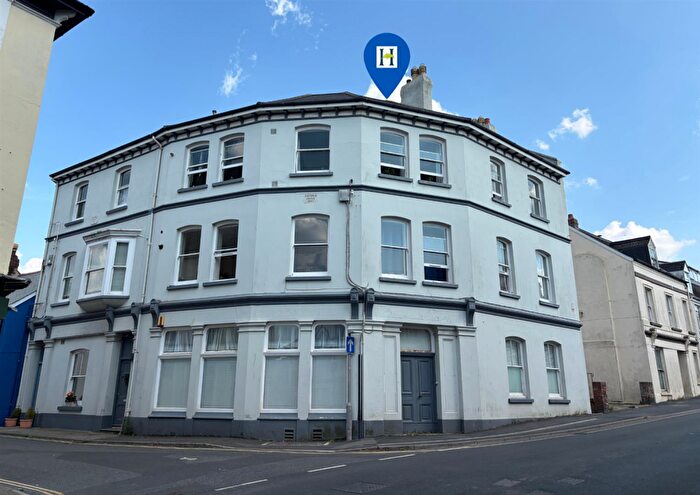
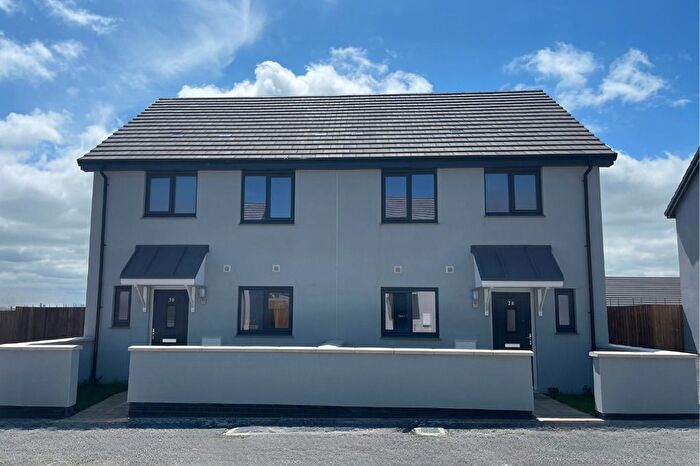
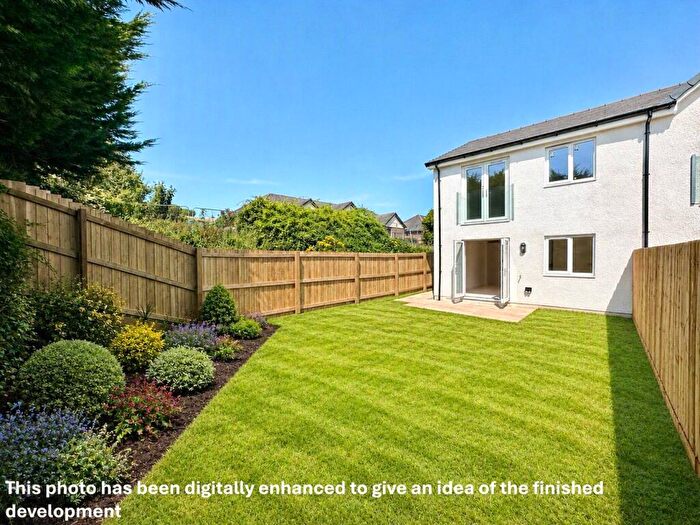
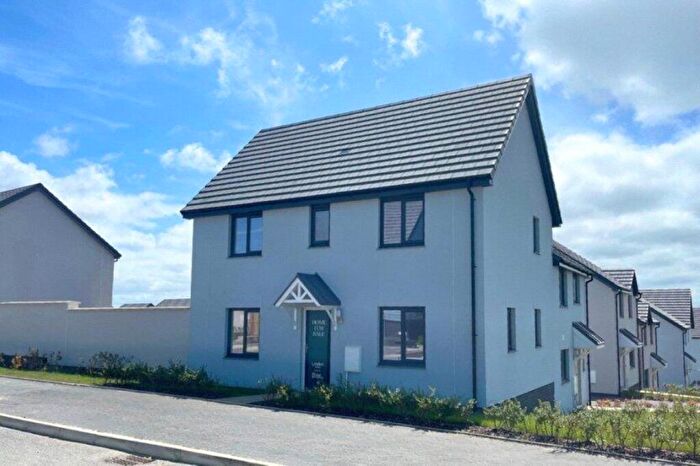
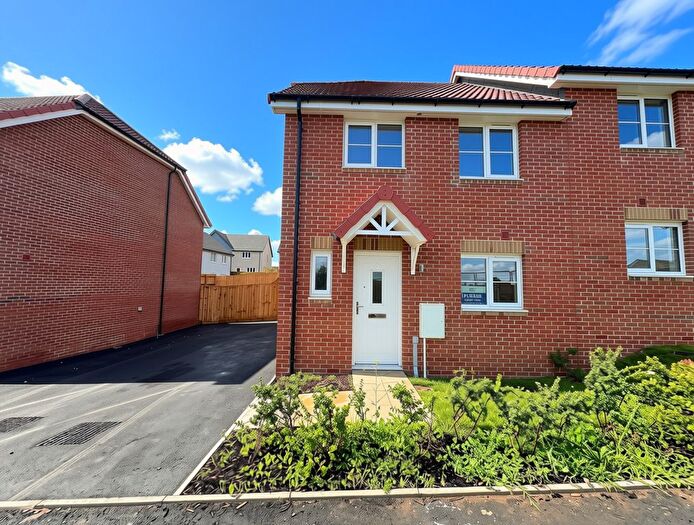
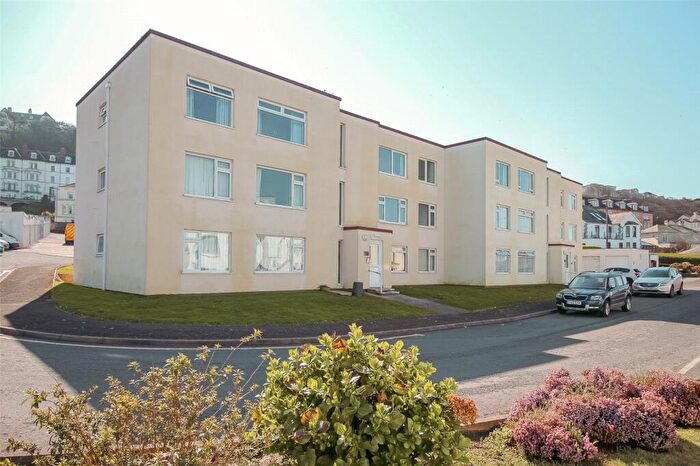
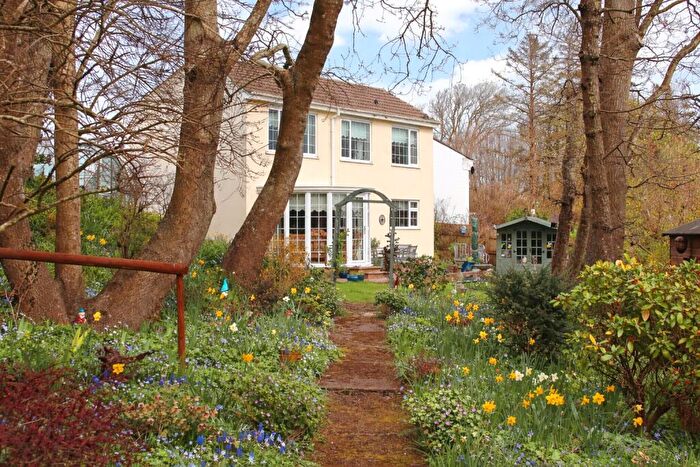
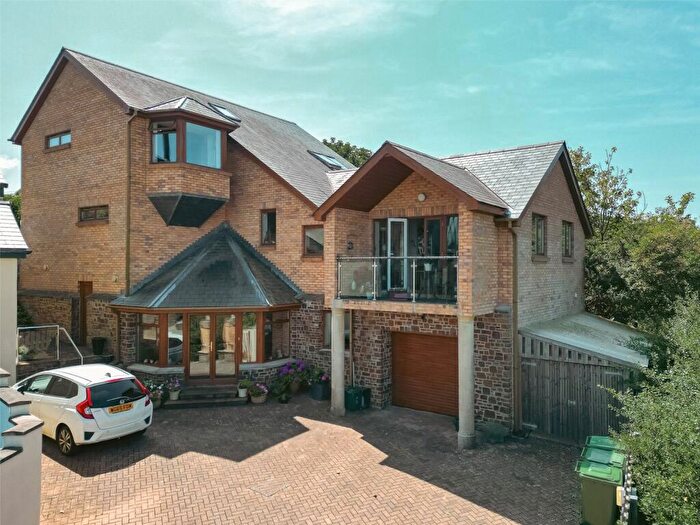
Properties for sale near EX39 1TH, Conybeare Drive
![]()
If you are looking to sell your house, let it out, or receive a property valuation, an expert can help you.
Click the button below to get started.

Price Paid in Conybeare Drive, EX39 1TH, Northam
COACH HOUSE Conybeare Drive, EX39 1TH, Northam Bideford
Property COACH HOUSE has been sold 3 times. The last time it was sold was in 17/10/2022 and the sold price was £315,000.00.
This detached house, sold as a freehold on 17/10/2022, is a 73 sqm semi-detached house with an EPC rating of E.
| Date | Price | Property Type | Tenure | Classification |
|---|---|---|---|---|
| 17/10/2022 | £315,000.00 | Detached House | freehold | Established Building |
| 12/11/2020 | £265,000.00 | Detached House | freehold | Established Building |
| 04/01/2007 | £181,000.00 | Detached House | freehold | Established Building |
SUNNYACRE Conybeare Drive, EX39 1TH, Northam Bideford
Property SUNNYACRE has been sold 2 times. The last time it was sold was in 19/11/2020 and the sold price was £685,000.00.
This detached house, sold as a freehold on 19/11/2020, is a 152 sqm detached bungalow with an EPC rating of D.
| Date | Price | Property Type | Tenure | Classification |
|---|---|---|---|---|
| 19/11/2020 | £685,000.00 | Detached House | freehold | Established Building |
| 06/04/2000 | £160,000.00 | Detached House | freehold | Established Building |
BRAMBLE COTTAGE Conybeare Drive, EX39 1TH, Northam Bideford
Property BRAMBLE COTTAGE has been sold 4 times. The last time it was sold was in 26/02/2018 and the sold price was £195,000.00.
This detached house, sold as a freehold on 26/02/2018, is a 67 sqm detached house with an EPC rating of C.
| Date | Price | Property Type | Tenure | Classification |
|---|---|---|---|---|
| 26/02/2018 | £195,000.00 | Detached House | freehold | Established Building |
| 19/06/2014 | £180,000.00 | Detached House | freehold | Established Building |
| 03/09/2009 | £150,000.00 | Terraced House | freehold | Established Building |
| 07/07/2006 | £157,000.00 | Terraced House | freehold | Established Building |
SOUTH CONYBEARE Conybeare Drive, EX39 1TH, Northam Bideford
Property SOUTH CONYBEARE has been sold 3 times. The last time it was sold was in 17/02/2017 and the sold price was £715,000.00.
This detached house, sold as a freehold on 17/02/2017, is a 362 sqm detached house with an EPC rating of D.
| Date | Price | Property Type | Tenure | Classification |
|---|---|---|---|---|
| 17/02/2017 | £715,000.00 | Detached House | freehold | Established Building |
| 29/11/2013 | £610,000.00 | Detached House | freehold | Established Building |
| 31/01/2003 | £370,000.00 | Detached House | freehold | Established Building |
DOVE COTTAGE Conybeare Drive, EX39 1TH, Northam Bideford
Property DOVE COTTAGE has been sold 2 times. The last time it was sold was in 27/01/2014 and the sold price was £367,500.00.
This detached house, sold as a freehold on 27/01/2014, is a 173 sqm detached house with an EPC rating of C.
| Date | Price | Property Type | Tenure | Classification |
|---|---|---|---|---|
| 27/01/2014 | £367,500.00 | Detached House | freehold | Established Building |
| 10/12/2012 | £375,000.00 | Detached House | freehold | Established Building |
PINE COTTAGE Conybeare Drive, EX39 1TH, Northam Bideford
Property PINE COTTAGE has been sold 1 time. The last time it was sold was in 22/04/2009 and the sold price was £239,000.00.
This is a Detached House which was sold as a freehold in 22/04/2009
| Date | Price | Property Type | Tenure | Classification |
|---|---|---|---|---|
| 22/04/2009 | £239,000.00 | Detached House | freehold | Established Building |
Property price trends in EX39 1TH, Conybeare Drive
According to the latest Land Registry data, the average home in EX39 1TH, Conybeare Drive sold for £315,000 in 2022. That figure comes from 15 sales logged over the past 22 years.
Prices have continued to climb over the last three years. Compared with 2018, when the typical sale came in around £195,000, that's a rise of roughly 61.5%.
Looking back five years, average prices are down about 55.9% since 2017, a drop of around £400,000 in cash terms.
Zoom out to the past decade for the fuller picture. Back in 2012, homes here averaged £375,000, so the typical sold price has fallen about 16% since then, around 1.7% a year lower. Stretch the view to fifteen years and that annual pace edges up closer to 3.8%.
Property Price Paid in EX39 1TH, Conybeare Drive by Year
The average sold property price by year was:
| Year | Average Sold Price | Price Change |
Sold Properties
|
|---|---|---|---|
| 2022 | £315,000 | -51% |
1 Property |
| 2020 | £475,000 | 59% |
2 Properties |
| 2018 | £195,000 | -267% |
1 Property |
| 2017 | £715,000 | 62% |
1 Property |
| 2014 | £273,750 | -123% |
2 Properties |
| 2013 | £610,000 | 39% |
1 Property |
| 2012 | £375,000 | 48% |
1 Property |
| 2009 | £194,500 | 7% |
2 Properties |
| 2007 | £181,000 | 13% |
1 Property |
| 2006 | £157,000 | -136% |
1 Property |
