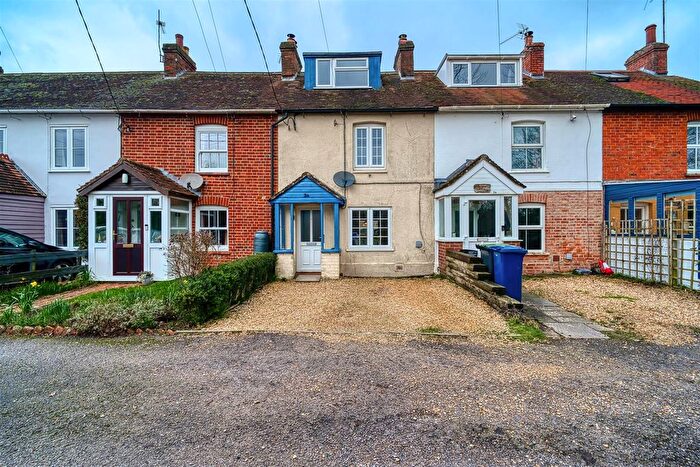
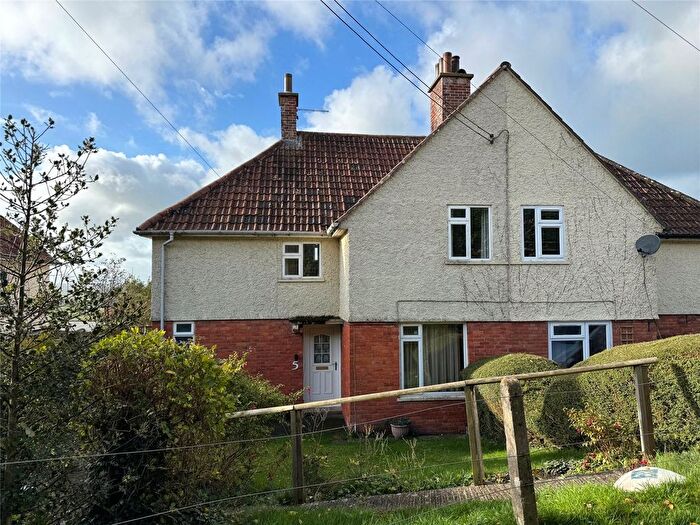
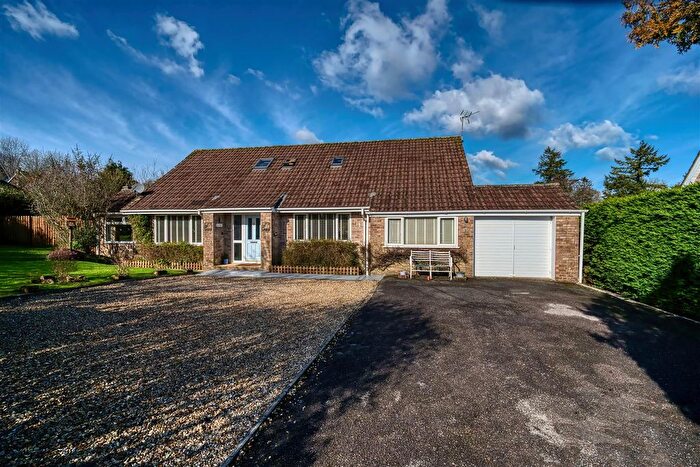
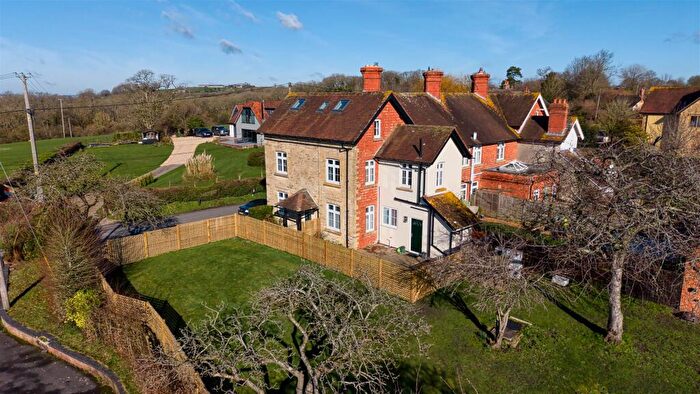
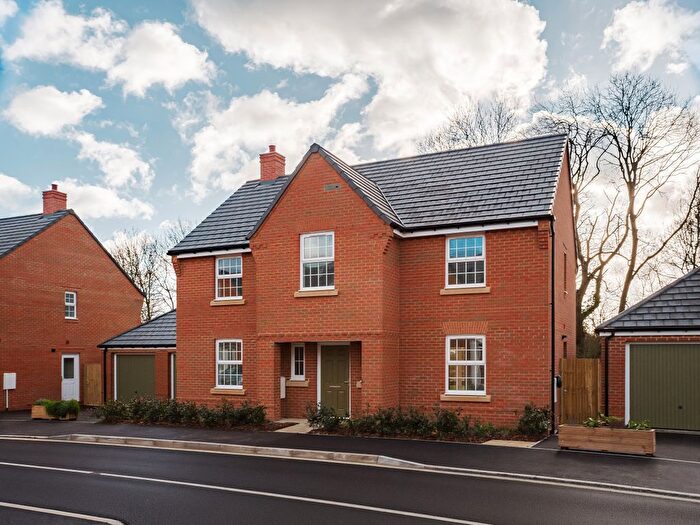
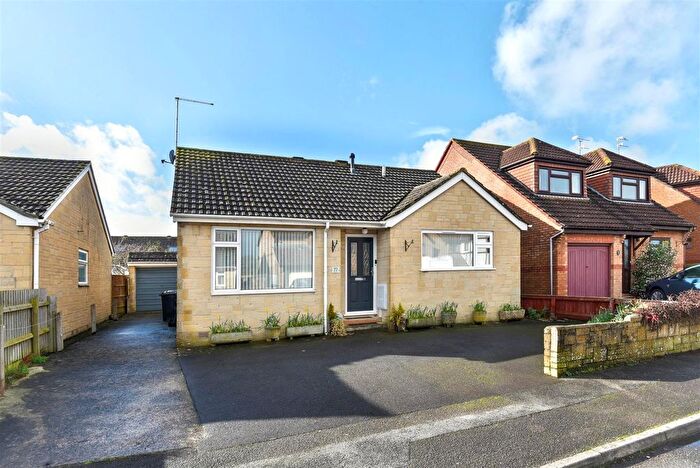
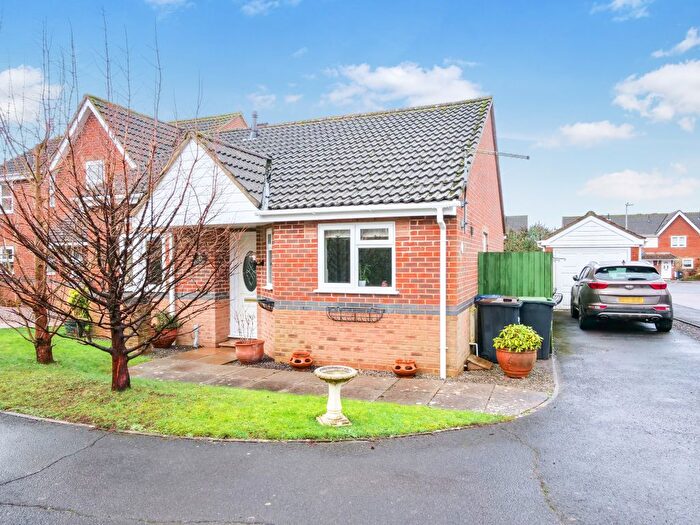
Houses for sale & to rent in Bourton And District, Gillingham
House Prices in Bourton And District
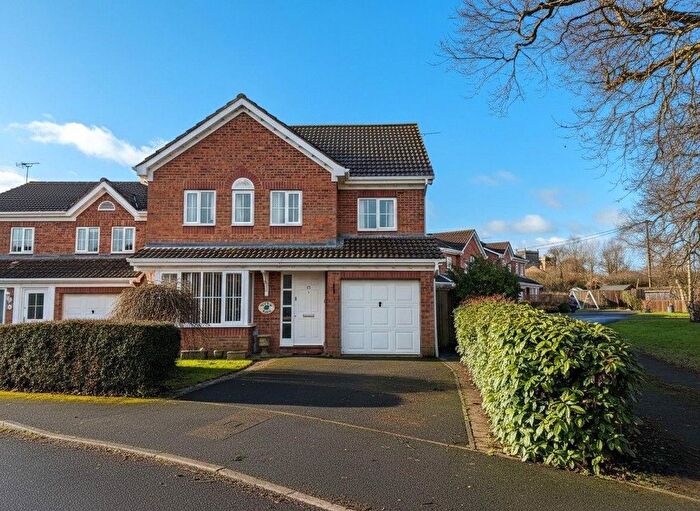
Properties in Bourton And District have an average house price of £478,556.00 and had 58 Property Transactions within the last 3 years¹.
Bourton And District is an area in Gillingham, Dorset with 751 households², where the most expensive property was sold for £1,250,000.00.
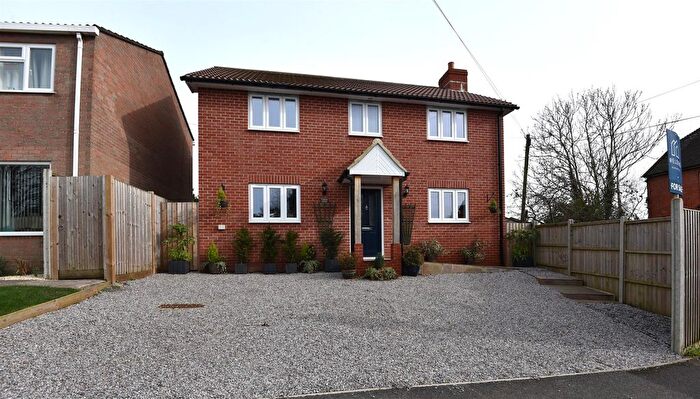
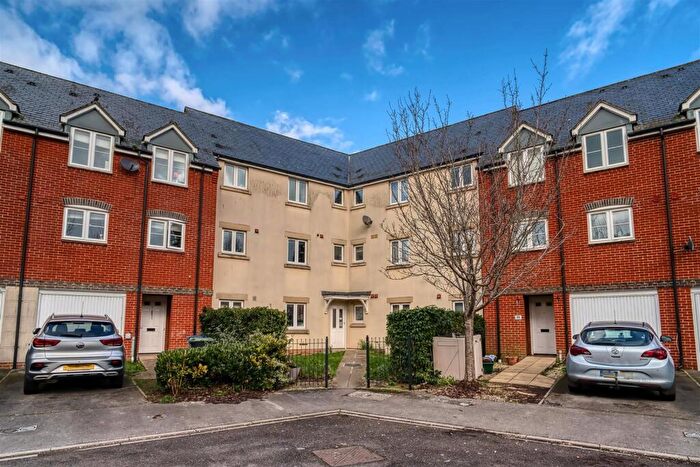
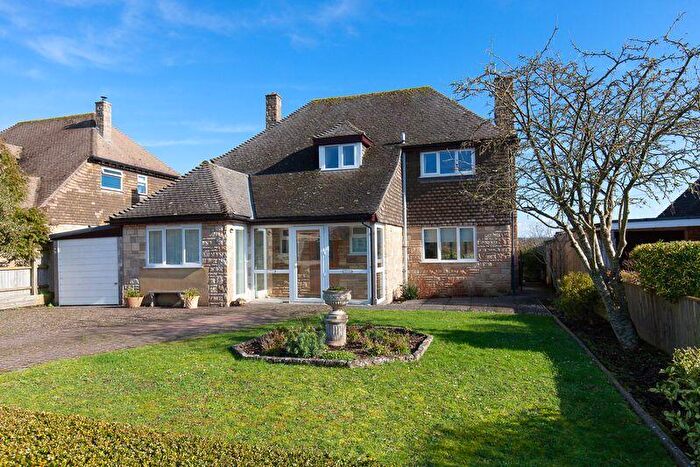
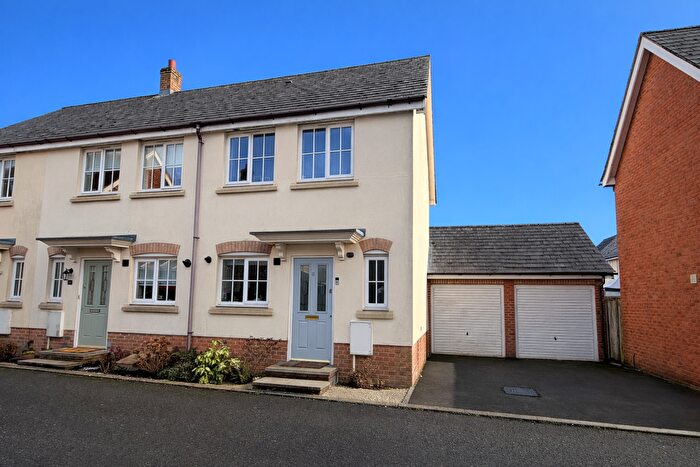
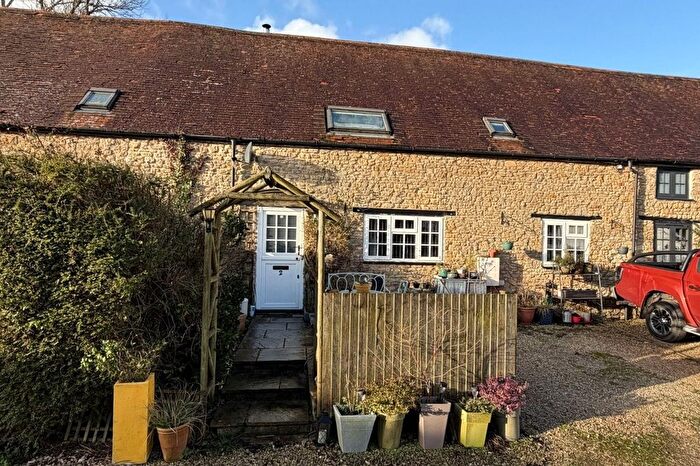
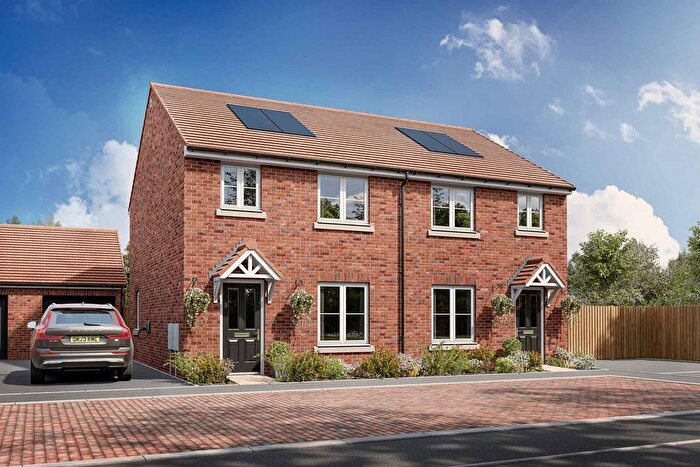
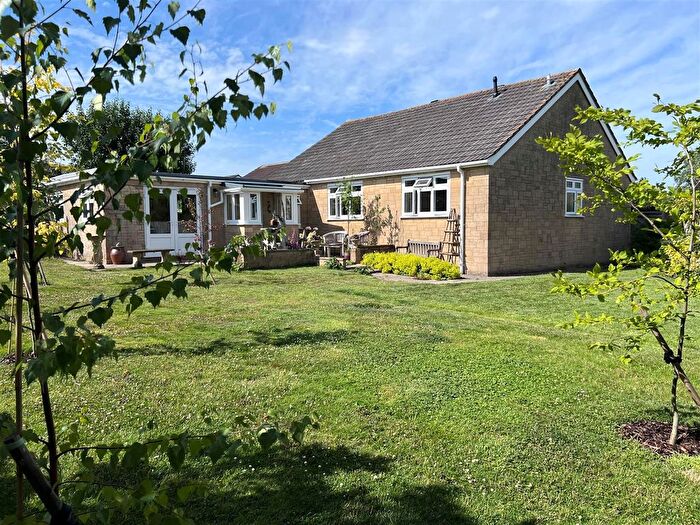
Properties for sale in Bourton And District
Roads and Postcodes in Bourton And District
Navigate through our locations to find the location of your next house in Bourton And District, Gillingham for sale or to rent.
| Streets | Postcodes |
|---|---|
| Back Lane | SP8 5EL |
| Badgers Close | SP8 5FD |
| Bleet Lane | SP8 5RG |
| Bowden | SP8 5EE |
| Breach Close | SP8 5BB |
| Brickyard Lane | SP8 5PJ |
| Bridge Street | SP8 5BA |
| Chaffeymoor | SP8 5BY SP8 5BZ |
| Chapel Hill | SP8 5ER |
| Church Close | SP8 5BP |
| Church Hill | SP8 5EG SP8 5HS |
| Church Road | SP8 5PR |
| Church Track | SP8 5BW |
| Church View | SP8 5BT |
| Court Cottages | SP8 5HJ |
| Cross Roads | SP8 5DD |
| Culvers | SP8 5DR |
| Dry Lane | SP8 5DP |
| Dunns Lane | SP8 5PP |
| East Street | SP8 5PL SP8 5QU |
| Easton Place | SP8 5AW |
| Fantley Lane | SP8 5AH SP8 5AJ SP8 5AL |
| Green Lane | SP8 5EQ |
| High Street | SP8 5AT |
| Jubilee Farm Cottages | SP8 5SH |
| Langham Lane | SP8 5NT |
| Manor Cottages | SP8 5HH |
| Mede Close | SP8 5BL |
| Mill Lane | SP8 5DA |
| Mill Rise | SP8 5DH |
| Millers Close | SP8 5AS |
| Nations | SP8 5RB |
| New Close | SP8 5DL |
| New Stud Cottages | SP8 5DY |
| New Town | SP8 5EU |
| Nyland | SP8 5SJ |
| Old Pound Court | SP8 5ST |
| Olde Fairfield | SP8 5YG |
| Orchard Cottages | SP8 5BG |
| Overways | SP8 5SQ |
| Pill Meadow | SP8 5EN |
| Queen Oak | SP8 5AN |
| Red Lion Yard | SP8 5DW |
| Rose Cottages | SP8 5BE |
| Sandways Cottages | SP8 5BH |
| Shave Hill | SP8 5HY |
| Shepherds Hill | SP8 5HX |
| Shutes Lane | SP8 5HZ |
| Silton Road | SP8 5DE |
| South Street | SP8 5ET |
| Spring Garden Cottage | SP8 5AP |
| Stroud Common | SP8 5PN |
| Tan Lane | SP8 5AR |
| Taylor Hayes | SP8 5PS |
| The Sycamores | SP8 5DN |
| Tunnel Head | SP8 5EA |
| Victoria Cottages | SP8 5DG |
| West Bourton Road | SP8 5PG SP8 5PQ |
| Weston Street | SP8 5HG |
| SP8 5AE SP8 5AF SP8 5AQ SP8 5AX SP8 5AY SP8 5AZ SP8 5BD SP8 5BJ SP8 5BN SP8 5BQ SP8 5BS SP8 5BX SP8 5DB SP8 5DF SP8 5DQ SP8 5DT SP8 5DZ SP8 5EB SP8 5ED SP8 5EF SP8 5ES SP8 5EW SP8 5HD SP8 5HF SP8 5HL SP8 5HT SP8 5HW SP8 5JH SP8 5NR SP8 5NX SP8 5NY SP8 5PA SP8 5PE SP8 5PF SP8 5RD SP8 5RE |
Transport near Bourton And District
- FAQ
- Price Paid By Year
- Property Type Price
Frequently asked questions about Bourton And District
What is the average price for a property for sale in Bourton And District?
The average price for a property for sale in Bourton And District is £478,556. This amount is 52% higher than the average price in Gillingham. There are 2,062 property listings for sale in Bourton And District.
What streets have the most expensive properties for sale in Bourton And District?
The streets with the most expensive properties for sale in Bourton And District are Bleet Lane at an average of £1,250,000, Fantley Lane at an average of £812,500 and High Street at an average of £629,500.
What streets have the most affordable properties for sale in Bourton And District?
The streets with the most affordable properties for sale in Bourton And District are Church View at an average of £167,833, West Bourton Road at an average of £198,500 and New Close at an average of £246,500.
Which train stations are available in or near Bourton And District?
Some of the train stations available in or near Bourton And District are Gillingham (Dorset), Templecombe and Bruton.
Property Price Paid in Bourton And District by Year
The average sold property price by year was:
| Year | Average Sold Price | Price Change |
Sold Properties
|
|---|---|---|---|
| 2025 | £453,204 | -8% |
22 Properties |
| 2024 | £491,137 | -1% |
20 Properties |
| 2023 | £497,687 | -61% |
16 Properties |
| 2022 | £802,168 | 41% |
25 Properties |
| 2021 | £469,717 | -1% |
32 Properties |
| 2020 | £473,576 | -0,1% |
26 Properties |
| 2019 | £474,113 | 30% |
22 Properties |
| 2018 | £332,722 | -24% |
27 Properties |
| 2017 | £411,517 | 5% |
28 Properties |
| 2016 | £391,435 | 18% |
31 Properties |
| 2015 | £320,151 | -24% |
31 Properties |
| 2014 | £398,145 | 24% |
30 Properties |
| 2013 | £303,201 | 4% |
28 Properties |
| 2012 | £290,052 | -9% |
19 Properties |
| 2011 | £315,325 | -1% |
20 Properties |
| 2010 | £319,433 | 11% |
15 Properties |
| 2009 | £284,191 | -2% |
31 Properties |
| 2008 | £290,776 | -21% |
17 Properties |
| 2007 | £352,243 | 1% |
43 Properties |
| 2006 | £349,722 | -2% |
37 Properties |
| 2005 | £358,413 | 17% |
26 Properties |
| 2004 | £297,081 | -7% |
29 Properties |
| 2003 | £318,344 | 37% |
35 Properties |
| 2002 | £200,426 | 5% |
38 Properties |
| 2001 | £191,020 | -6% |
35 Properties |
| 2000 | £203,098 | 17% |
39 Properties |
| 1999 | £168,856 | 30% |
48 Properties |
| 1998 | £117,759 | -7% |
26 Properties |
| 1997 | £126,246 | 19% |
44 Properties |
| 1996 | £102,223 | -14% |
33 Properties |
| 1995 | £116,702 | - |
20 Properties |
Property Price per Property Type in Bourton And District
Here you can find historic sold price data in order to help with your property search.
The average Property Paid Price for specific property types in the last three years are:
| Property Type | Average Sold Price | Sold Properties |
|---|---|---|
| Semi Detached House | £377,461.00 | 13 Semi Detached Houses |
| Detached House | £561,480.00 | 38 Detached Houses |
| Terraced House | £244,400.00 | 5 Terraced Houses |
| Flat | £145,500.00 | 2 Flats |

