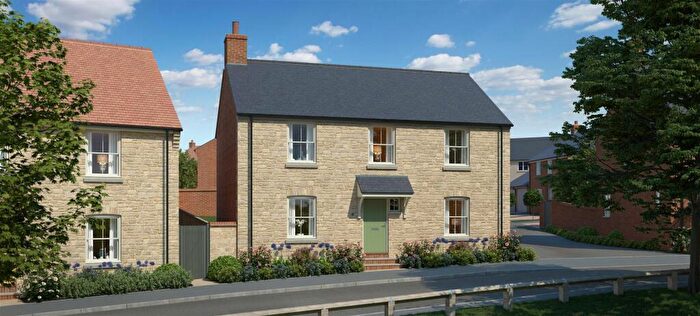
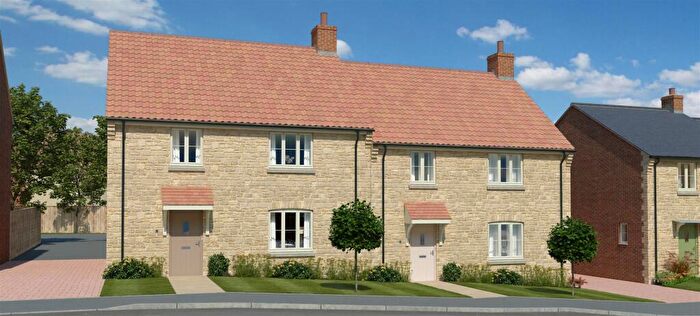
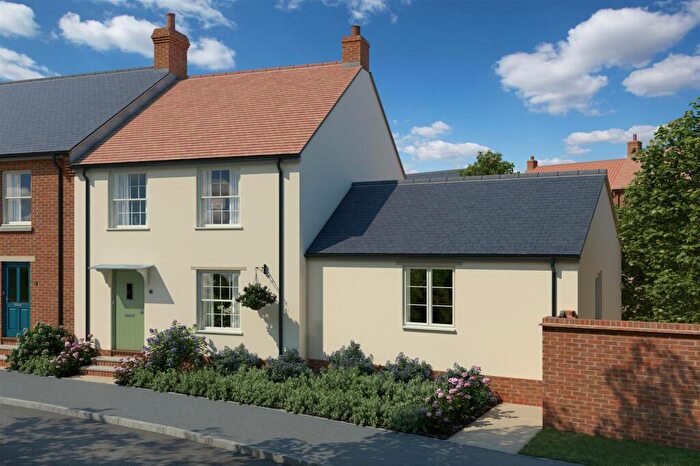
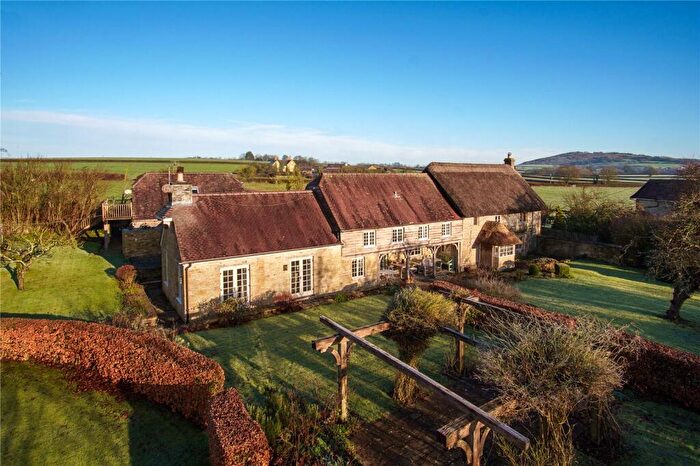
Houses for sale & to rent in The Stours, Gillingham
House Prices in The Stours
Properties in The Stours have an average house price of £528,067.00 and had 57 Property Transactions within the last 3 years¹.
The Stours is an area in Gillingham, Dorset with 484 households², where the most expensive property was sold for £1,875,000.00.
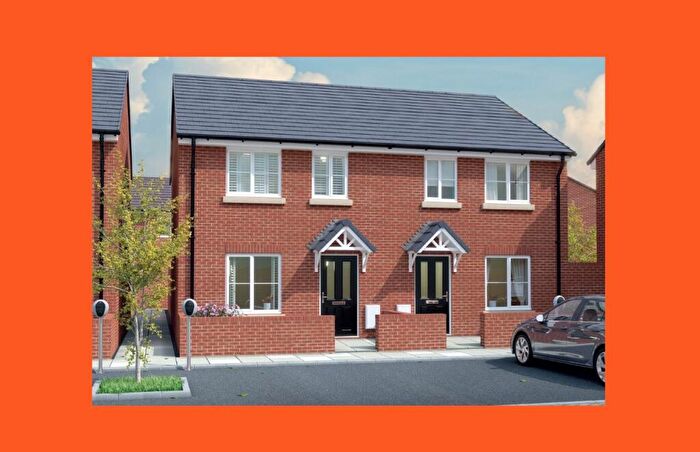
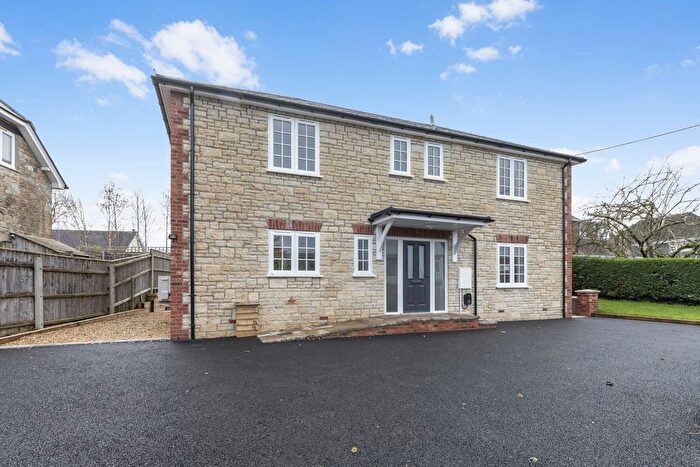
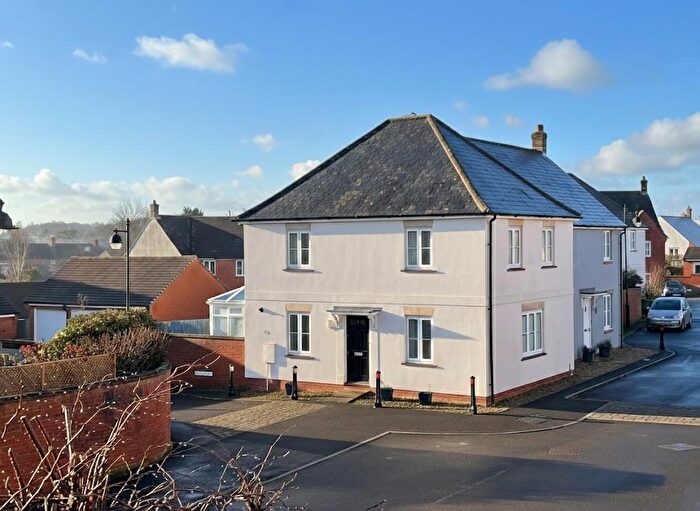
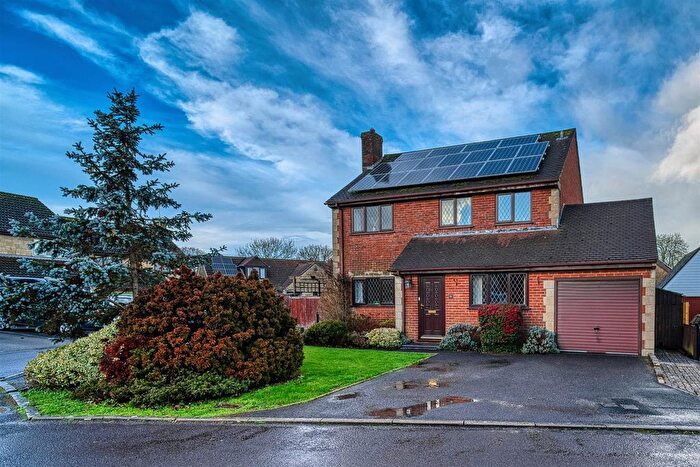
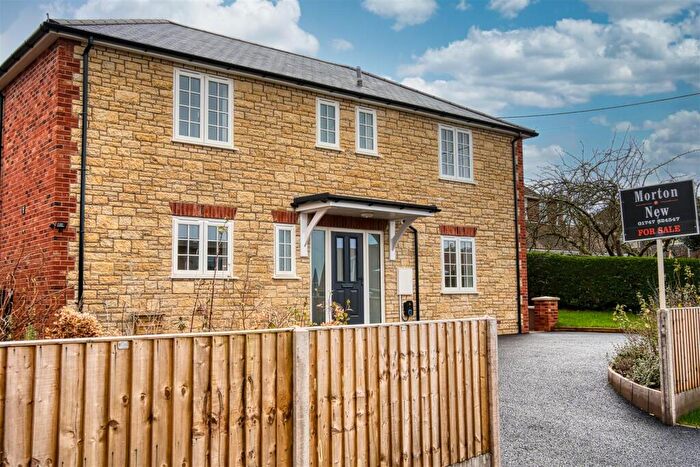
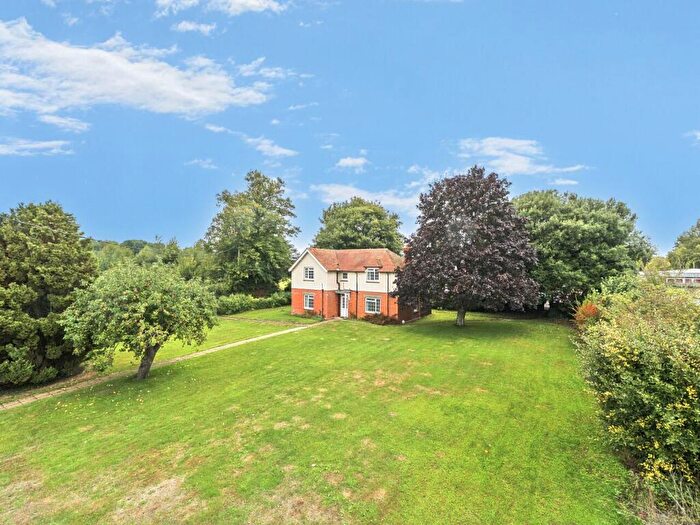
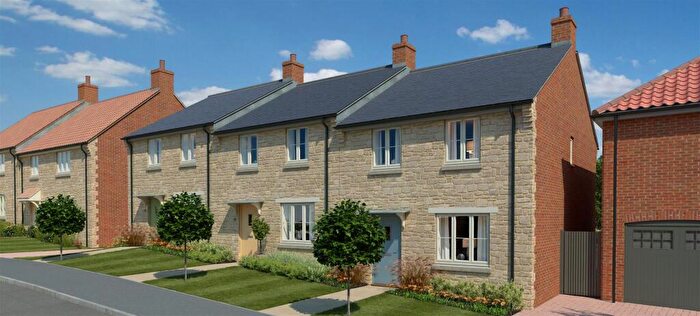
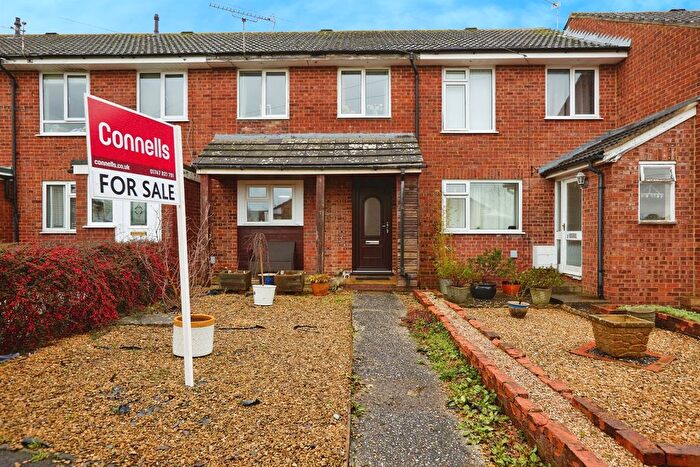
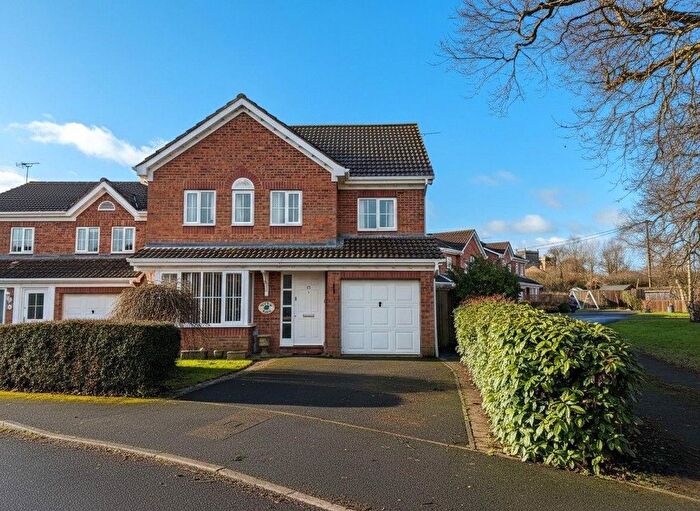
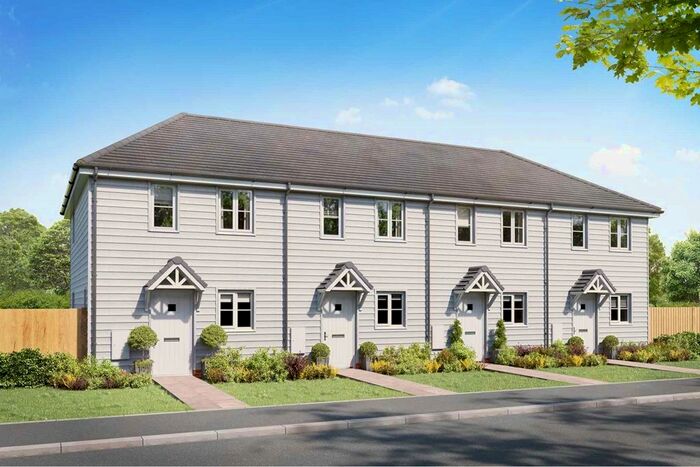
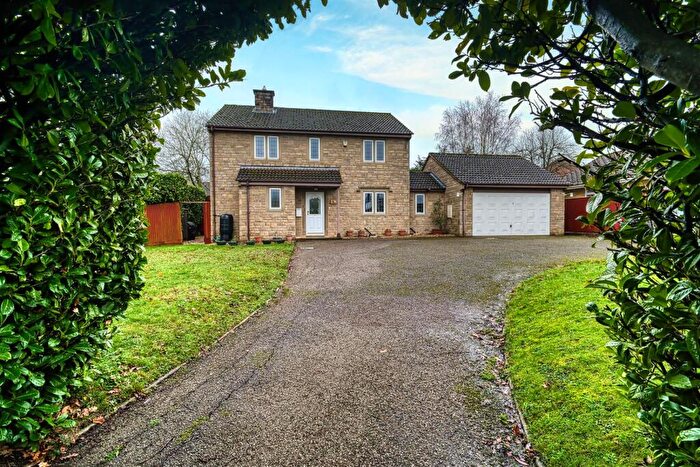
Properties for sale in The Stours
Roads and Postcodes in The Stours
Navigate through our locations to find the location of your next house in The Stours, Gillingham for sale or to rent.
| Streets | Postcodes |
|---|---|
| Back Street | SP8 5JY SP8 5JZ SP8 5LD |
| Browns Lane | SP8 5JT |
| Butts Lane | SP8 5RU |
| Church Street | SP8 5RL |
| Cole Street Lane | SP8 5JQ |
| Cross Roads | SP8 5LW |
| Duncliffe View | SP8 5JD |
| Fern Hill | SP8 5ND |
| Five Bridges Cottage | SP8 5SF |
| Forge End | SP8 5NF |
| Front Street | SP8 5LF SP8 5LH SP8 5LQ |
| Head Lane | SP8 5LJ |
| Hunger Hill | SP8 5JR |
| Knapp Cottages | SP8 5JU |
| Manor Farm Gate | SP8 5RW |
| Mill Lane | SP8 5RX |
| New Lane | SP8 5NA |
| Post Office Cottage | SP8 5JX |
| Quarry Close | SP8 5SD |
| Ridge Close | SP8 5GY |
| Sandilands Close | SP8 5LG |
| Scotchey Lane | SP8 5LT |
| Scotchy Hill | SP8 5LR |
| Stour Close | SP8 5LL |
| Stour Lane | SP8 5SN |
| Terrace Lane | SP8 5LS |
| The Common | SP8 5NB |
| The Fieldings | SP8 5LE |
| The Lynch | SP8 5RN |
| The Street | SP8 5RZ |
| Whitefield Drive | SP8 5BF |
| Witch Close | SP8 5LB |
| Witch Lane | SP8 5NZ |
| Witchfield | SP8 5LA |
| Woodville | SP8 5LX SP8 5LY |
| SP8 5JS SP8 5RJ SP8 5RP SP8 5RR SP8 5RT SP8 5SA SP8 5SB SP8 5SE SP8 5SL SP8 5SW |
Transport near The Stours
- FAQ
- Price Paid By Year
- Property Type Price
Frequently asked questions about The Stours
What is the average price for a property for sale in The Stours?
The average price for a property for sale in The Stours is £528,067. This amount is 67% higher than the average price in Gillingham. There are 1,405 property listings for sale in The Stours.
What streets have the most expensive properties for sale in The Stours?
The streets with the most expensive properties for sale in The Stours are Woodville at an average of £1,151,000, The Common at an average of £1,075,000 and Scotchey Lane at an average of £985,000.
What streets have the most affordable properties for sale in The Stours?
The streets with the most affordable properties for sale in The Stours are Cross Roads at an average of £138,000, Forge End at an average of £230,000 and Cole Street Lane at an average of £257,500.
Which train stations are available in or near The Stours?
Some of the train stations available in or near The Stours are Gillingham (Dorset), Templecombe and Tisbury.
Property Price Paid in The Stours by Year
The average sold property price by year was:
| Year | Average Sold Price | Price Change |
Sold Properties
|
|---|---|---|---|
| 2025 | £399,958 | -25% |
12 Properties |
| 2024 | £499,414 | -28% |
25 Properties |
| 2023 | £640,750 | 28% |
20 Properties |
| 2022 | £460,225 | -4% |
20 Properties |
| 2021 | £478,426 | 33% |
36 Properties |
| 2020 | £320,375 | 3% |
20 Properties |
| 2019 | £311,829 | -31% |
19 Properties |
| 2018 | £407,175 | -8% |
20 Properties |
| 2017 | £437,936 | 13% |
30 Properties |
| 2016 | £382,673 | 2% |
26 Properties |
| 2015 | £373,616 | 29% |
24 Properties |
| 2014 | £266,675 | -45% |
20 Properties |
| 2013 | £386,847 | 20% |
24 Properties |
| 2012 | £311,000 | 16% |
14 Properties |
| 2011 | £262,107 | -40% |
14 Properties |
| 2010 | £365,980 | 26% |
26 Properties |
| 2009 | £269,500 | -9% |
13 Properties |
| 2008 | £292,900 | -22% |
10 Properties |
| 2007 | £358,605 | 26% |
28 Properties |
| 2006 | £264,708 | -0,4% |
24 Properties |
| 2005 | £265,823 | -81% |
30 Properties |
| 2004 | £480,151 | 54% |
23 Properties |
| 2003 | £218,740 | 1% |
21 Properties |
| 2002 | £215,805 | -9% |
38 Properties |
| 2001 | £235,803 | 28% |
31 Properties |
| 2000 | £169,157 | 29% |
28 Properties |
| 1999 | £119,716 | -20% |
27 Properties |
| 1998 | £143,138 | 21% |
18 Properties |
| 1997 | £113,071 | 24% |
38 Properties |
| 1996 | £86,412 | 18% |
24 Properties |
| 1995 | £70,928 | - |
20 Properties |
Property Price per Property Type in The Stours
Here you can find historic sold price data in order to help with your property search.
The average Property Paid Price for specific property types in the last three years are:
| Property Type | Average Sold Price | Sold Properties |
|---|---|---|
| Semi Detached House | £352,056.00 | 15 Semi Detached Houses |
| Detached House | £668,264.00 | 34 Detached Houses |
| Terraced House | £273,285.00 | 7 Terraced Houses |
| Flat | £185,000.00 | 1 Flat |

