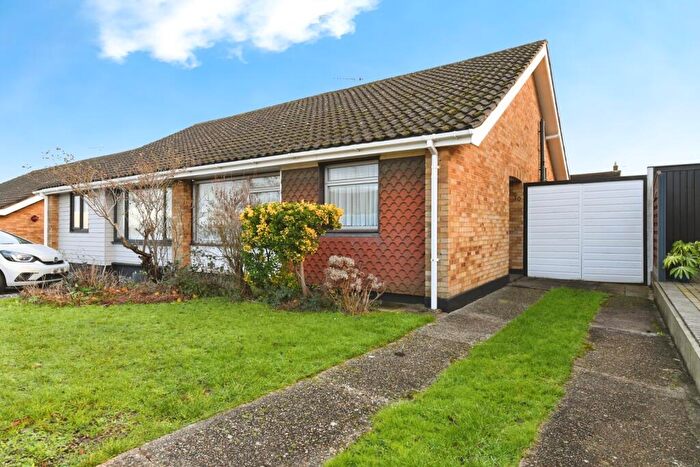
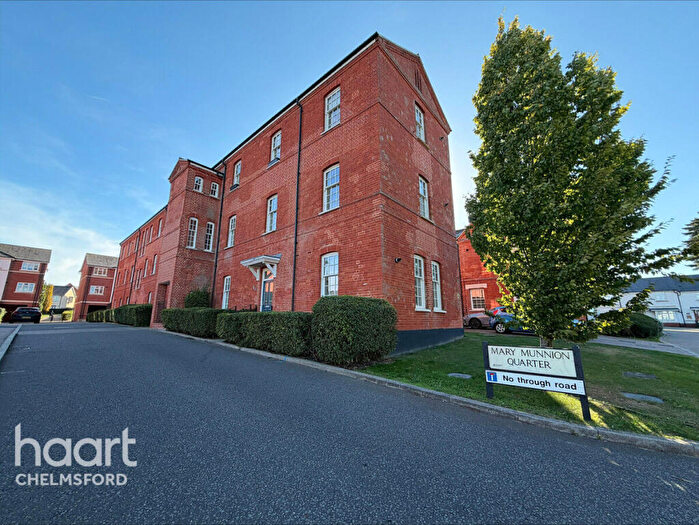
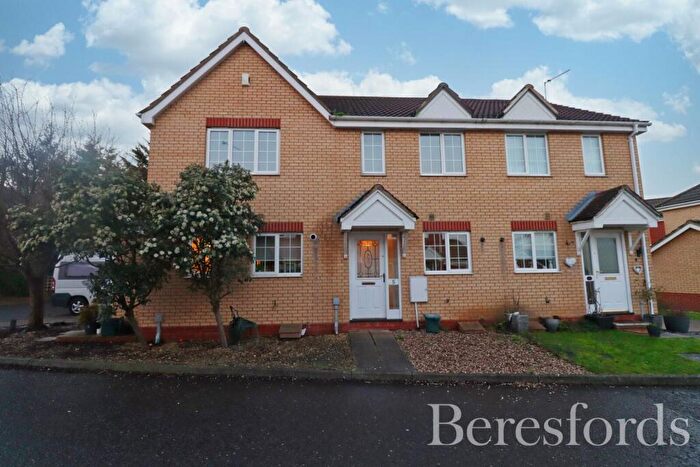
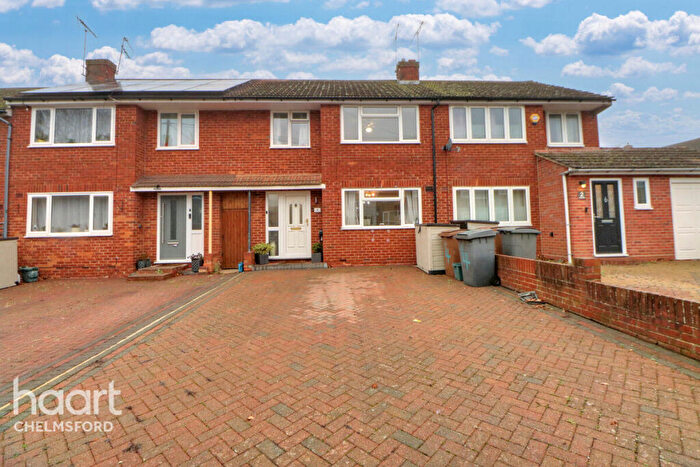
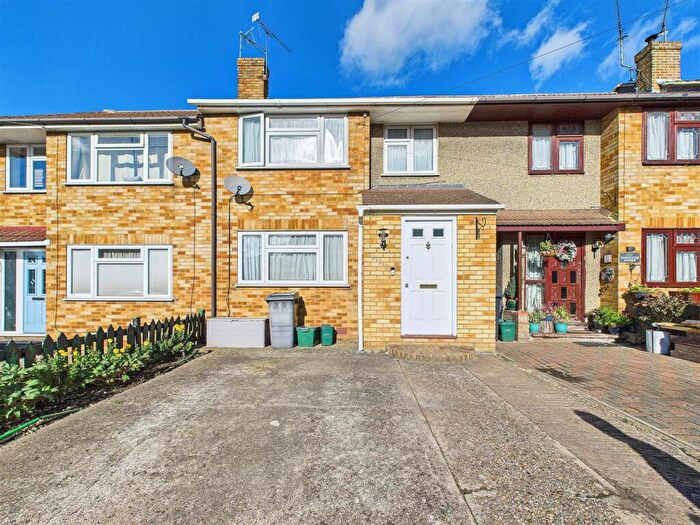
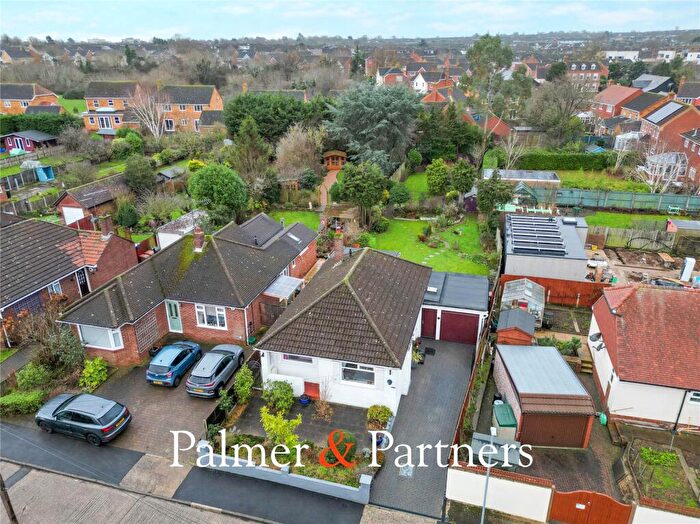
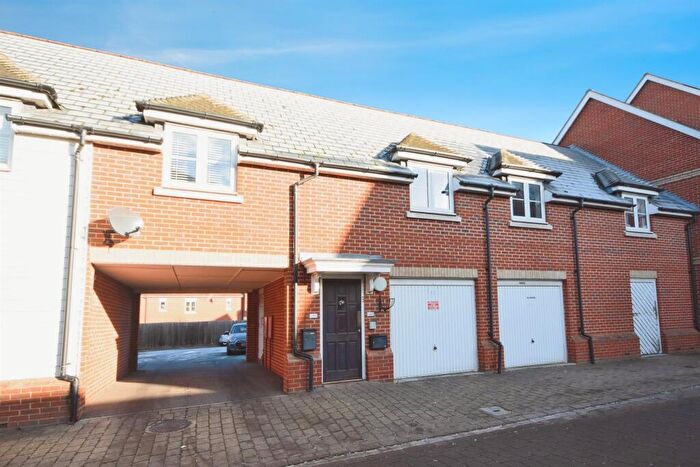
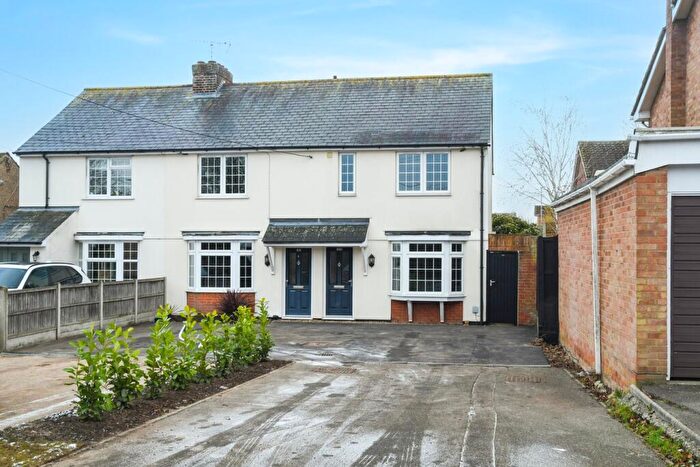
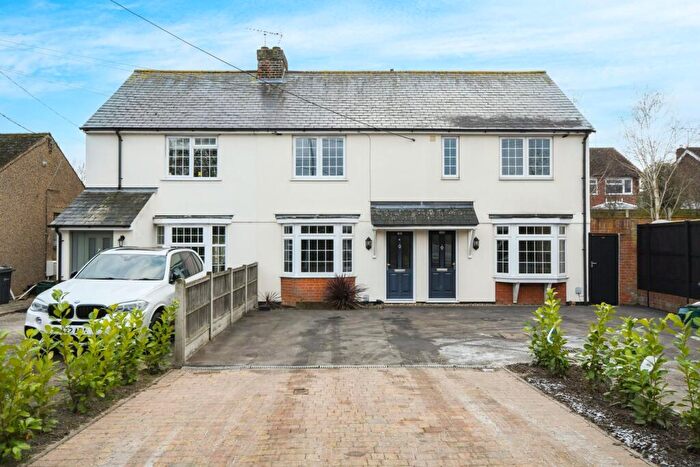
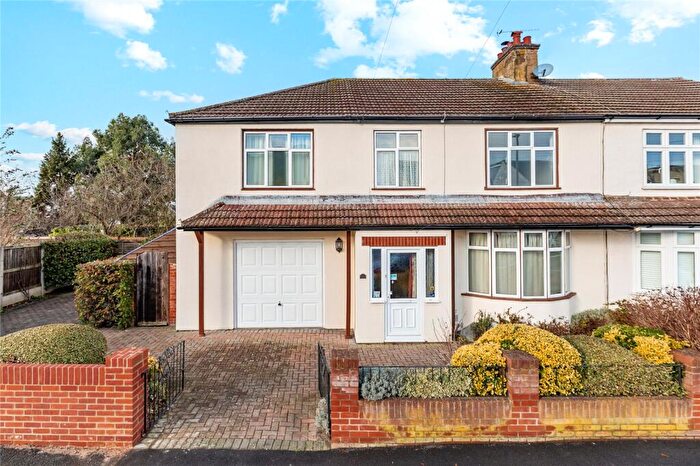
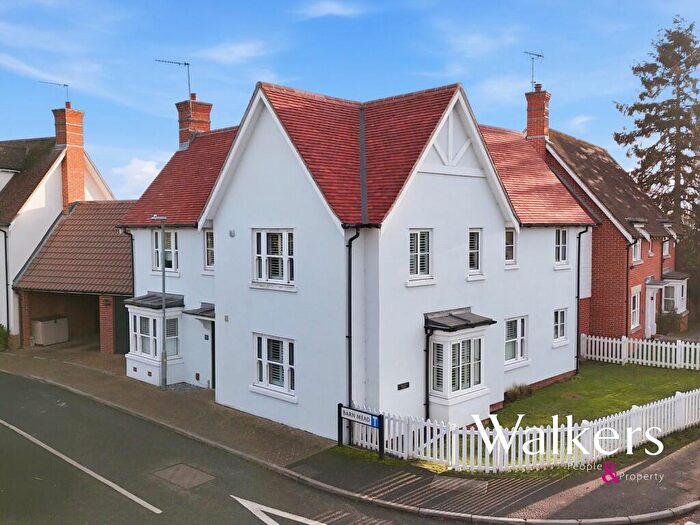
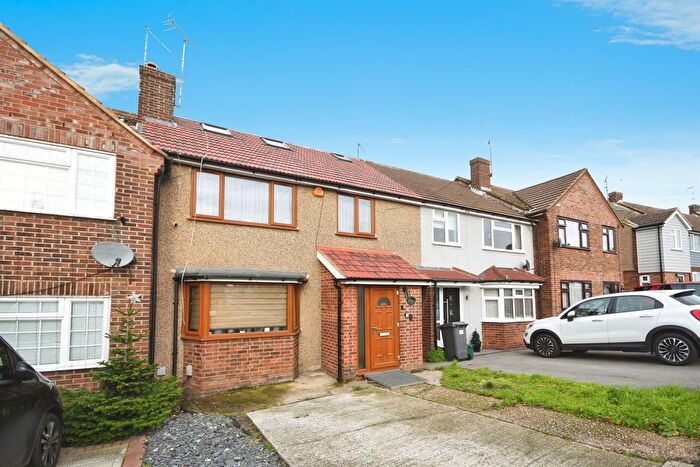
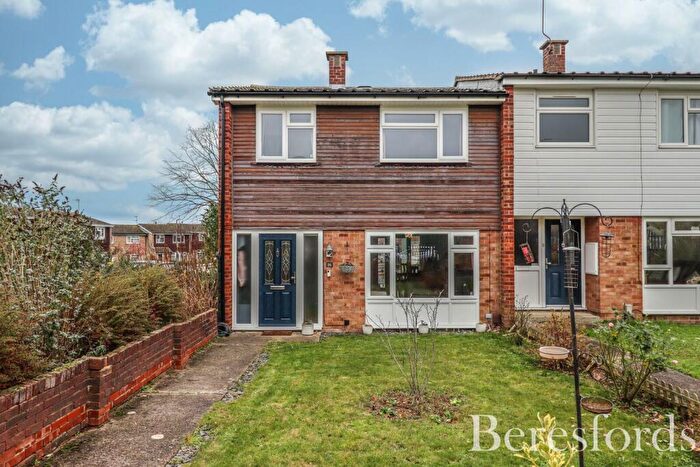
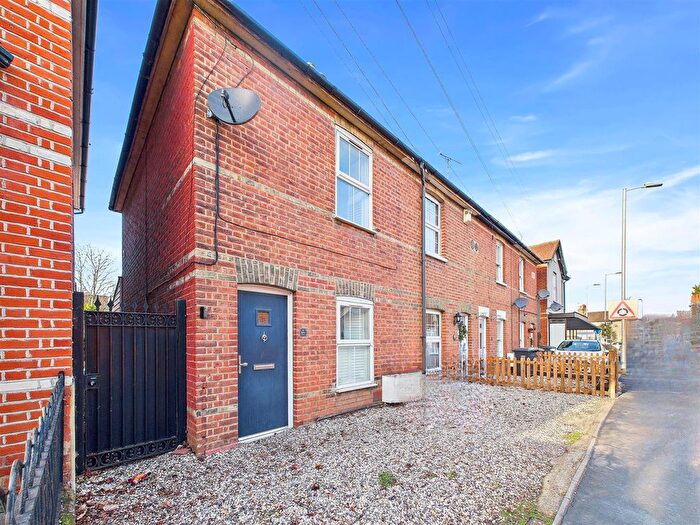
Houses for sale & to rent in Galleywood, Chelmsford
House Prices in Galleywood
Properties in Galleywood have an average house price of £413,399.00 and had 245 Property Transactions within the last 3 years¹.
Galleywood is an area in Chelmsford, Essex with 2,431 households², where the most expensive property was sold for £1,437,500.00.
Properties for sale in Galleywood
Roads and Postcodes in Galleywood
Navigate through our locations to find the location of your next house in Galleywood, Chelmsford for sale or to rent.
| Streets | Postcodes |
|---|---|
| Archers Way | CM2 8SB CM2 8SD |
| Arnold Way | CM2 8PA |
| Attwoods Close | CM2 8QJ |
| Avila Chase | CM2 8QE |
| Badgers Close | CM2 8QB |
| Bakers Lane | CM2 8LD |
| Barn Mead | CM2 8LS |
| Barnard Road | CM2 8RR CM2 8RS CM2 8RT CM2 8RU CM2 8SR CM2 8DA CM2 8RX |
| Beehive Lane | CM2 8RJ CM2 8RL CM2 8RN |
| Bekeswell Place | CM2 8SP |
| Birches Walk | CM2 8TZ |
| Braziers Close | CM2 8YJ |
| Brograve Close | CM2 8YA |
| Brook Lane | CM2 7SX CM2 8NJ CM2 8NL CM2 8NN CM2 8FY |
| Bullen Walk | CM2 8YF |
| Cannon Leys | CM2 8PB CM2 8PD |
| Chaplin Close | CM2 8QW |
| Colvin Chase | CM2 8QQ |
| Deadmans Lane | CM2 8LZ |
| Douglas Close | CM2 8YD |
| Galleydene Avenue | CM2 8RY |
| Glebe View | CM2 8PZ |
| Grey Ladys | CM2 8RB |
| Homemead | CM2 8SN CM2 8WA |
| Houblon Drive | CM2 8SE |
| James Croft | CM2 8WD |
| Keene Way | CM2 8NR CM2 8NS CM2 8NT |
| Ketleys | CM2 8YL |
| Kirkmans Road | CM2 8NW |
| Lower Green | CM2 8QS |
| Lyon Close | CM2 8NY |
| Margaretting Road | CM2 8TS CM2 8FU |
| Markland Close | CM2 8RZ |
| Marvens | CM2 8YB |
| Mill Hill | CM2 8TW |
| Milligans Chase | CM2 8QD |
| Moretons | CM2 8RG |
| Moss Path | CM2 8YG CM2 8YQ |
| Parklands Way | CM2 8SF |
| Pavitt Meadow | CM2 8RQ |
| Pipers Tye | CM2 8NP |
| Ponds Road | CM2 8QP |
| Pryors Road | CM2 8SA |
| Pyms Road | CM2 8PX CM2 8PY CM2 8QA |
| Pyne Gate | CM2 8QG |
| Rignals Lane | CM2 8QT CM2 8QU CM2 8RE CM2 8RF |
| Roughtons | CM2 8PE CM2 8PF |
| Rous Chase | CM2 8QF |
| Russets | CM2 8RD |
| Sharpington Close | CM2 8YH |
| Skinners Lane | CM2 8RH CM2 8RP |
| Slades Lane | CM2 8RW |
| Spots Walk | CM2 8YE |
| Spring Rise | CM2 8SH CM2 8SQ |
| St Michaels Walk | CM2 8SG |
| Stock Road | CM2 8JR CM2 8JS CM2 8PP CM2 8PS CM2 8PW CM2 8JU CM2 8JY CM2 8JZ |
| The Chase | CM2 8FX |
| The Common | CM2 8JX CM2 8PL CM2 8TN CM2 8TP CM2 8TR |
| The Limes | CM2 8RA |
| The Street | CM2 8QL CM2 8QN |
| Twitten Lane | CM2 8QR |
| Vale End | CM2 8NZ |
| Walters Close | CM2 8NU |
| Watchouse Road | CM2 8LT CM2 8ND CM2 8NE CM2 8NF CM2 8NG CM2 8NH CM2 8NQ CM2 8PT CM2 8PU |
| Well Lane | CM2 8QY CM2 8QZ |
| West Hanningfield Road | CM2 7SY CM2 7SZ CM2 7TA |
| West Lawn | CM2 8SJ CM2 8SL |
| Willow Bank | CM2 8NX |
Transport near Galleywood
-
Chelmsford Station
-
Ingatestone Station
-
Billericay Station
-
Wickford Station
-
Battlesbridge Station
-
South Woodham Ferrers Station
-
Hatfield Peverel Station
-
Shenfield Station
-
Basildon Station
-
Rayleigh Station
- FAQ
- Price Paid By Year
- Property Type Price
Frequently asked questions about Galleywood
What is the average price for a property for sale in Galleywood?
The average price for a property for sale in Galleywood is £413,399. This amount is 3% lower than the average price in Chelmsford. There are 2,136 property listings for sale in Galleywood.
What streets have the most expensive properties for sale in Galleywood?
The streets with the most expensive properties for sale in Galleywood are Stock Road at an average of £906,250, Rous Chase at an average of £830,000 and Colvin Chase at an average of £758,000.
What streets have the most affordable properties for sale in Galleywood?
The streets with the most affordable properties for sale in Galleywood are St Michaels Walk at an average of £166,000, Spring Rise at an average of £236,000 and Kirkmans Road at an average of £240,000.
Which train stations are available in or near Galleywood?
Some of the train stations available in or near Galleywood are Chelmsford, Ingatestone and Billericay.
Property Price Paid in Galleywood by Year
The average sold property price by year was:
| Year | Average Sold Price | Price Change |
Sold Properties
|
|---|---|---|---|
| 2025 | £408,314 | 3% |
42 Properties |
| 2024 | £397,400 | -1% |
65 Properties |
| 2023 | £401,060 | -11% |
68 Properties |
| 2022 | £443,294 | 1% |
70 Properties |
| 2021 | £438,309 | 9% |
73 Properties |
| 2020 | £400,121 | 4% |
64 Properties |
| 2019 | £385,785 | -4% |
57 Properties |
| 2018 | £402,680 | 4% |
59 Properties |
| 2017 | £388,483 | 5% |
72 Properties |
| 2016 | £368,345 | 16% |
85 Properties |
| 2015 | £308,982 | 8% |
97 Properties |
| 2014 | £283,779 | 6% |
77 Properties |
| 2013 | £267,027 | -3% |
61 Properties |
| 2012 | £275,966 | 1% |
56 Properties |
| 2011 | £273,887 | -1% |
62 Properties |
| 2010 | £276,482 | 5% |
68 Properties |
| 2009 | £262,555 | 4% |
35 Properties |
| 2008 | £251,118 | -12% |
46 Properties |
| 2007 | £281,608 | 16% |
101 Properties |
| 2006 | £235,446 | 4% |
98 Properties |
| 2005 | £225,845 | 5% |
70 Properties |
| 2004 | £213,561 | 2% |
98 Properties |
| 2003 | £209,496 | 24% |
79 Properties |
| 2002 | £158,513 | 7% |
85 Properties |
| 2001 | £147,838 | 10% |
76 Properties |
| 2000 | £132,866 | 13% |
84 Properties |
| 1999 | £115,790 | 13% |
80 Properties |
| 1998 | £100,950 | 0,3% |
95 Properties |
| 1997 | £100,660 | 18% |
125 Properties |
| 1996 | £82,934 | -2% |
79 Properties |
| 1995 | £84,745 | - |
79 Properties |
Property Price per Property Type in Galleywood
Here you can find historic sold price data in order to help with your property search.
The average Property Paid Price for specific property types in the last three years are:
| Property Type | Average Sold Price | Sold Properties |
|---|---|---|
| Semi Detached House | £429,127.00 | 94 Semi Detached Houses |
| Detached House | £616,989.00 | 48 Detached Houses |
| Terraced House | £345,588.00 | 76 Terraced Houses |
| Flat | £187,581.00 | 27 Flats |

