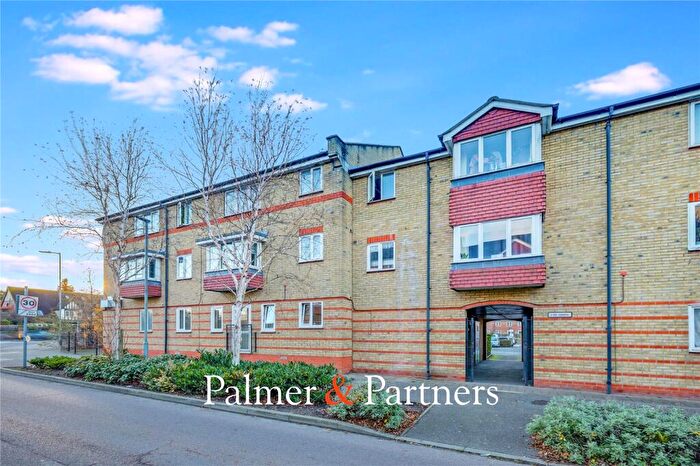
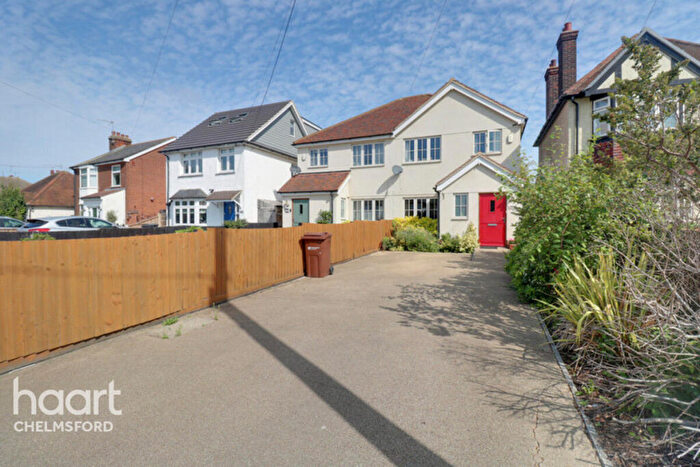
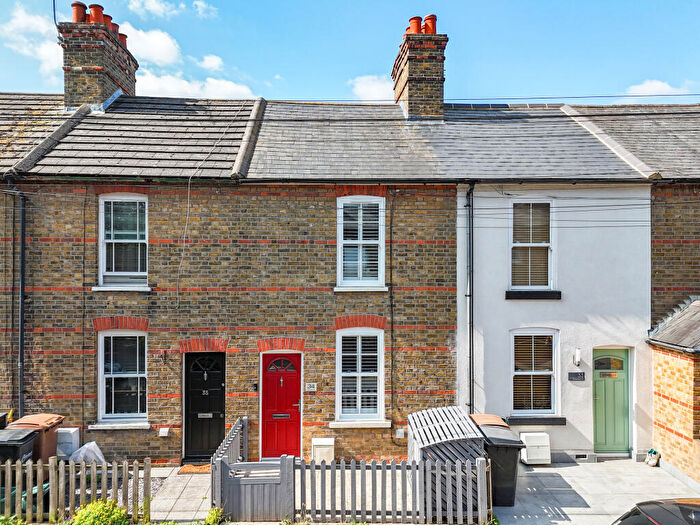
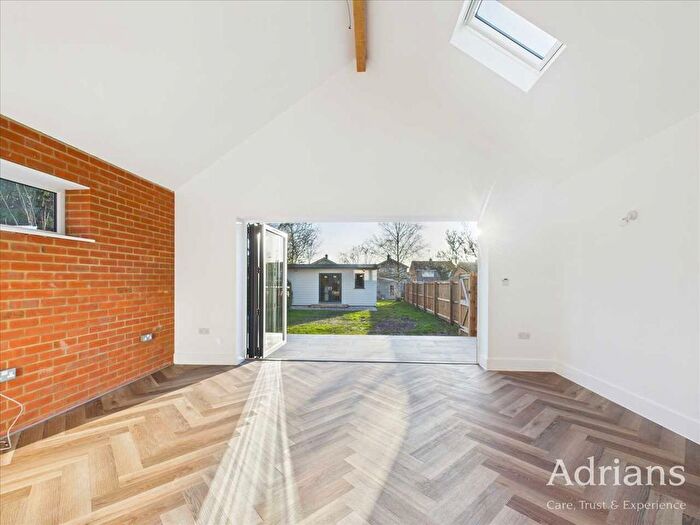
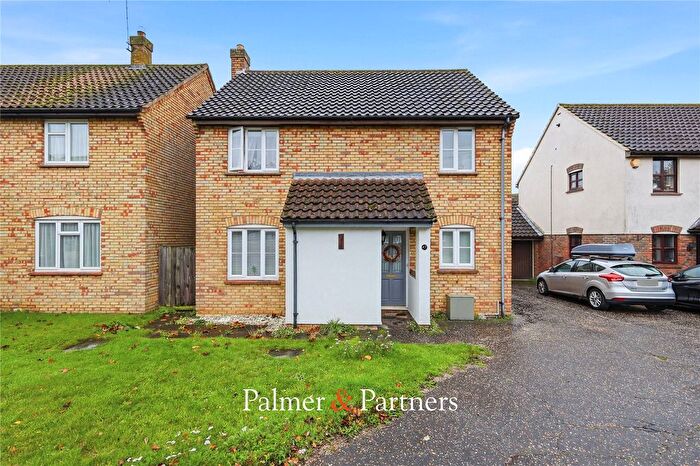
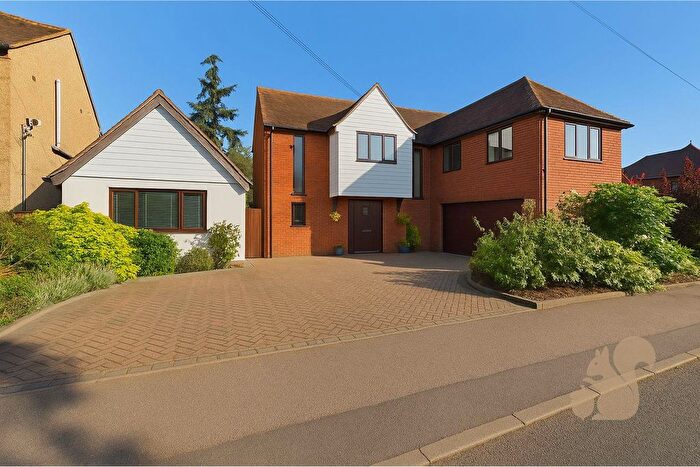
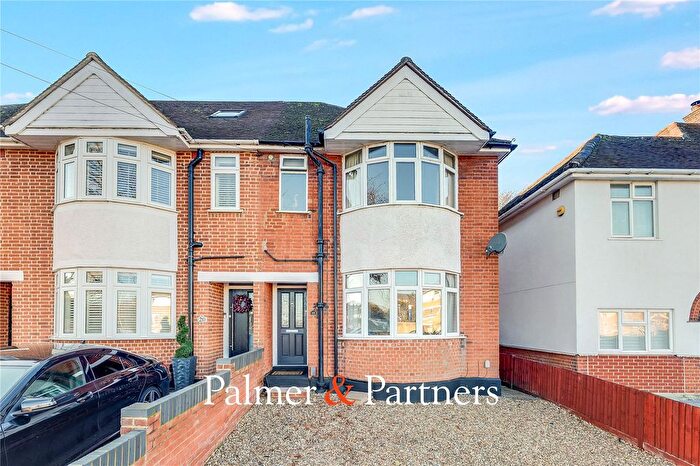
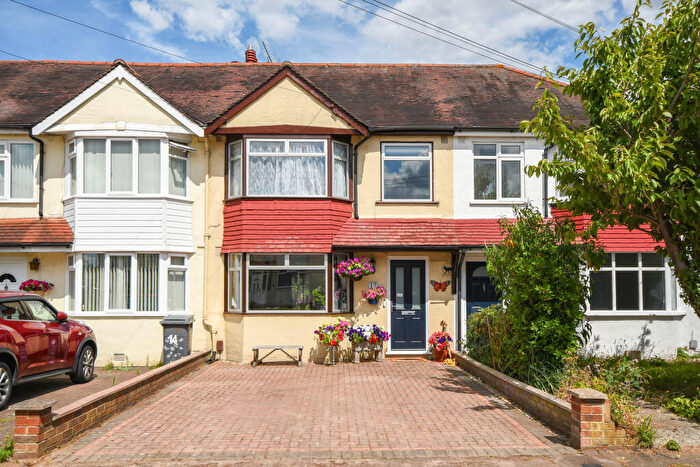
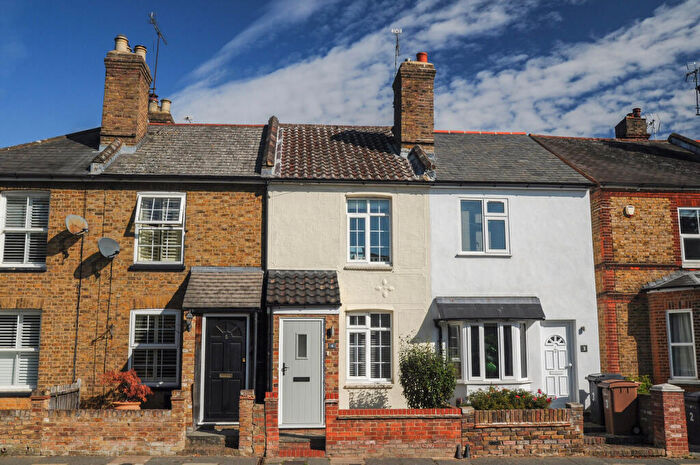
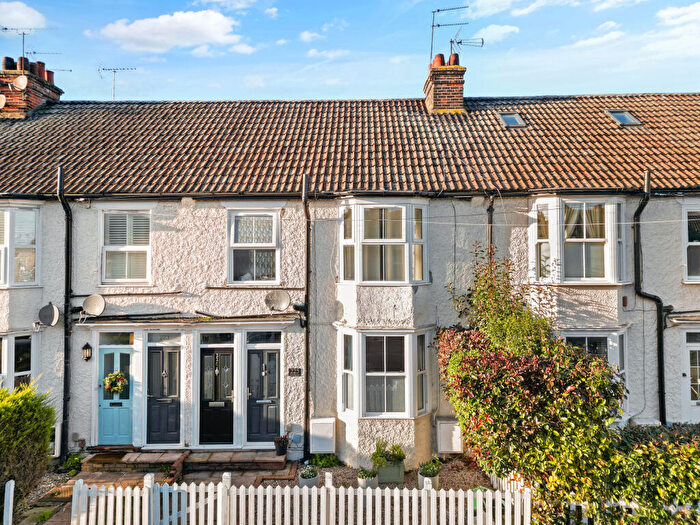
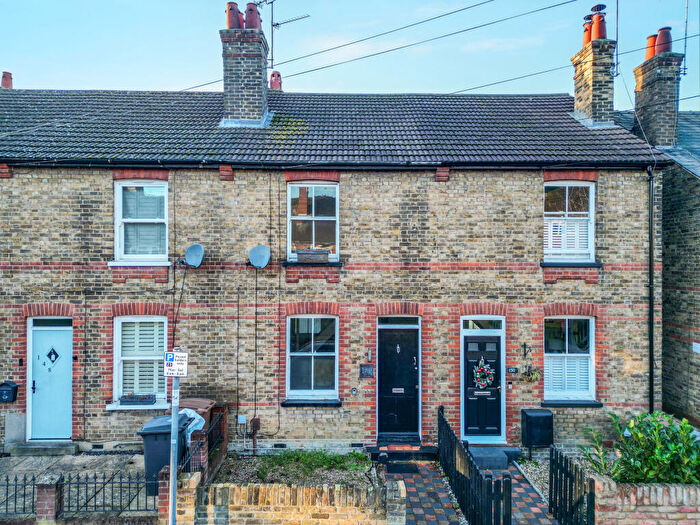
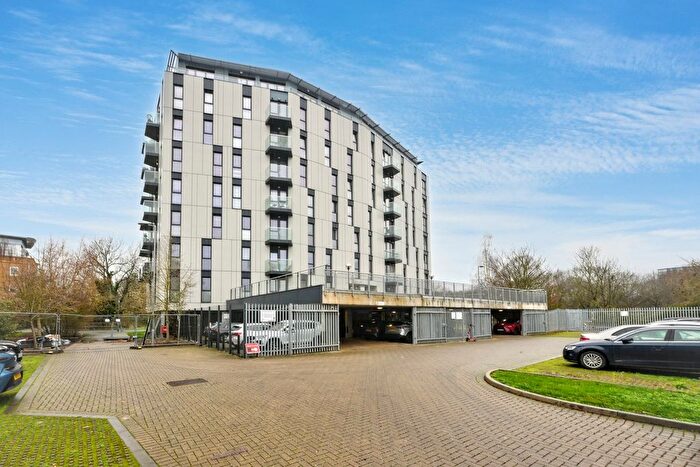
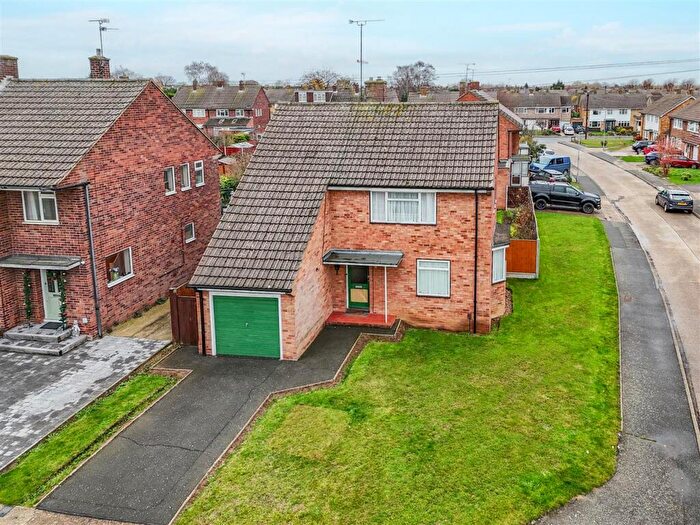
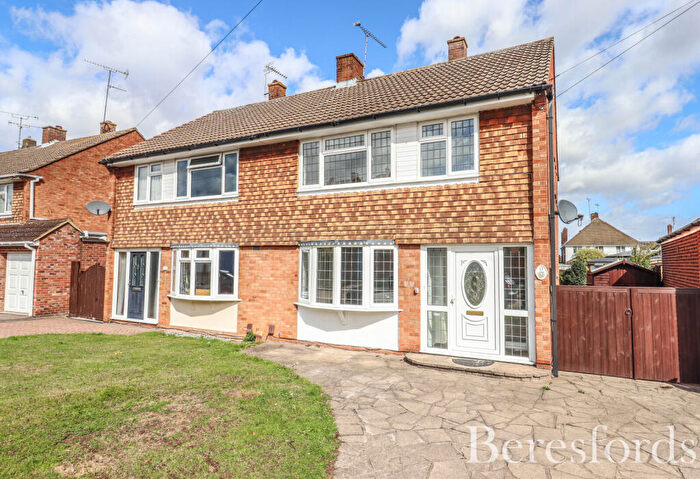
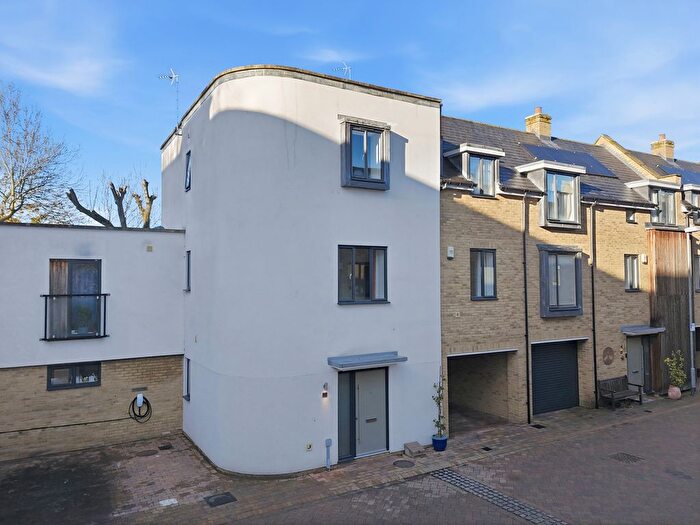
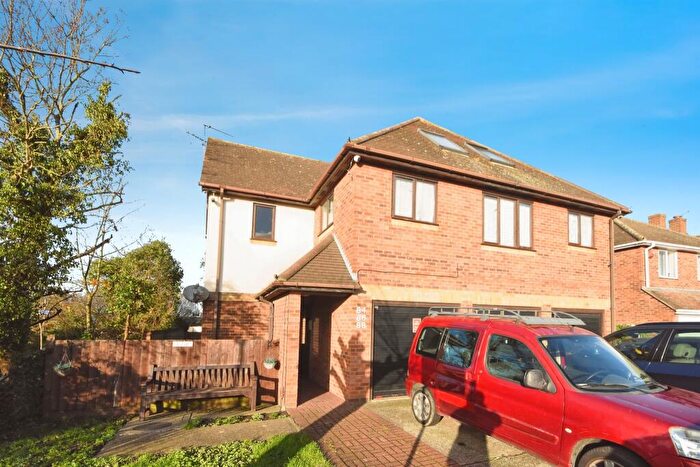
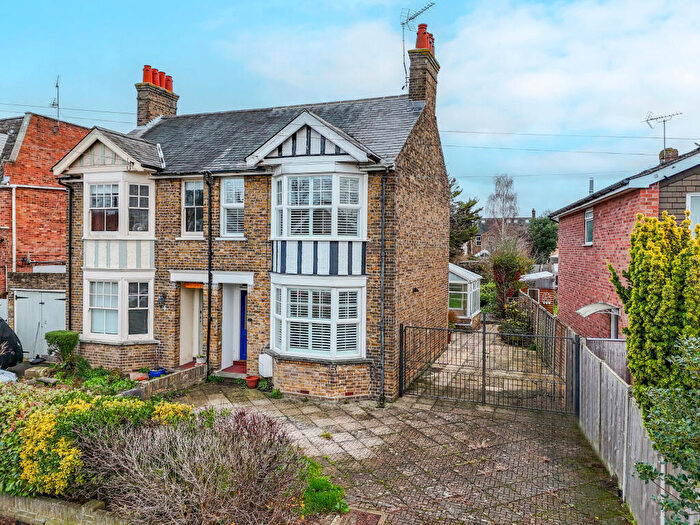
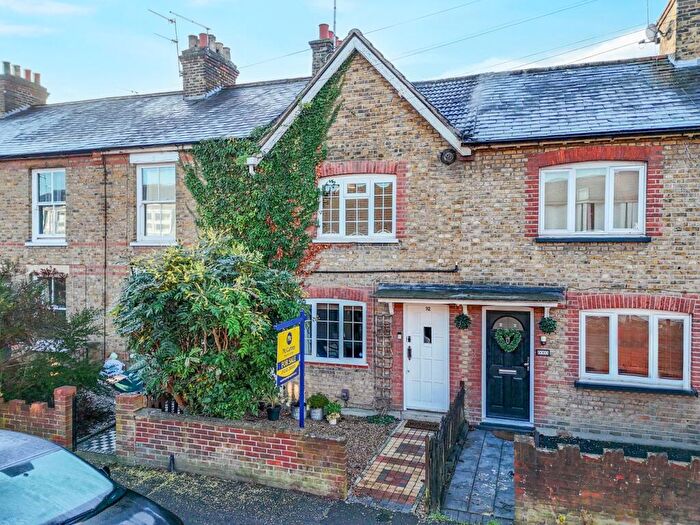
Houses for sale & to rent in Waterhouse Farm, Chelmsford
House Prices in Waterhouse Farm
Properties in Waterhouse Farm have an average house price of £338,203.00 and had 327 Property Transactions within the last 3 years¹.
Waterhouse Farm is an area in Chelmsford, Essex with 2,682 households², where the most expensive property was sold for £730,000.00.
Properties for sale in Waterhouse Farm
Roads and Postcodes in Waterhouse Farm
Navigate through our locations to find the location of your next house in Waterhouse Farm, Chelmsford for sale or to rent.
| Streets | Postcodes |
|---|---|
| Abbess Close | CM1 2SE |
| Alma Drive | CM1 1TW |
| Andrews Place | CM1 2QY |
| Ashford Road | CM1 2ST |
| Ashtree Close | CM1 2RR |
| Ashtree Place | CM1 2RP |
| Baynes Place | CM1 2QX |
| Beeches Close | CM1 2SB |
| Beeches Crescent | CM1 2FU |
| Beeches Road | CM1 2RS CM1 2RX CM1 2RZ CM1 2SA |
| Benedict Drive | CM1 2SD |
| Bilton Road | CM1 2UP |
| Brendon Place | CM1 3DS |
| Canuden Road | CM1 2SU CM1 2SX |
| Charnwood Avenue | CM1 2TQ |
| Coval Avenue | CM1 1TF |
| Coval Lane | CM1 1TG CM1 1TQ |
| Coval Wells | CM1 1WB CM1 1WZ |
| Cromar Way | CM1 2GL CM1 2QE |
| Crompton Street | CM1 3BW CM1 3GP CM1 3GR |
| Dane Road | CM1 2SS |
| Dean Way | CM1 3DB |
| Delamere Road | CM1 2TG |
| Elgin Avenue | CM1 1TN |
| Epping Close | CM1 2TH |
| Evelyn Place | CM1 3GY CM1 3GZ |
| Exmoor Close | CM1 3DG |
| Farrow Road | CM1 3TH |
| Forest Drive | CM1 2TR CM1 2TS CM1 2TT CM1 2TU CM1 2TX CM1 2UT |
| Hainault Grove | CM1 2TP |
| Hanbury Road | CM1 3AE CM1 3DR |
| Hardy Close | CM1 1AE |
| Harewood Road | CM1 3DH CM1 3DJ CM1 3DQ |
| Hatfield Grove | CM1 3DF |
| Hawkhurst Close | CM1 2SN |
| Longacre | CM1 3BJ |
| Meteor Way | CM1 2RL |
| Milburn Crescent | CM1 3BZ CM1 3DA |
| Nabbott Road | CM1 2SW |
| Norton Road | CM1 2QP CM1 2QA |
| Parkinson Drive | CM1 3GH CM1 3GS CM1 3GU CM1 3GW |
| Priory Close | CM1 2SY |
| Prykes Drive | CM1 1TP |
| Rainsford Lane | CM1 1TH CM1 2QR CM1 2QS |
| Ravensbourne Drive | CM1 2SJ CM1 2SL |
| Robjohns Road | CM1 3AF CM1 3AG CM1 3AT CM1 3BB CM1 3DP CM1 3TF |
| Rookes Crescent | CM1 3GF CM1 3GL CM1 3GN CM1 3GG |
| Rossendale | CM1 2UA |
| Rothbury Road | CM1 3DD CM1 3DE |
| Russell Way | CM1 3AA |
| Savernake Road | CM1 2TJ CM1 2TL |
| Sherwood Drive | CM1 3DL CM1 3DN |
| St Catherines Road | CM1 2SP |
| St Peters Road | CM1 2SR |
| Stansted Close | CM1 2TW |
| Tattersall Way | CM1 3TU CM1 3UB |
| Tudor Avenue | CM1 1TE |
| Waterhouse Lane | CM1 2QT CM1 2RY CM1 2TE CM1 2TF CM1 2UD CM1 2QU |
| Waterhouse Street | CM1 2TY CM1 2TZ |
| Westway | CM1 3AR CM1 3BH CM1 3FJ |
| Widford Hall Lane | CM2 8TD |
| Widford Industrial Estate | CM1 3BY |
| Windsor Way | CM1 2TN |
| Writtle Road | CM1 3BL CM1 3BP CM1 3BS CM1 3BT CM1 3BU CM1 3BX CM1 3RW CM1 3WQ |
Transport near Waterhouse Farm
-
Chelmsford Station
-
Ingatestone Station
-
Hatfield Peverel Station
-
Billericay Station
-
Wickford Station
-
Shenfield Station
-
South Woodham Ferrers Station
-
Battlesbridge Station
-
Witham Station
-
White Notley Station
- FAQ
- Price Paid By Year
- Property Type Price
Frequently asked questions about Waterhouse Farm
What is the average price for a property for sale in Waterhouse Farm?
The average price for a property for sale in Waterhouse Farm is £338,203. This amount is 21% lower than the average price in Chelmsford. There are 1,374 property listings for sale in Waterhouse Farm.
What streets have the most expensive properties for sale in Waterhouse Farm?
The streets with the most expensive properties for sale in Waterhouse Farm are Beeches Crescent at an average of £566,375, St Peters Road at an average of £496,322 and Abbess Close at an average of £495,625.
What streets have the most affordable properties for sale in Waterhouse Farm?
The streets with the most affordable properties for sale in Waterhouse Farm are Meteor Way at an average of £158,000, Charnwood Avenue at an average of £189,750 and Evelyn Place at an average of £205,833.
Which train stations are available in or near Waterhouse Farm?
Some of the train stations available in or near Waterhouse Farm are Chelmsford, Ingatestone and Hatfield Peverel.
Property Price Paid in Waterhouse Farm by Year
The average sold property price by year was:
| Year | Average Sold Price | Price Change |
Sold Properties
|
|---|---|---|---|
| 2025 | £367,726 | 14% |
60 Properties |
| 2024 | £316,964 | -3% |
68 Properties |
| 2023 | £327,723 | -4% |
78 Properties |
| 2022 | £342,255 | 5% |
121 Properties |
| 2021 | £324,505 | -1% |
135 Properties |
| 2020 | £326,222 | 9% |
83 Properties |
| 2019 | £296,513 | -4% |
122 Properties |
| 2018 | £308,787 | 4% |
104 Properties |
| 2017 | £297,398 | -3% |
99 Properties |
| 2016 | £307,093 | 14% |
153 Properties |
| 2015 | £264,485 | 20% |
123 Properties |
| 2014 | £211,156 | 4% |
107 Properties |
| 2013 | £201,731 | 1% |
100 Properties |
| 2012 | £199,067 | 3% |
82 Properties |
| 2011 | £194,043 | -2% |
85 Properties |
| 2010 | £198,347 | 9% |
87 Properties |
| 2009 | £179,825 | -11% |
72 Properties |
| 2008 | £199,147 | - |
74 Properties |
| 2007 | £199,221 | 8% |
137 Properties |
| 2006 | £182,372 | 0,5% |
149 Properties |
| 2005 | £181,551 | 3% |
118 Properties |
| 2004 | £176,234 | 11% |
160 Properties |
| 2003 | £156,668 | 10% |
341 Properties |
| 2002 | £140,307 | 24% |
198 Properties |
| 2001 | £106,740 | 4% |
74 Properties |
| 2000 | £102,055 | 18% |
92 Properties |
| 1999 | £83,879 | 16% |
81 Properties |
| 1998 | £70,152 | 9% |
72 Properties |
| 1997 | £63,601 | 14% |
80 Properties |
| 1996 | £54,928 | -2% |
80 Properties |
| 1995 | £56,001 | - |
64 Properties |
Property Price per Property Type in Waterhouse Farm
Here you can find historic sold price data in order to help with your property search.
The average Property Paid Price for specific property types in the last three years are:
| Property Type | Average Sold Price | Sold Properties |
|---|---|---|
| Semi Detached House | £418,524.00 | 98 Semi Detached Houses |
| Detached House | £546,374.00 | 20 Detached Houses |
| Terraced House | £378,443.00 | 89 Terraced Houses |
| Flat | £208,067.00 | 120 Flats |

