
Houses for sale & to rent in Moulsham And Central, Chelmsford
House Prices in Moulsham And Central
Properties in Moulsham And Central have an average house price of £339,046.00 and had 938 Property Transactions within the last 3 years¹.
Moulsham And Central is an area in Chelmsford, Essex with 4,786 households², where the most expensive property was sold for £1,420,000.00.
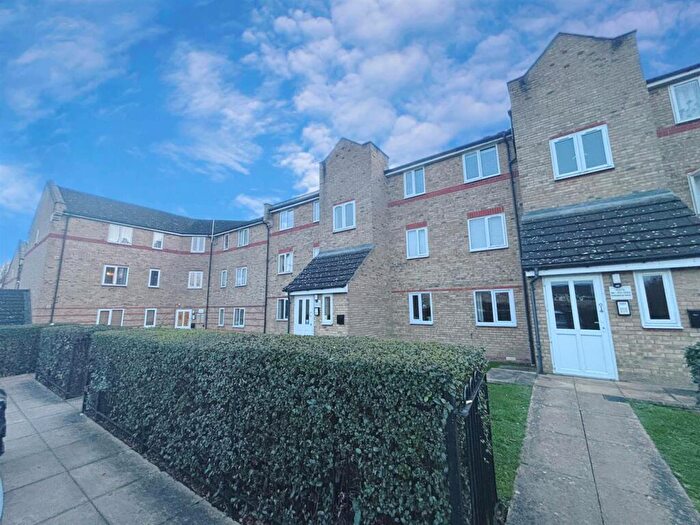
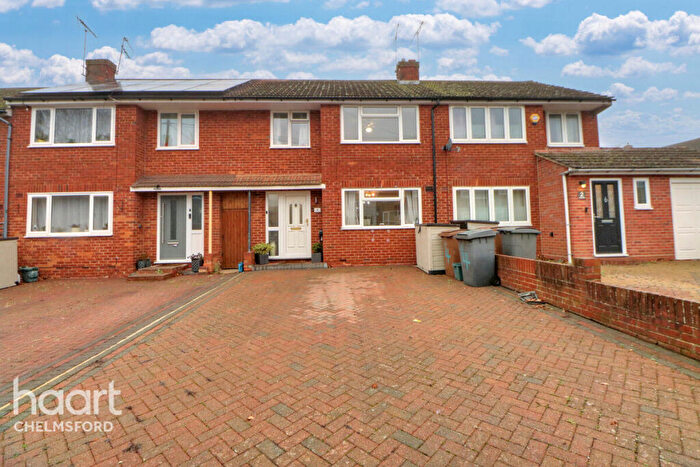
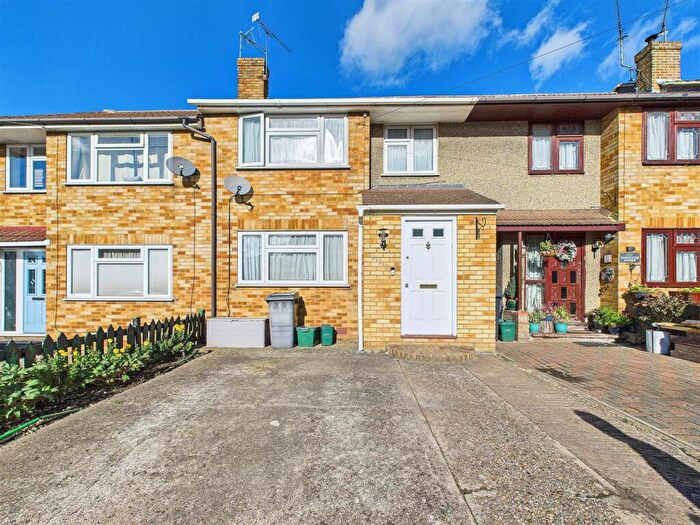
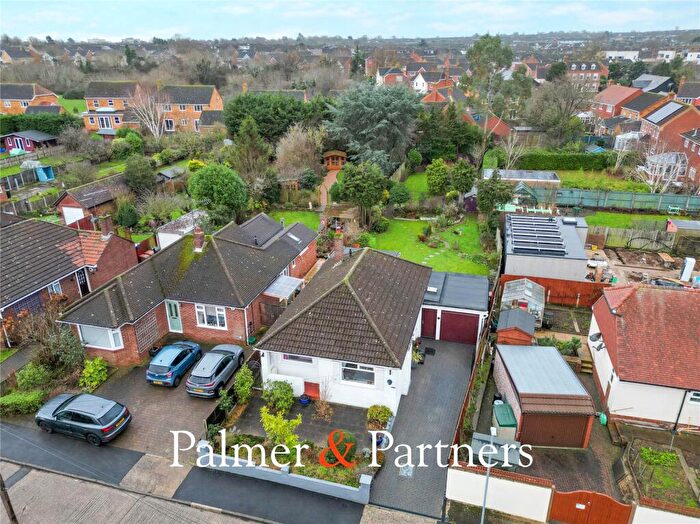
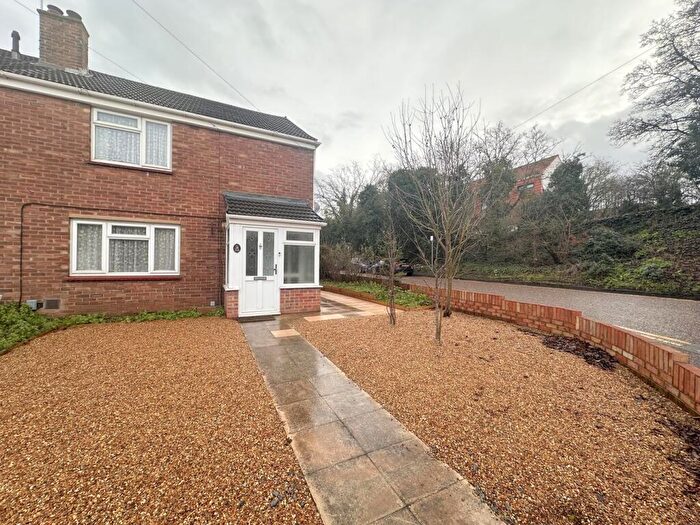
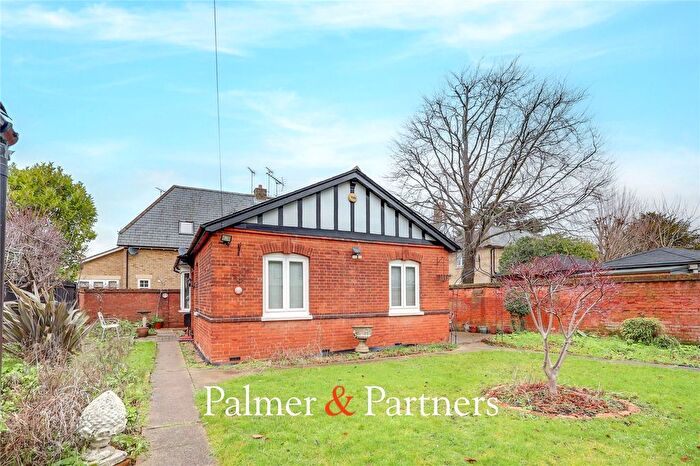
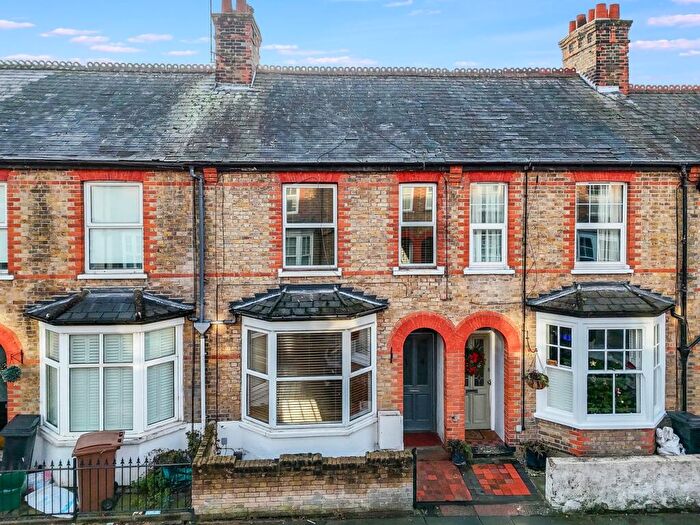
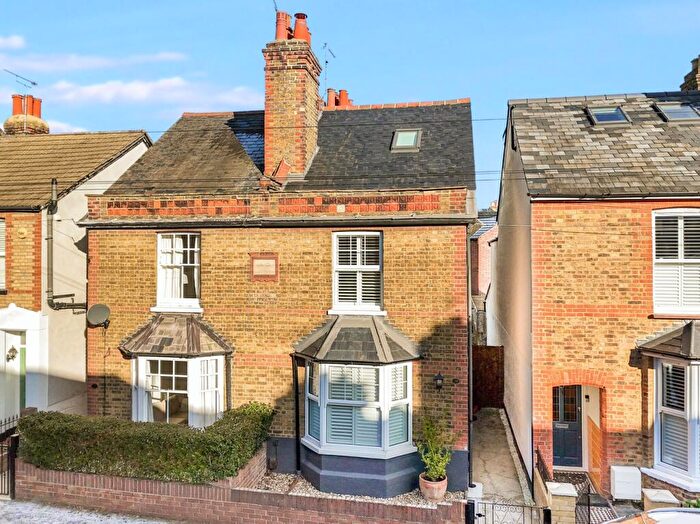
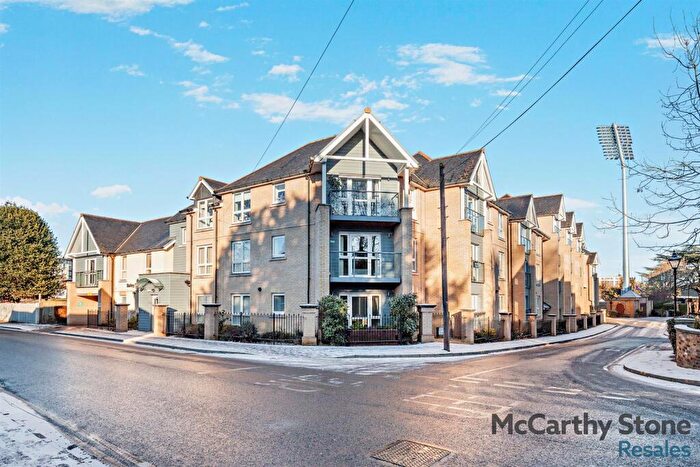
Properties for sale in Moulsham And Central
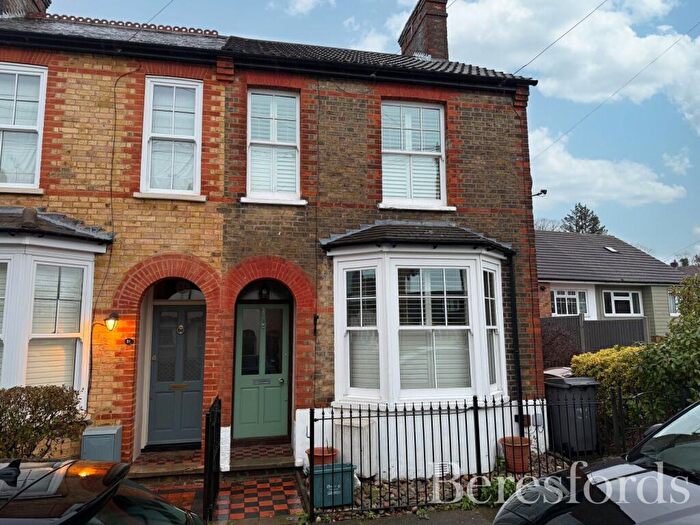
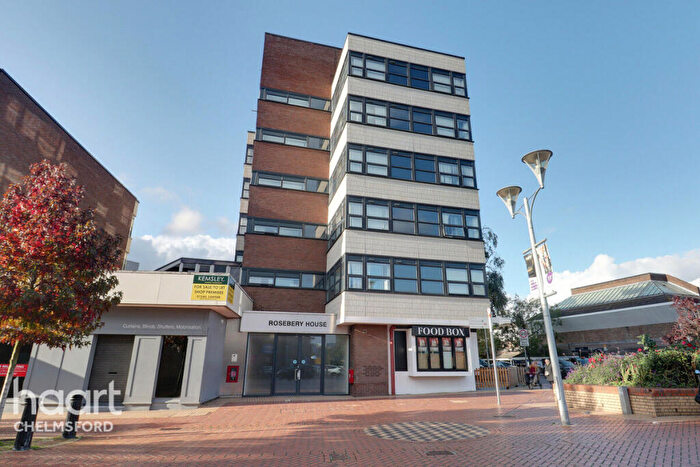
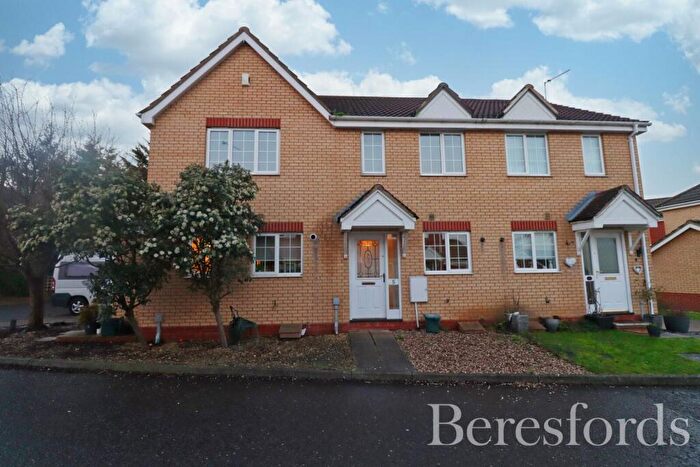
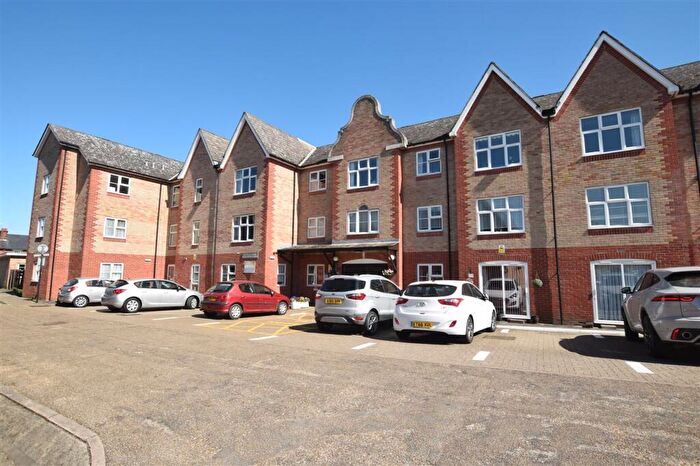
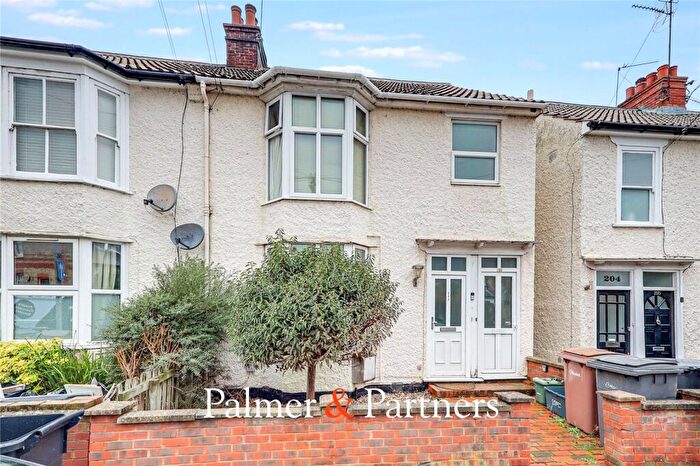
![]()
If you are looking to sell your house, let it out, or receive a property valuation, an expert can help you.
Click the button below to get started.


Roads and Postcodes in Moulsham And Central
Navigate through our locations to find the location of your next house in Moulsham And Central, Chelmsford for sale or to rent.
Transport near Moulsham And Central
-
 Chelmsford Station
 -
Ingatestone Station
-
Hatfield Peverel Station
-
Billericay Station
-
South Woodham Ferrers Station
-
Wickford Station
-
Battlesbridge Station
-
Witham Station
-
 Shenfield Station
 -
White Notley Station
- FAQ
- Price Paid By Year
- Property Type Price
Frequently asked questions about Moulsham And Central
What is the average price for a property for sale in Moulsham And Central?
The average price for a property for sale in Moulsham And Central is £339,046. This amount is 21% lower than the average price in Chelmsford. There are 3,287 property listings for sale in Moulsham And Central.
What streets have the most expensive properties for sale in Moulsham And Central?
The streets with the most expensive properties for sale in Moulsham And Central are York Road at an average of £787,500, Finchley Avenue at an average of £775,000 and Braemar Avenue at an average of £690,000.
What streets have the most affordable properties for sale in Moulsham And Central?
The streets with the most affordable properties for sale in Moulsham And Central are Victoria Road at an average of £128,730, Albion Court at an average of £129,214 and Perrin Place at an average of £138,333.
Which train stations are available in or near Moulsham And Central?
Some of the train stations available in or near Moulsham And Central are Chelmsford, Ingatestone and Hatfield Peverel.
Property Price Paid in Moulsham And Central by Year
The average sold property price by year was:
| Year | Average Sold Price | Price Change |
Sold Properties
|
|---|---|---|---|
| 2025 | £351,096 | 5% |
164 Properties |
| 2024 | £333,651 | 0,1% |
247 Properties |
| 2023 | £333,333 | -2% |
234 Properties |
| 2022 | £341,411 | -3% |
293 Properties |
| 2021 | £351,845 | 4% |
319 Properties |
| 2020 | £336,708 | 13% |
206 Properties |
| 2019 | £292,119 | -2% |
266 Properties |
| 2018 | £297,454 | 6% |
342 Properties |
| 2017 | £279,689 | -2% |
408 Properties |
| 2016 | £284,762 | 12% |
405 Properties |
| 2015 | £250,540 | 2% |
356 Properties |
| 2014 | £246,098 | 10% |
365 Properties |
| 2013 | £222,156 | -2% |
301 Properties |
| 2012 | £226,481 | 2% |
240 Properties |
| 2011 | £221,945 | 1% |
224 Properties |
| 2010 | £220,439 | 6% |
234 Properties |
| 2009 | £206,194 | -7% |
207 Properties |
| 2008 | £220,637 | -1% |
207 Properties |
| 2007 | £222,633 | 8% |
398 Properties |
| 2006 | £205,384 | 4% |
402 Properties |
| 2005 | £198,053 | -0,3% |
355 Properties |
| 2004 | £198,687 | 6% |
404 Properties |
| 2003 | £187,651 | 22% |
379 Properties |
| 2002 | £145,506 | 16% |
415 Properties |
| 2001 | £121,865 | 19% |
399 Properties |
| 2000 | £98,689 | 11% |
329 Properties |
| 1999 | £87,817 | 9% |
488 Properties |
| 1998 | £80,280 | 16% |
396 Properties |
| 1997 | £67,461 | 18% |
377 Properties |
| 1996 | £55,078 | 2% |
341 Properties |
| 1995 | £54,112 | - |
250 Properties |
Property Price per Property Type in Moulsham And Central
Here you can find historic sold price data in order to help with your property search.
The average Property Paid Price for specific property types in the last three years are:
| Property Type | Average Sold Price | Sold Properties |
|---|---|---|
| Semi Detached House | £514,071.00 | 163 Semi Detached Houses |
| Detached House | £648,023.00 | 66 Detached Houses |
| Terraced House | £394,465.00 | 174 Terraced Houses |
| Flat | £229,579.00 | 535 Flats |