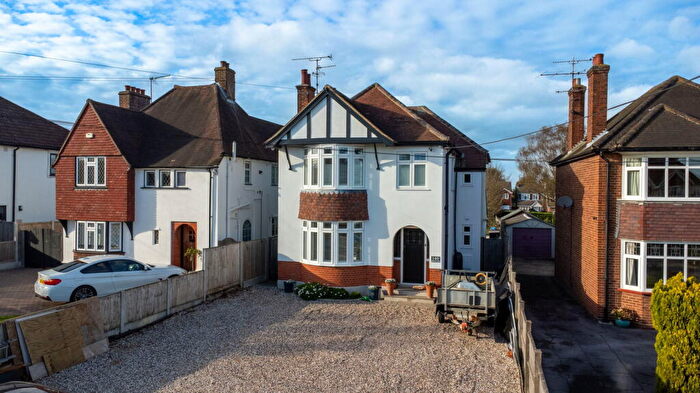
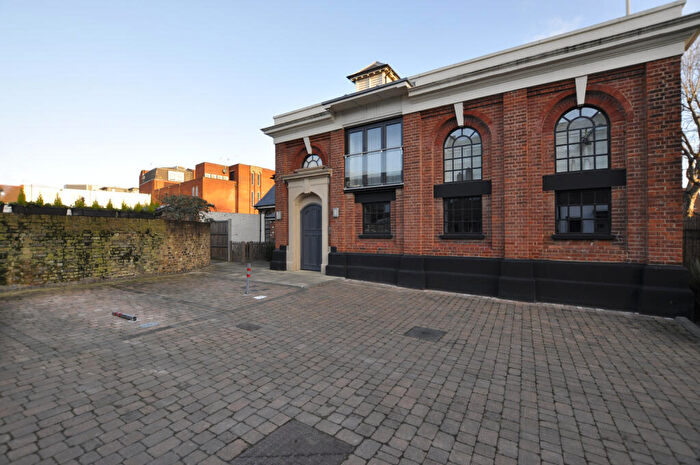
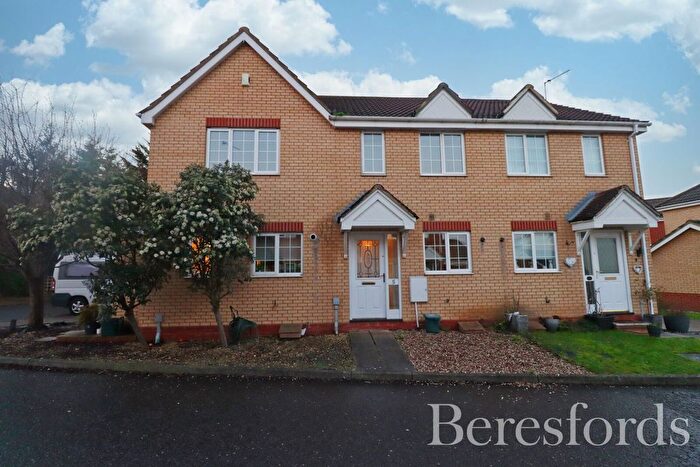
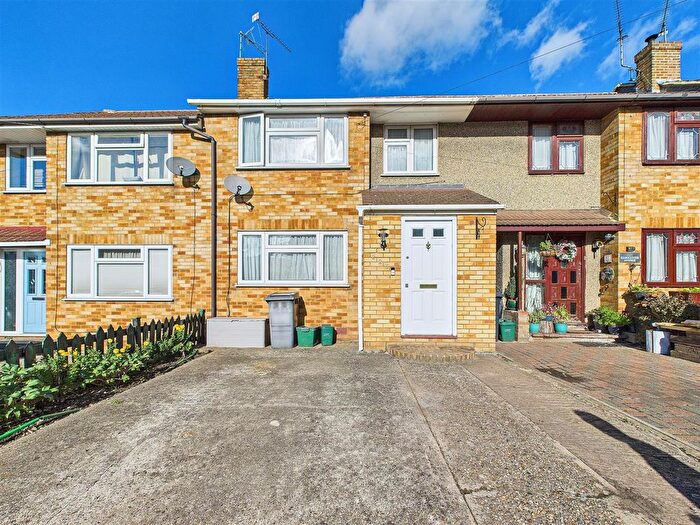
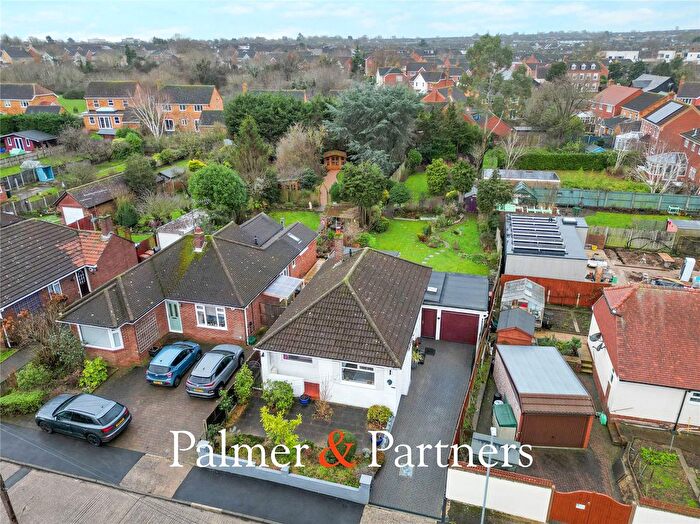
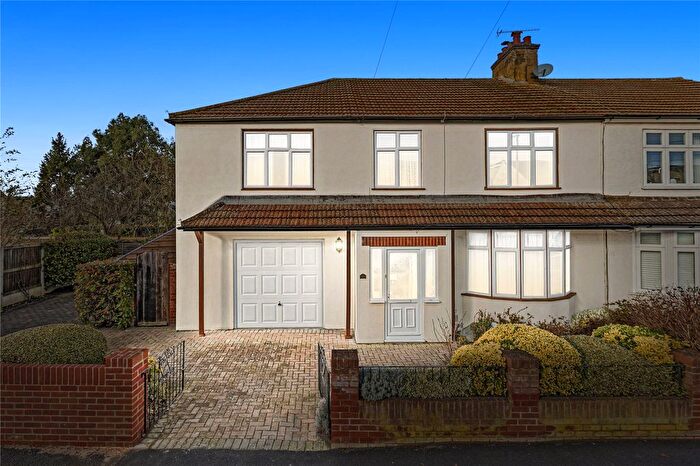
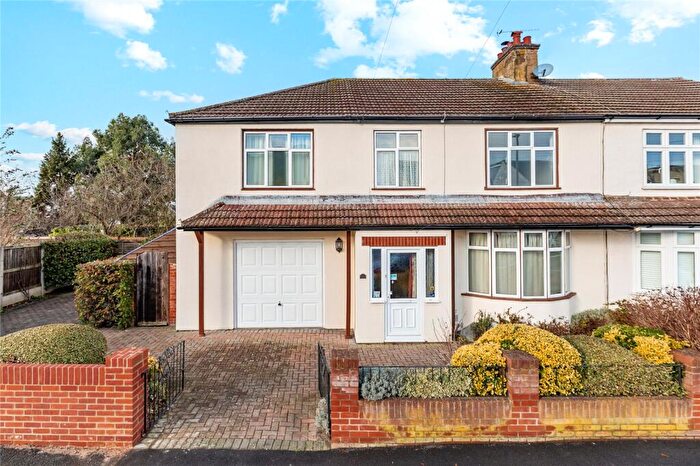
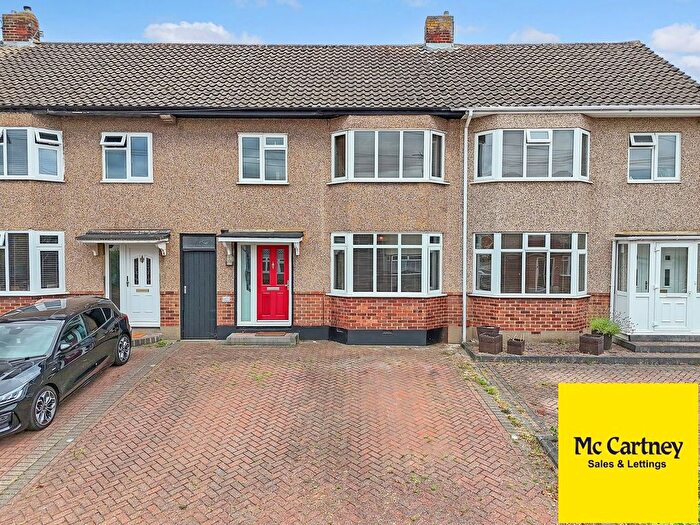
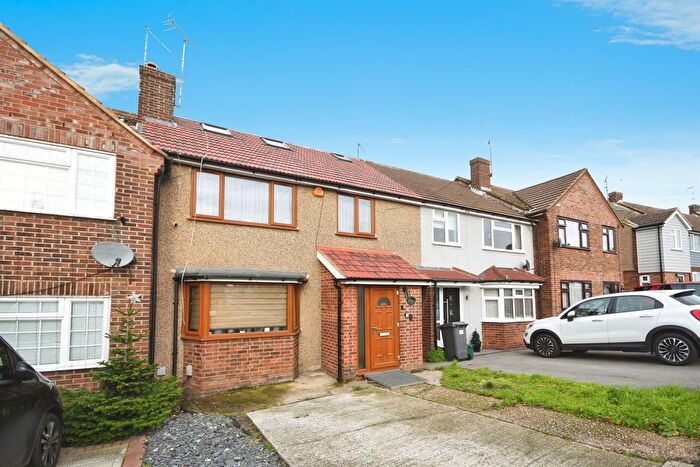
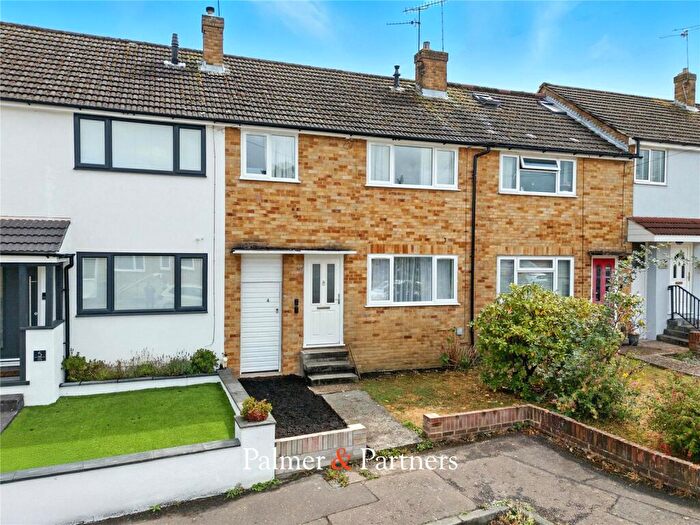
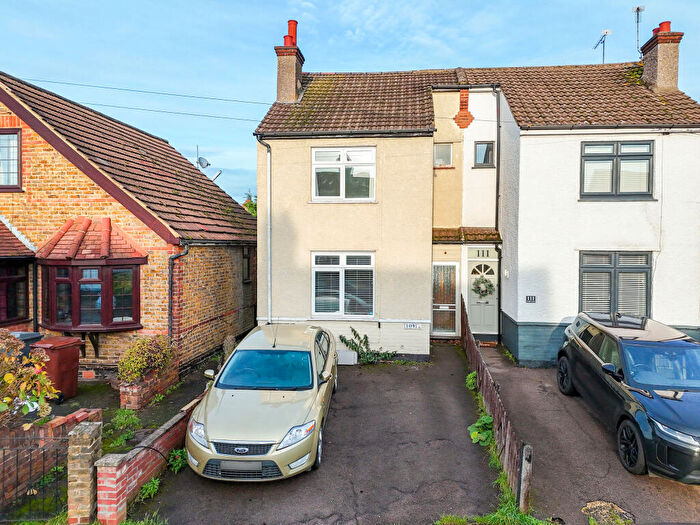
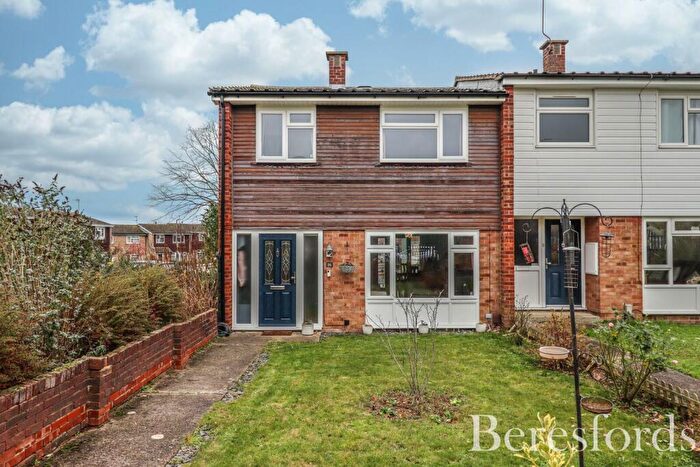
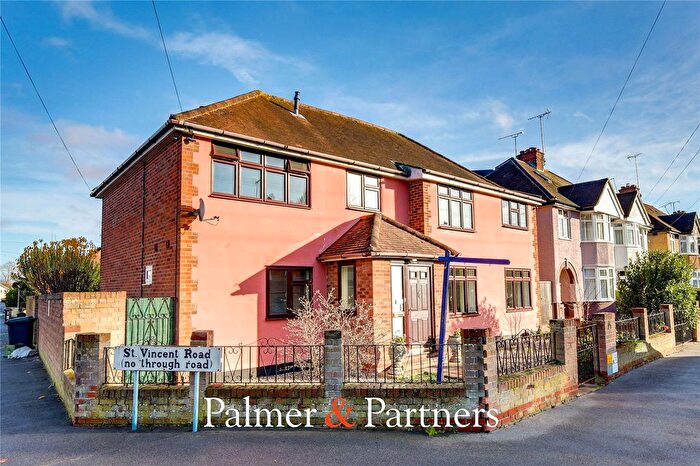
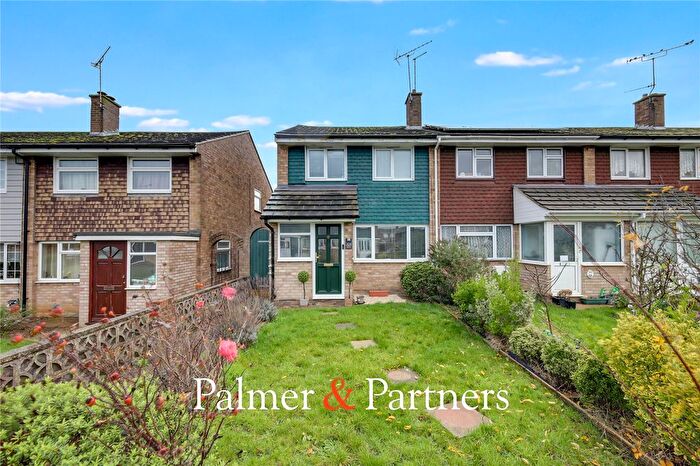
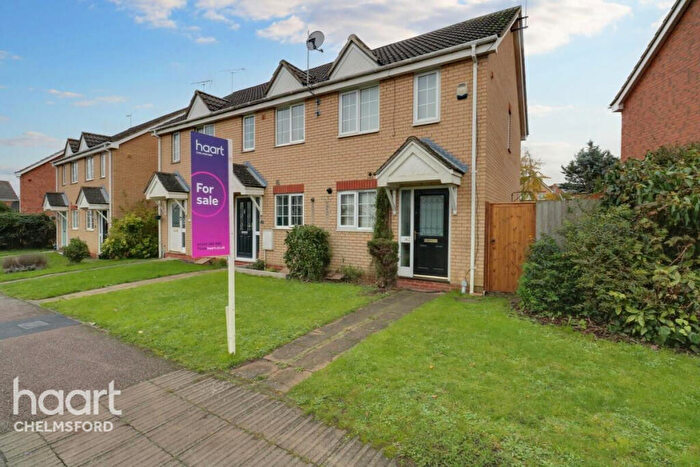
Houses for sale & to rent in Moulsham Lodge, Chelmsford
House Prices in Moulsham Lodge
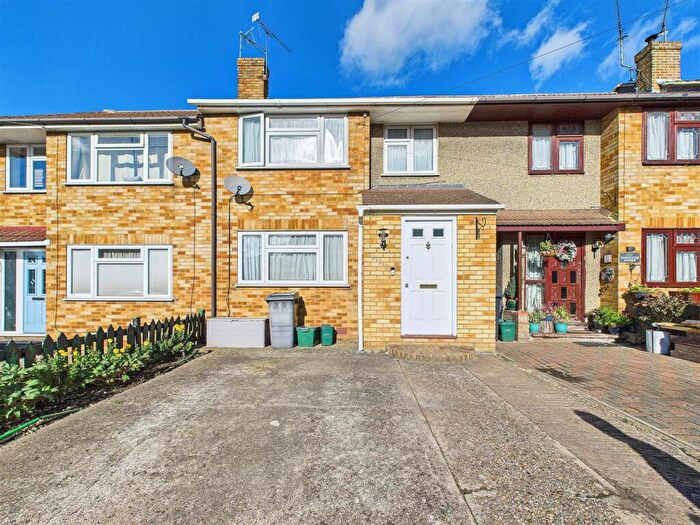
Properties in Moulsham Lodge have an average house price of £400,528.00 and had 266 Property Transactions within the last 3 years¹.
Moulsham Lodge is an area in Chelmsford, Essex with 2,187 households², where the most expensive property was sold for £1,351,000.00.
Properties for sale in Moulsham Lodge
Roads and Postcodes in Moulsham Lodge
Navigate through our locations to find the location of your next house in Moulsham Lodge, Chelmsford for sale or to rent.
| Streets | Postcodes |
|---|---|
| Alder Drive | CM2 9EY CM2 9EZ |
| Arbutus Close | CM2 9HW |
| Ash Grove | CM2 9JS CM2 9JT |
| Brian Close | CM2 9DZ CM2 9EA CM2 9EB CM2 9ES |
| Burghley Way | CM2 9LQ CM2 9LR |
| Chislett Row | CM2 9QS |
| Crossways | CM2 9EP |
| Cypress Drive | CM2 9LT CM2 9LU |
| Donald Way | CM2 9JB CM2 9JD CM2 9JE |
| Edward Drive | CM2 9ER |
| Firtree Rise | CM2 9HS |
| Gloucester Avenue | CM2 9DP CM2 9DR CM2 9DS CM2 9DT CM2 9DU CM2 9DX CM2 9LD CM2 9LE CM2 9LF CM2 9LG CM2 9LH CM2 9LJ |
| Gordon Road | CM2 9LL CM2 9LN |
| Gunson Gate | CM2 9NZ |
| Hawthorn Close | CM2 9NP CM2 9NW |
| Heath Drive | CM2 9HA CM2 9HB CM2 9HD CM2 9HE CM2 9HF CM2 9HG CM2 9HH CM2 9HQ |
| Holly Way | CM2 9JU |
| Hornbeam Close | CM2 9LW |
| Juniper Drive | CM2 9HL CM2 9HN |
| Laburnum Drive | CM2 9NR CM2 9NT CM2 9NU CM2 9NX CM2 9NS |
| Larch Grove | CM2 9LX CM2 9LY |
| Lewis Drive | CM2 9EE CM2 9EF |
| Lilac Close | CM2 9NY |
| Lime Walk | CM2 9NF CM2 9NG CM2 9NH CM2 9NJ CM2 9NQ |
| Linden Close | CM2 9JH CM2 9JQ |
| Lister Tye | CM2 9LS |
| Longstomps Avenue | CM2 9BY CM2 9BZ CM2 9LA CM2 9LB |
| Lucas Avenue | CM2 9JJ CM2 9JL CM2 9JN CM2 9JP CM2 9JR CM2 9JW |
| Magnolia Close | CM2 9HU |
| Maple Drive | CM2 9HP CM2 9HR |
| May Walk | CM2 9EW |
| Moss Walk | CM2 9ED |
| Moulsham Barn | CM2 9QE |
| Orange Tree Close | CM2 9ND CM2 9NE |
| Palm Close | CM2 9NL CM2 9NN |
| Plane Tree Close | CM2 9HT |
| Poplar Close | CM2 9NB |
| Princes Road | CM2 9DE CM2 9DG |
| Rose Glen | CM2 9EN |
| St Anthonys Drive | CM2 9EG CM2 9EH CM2 9EJ CM2 9EQ |
| Sycamore Way | CM2 9LZ CM2 9NA |
| Sylvan Close | CM2 9HJ |
| Tylers Close | CM2 9DY |
| Waltham Glen | CM2 9EL |
| Waterson Vale | CM2 9PB |
| Whitethorn Gardens | CM2 9JG |
| Whitfield Link | CM2 9QF |
| Yewtree Gardens | CM2 9JF |
Transport near Moulsham Lodge
-
Chelmsford Station
-
Ingatestone Station
-
Billericay Station
-
Hatfield Peverel Station
-
Wickford Station
-
South Woodham Ferrers Station
-
Battlesbridge Station
-
Shenfield Station
-
Witham Station
-
White Notley Station
- FAQ
- Price Paid By Year
- Property Type Price
Frequently asked questions about Moulsham Lodge
What is the average price for a property for sale in Moulsham Lodge?
The average price for a property for sale in Moulsham Lodge is £400,528. This amount is 6% lower than the average price in Chelmsford. There are 1,814 property listings for sale in Moulsham Lodge.
What streets have the most expensive properties for sale in Moulsham Lodge?
The streets with the most expensive properties for sale in Moulsham Lodge are Longstomps Avenue at an average of £812,620, Hornbeam Close at an average of £685,000 and Lister Tye at an average of £632,500.
What streets have the most affordable properties for sale in Moulsham Lodge?
The streets with the most affordable properties for sale in Moulsham Lodge are Burghley Way at an average of £255,041, Orange Tree Close at an average of £332,750 and Waterson Vale at an average of £334,111.
Which train stations are available in or near Moulsham Lodge?
Some of the train stations available in or near Moulsham Lodge are Chelmsford, Ingatestone and Billericay.
Property Price Paid in Moulsham Lodge by Year
The average sold property price by year was:
| Year | Average Sold Price | Price Change |
Sold Properties
|
|---|---|---|---|
| 2025 | £395,900 | -2% |
50 Properties |
| 2024 | £404,178 | 3% |
63 Properties |
| 2023 | £390,551 | -5% |
79 Properties |
| 2022 | £411,197 | 8% |
74 Properties |
| 2021 | £378,329 | -2% |
117 Properties |
| 2020 | £386,057 | 5% |
69 Properties |
| 2019 | £366,035 | 9% |
81 Properties |
| 2018 | £333,211 | -2% |
72 Properties |
| 2017 | £339,641 | 7% |
62 Properties |
| 2016 | £314,749 | 3% |
79 Properties |
| 2015 | £304,395 | 11% |
87 Properties |
| 2014 | £271,234 | 10% |
99 Properties |
| 2013 | £244,442 | 8% |
72 Properties |
| 2012 | £225,241 | -6% |
61 Properties |
| 2011 | £239,663 | 4% |
80 Properties |
| 2010 | £229,693 | 14% |
63 Properties |
| 2009 | £198,412 | -19% |
54 Properties |
| 2008 | £236,957 | 1% |
47 Properties |
| 2007 | £235,230 | 13% |
126 Properties |
| 2006 | £204,182 | - |
124 Properties |
| 2005 | £204,140 | 5% |
78 Properties |
| 2004 | £192,926 | 11% |
90 Properties |
| 2003 | £172,244 | 14% |
84 Properties |
| 2002 | £147,477 | 11% |
97 Properties |
| 2001 | £130,947 | 2% |
112 Properties |
| 2000 | £128,148 | 8% |
142 Properties |
| 1999 | £117,629 | 28% |
138 Properties |
| 1998 | £84,847 | 20% |
68 Properties |
| 1997 | £67,594 | 9% |
83 Properties |
| 1996 | £61,550 | 2% |
78 Properties |
| 1995 | £60,624 | - |
75 Properties |
Property Price per Property Type in Moulsham Lodge
Here you can find historic sold price data in order to help with your property search.
The average Property Paid Price for specific property types in the last three years are:
| Property Type | Average Sold Price | Sold Properties |
|---|---|---|
| Semi Detached House | £431,684.00 | 103 Semi Detached Houses |
| Detached House | £668,941.00 | 17 Detached Houses |
| Terraced House | £362,933.00 | 128 Terraced Houses |
| Flat | £236,083.00 | 18 Flats |

