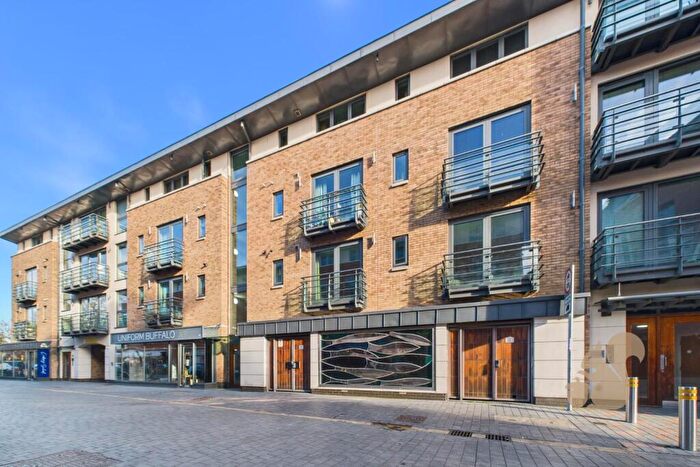
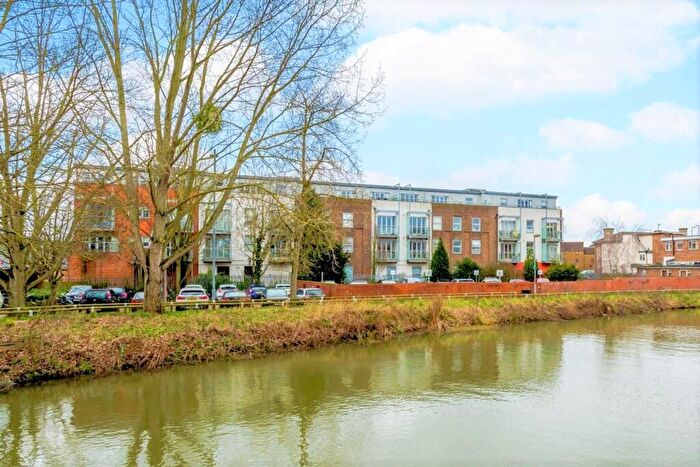
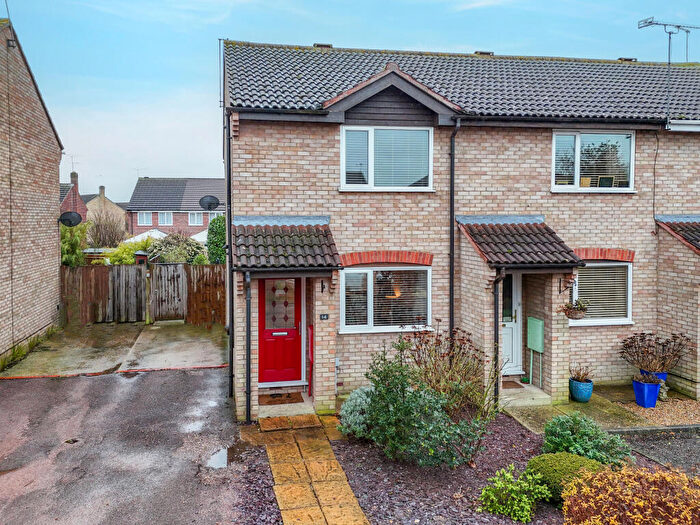
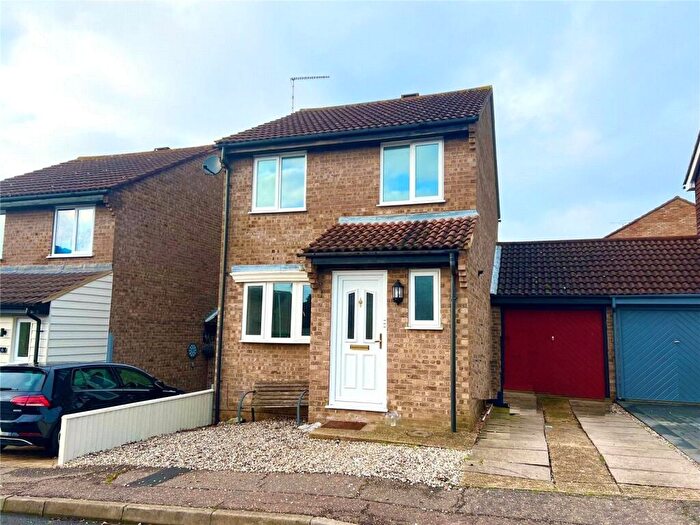
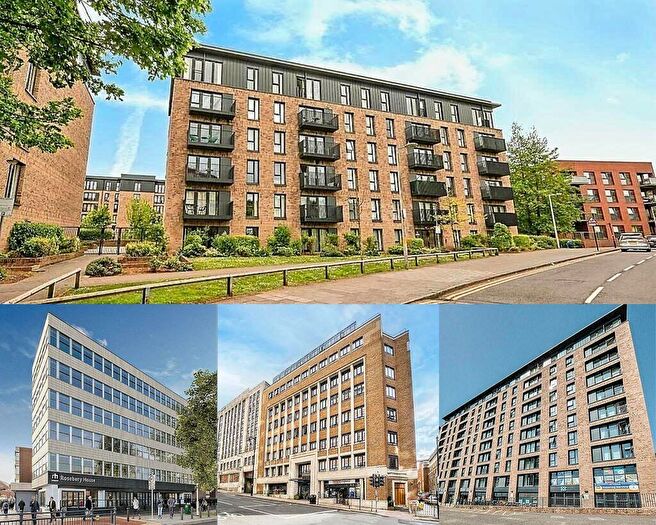
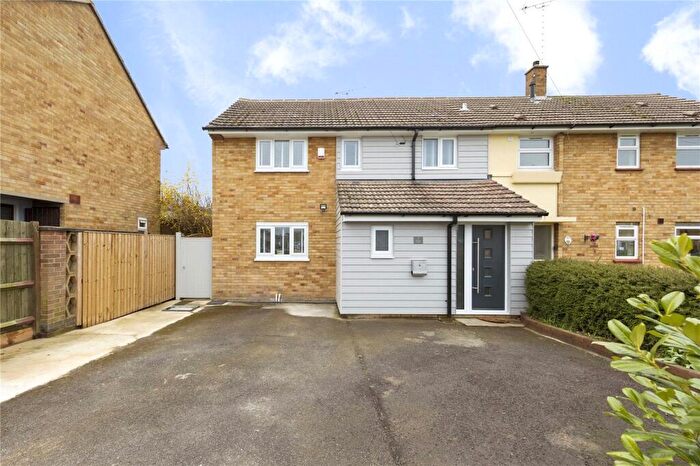
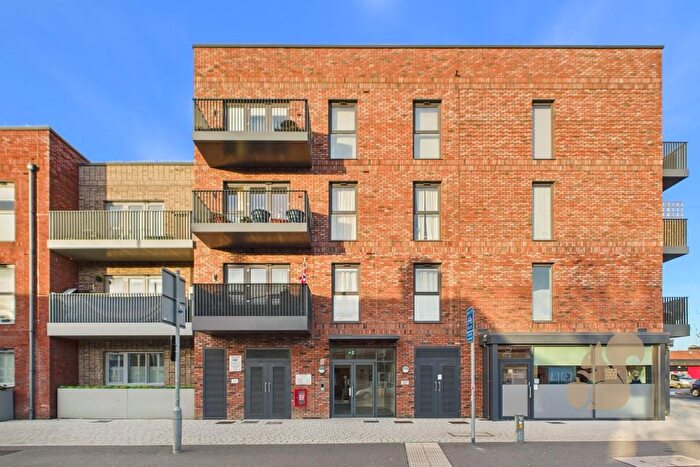
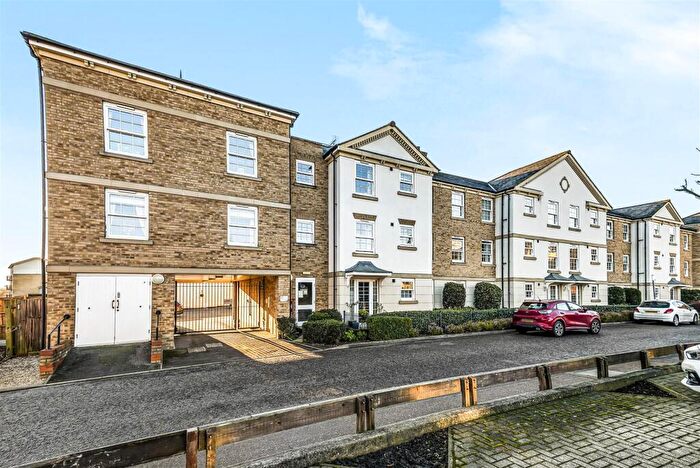
Houses for sale & to rent in Trinity, Chelmsford
House Prices in Trinity
Properties in Trinity have an average house price of £426,827.00 and had 236 Property Transactions within the last 3 years¹.
Trinity is an area in Chelmsford, Essex with 2,483 households², where the most expensive property was sold for £1,645,000.00.
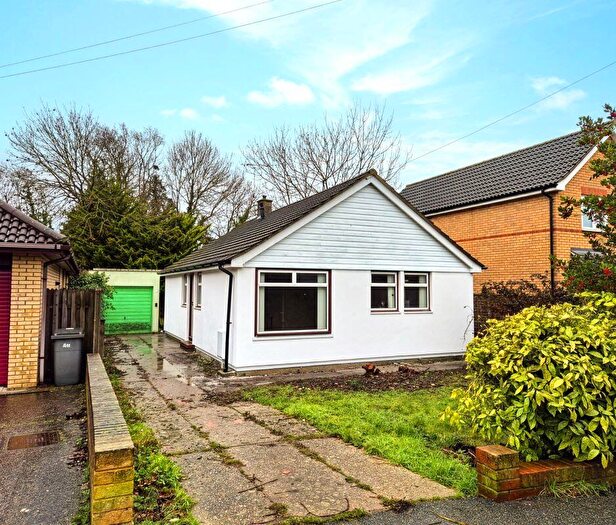
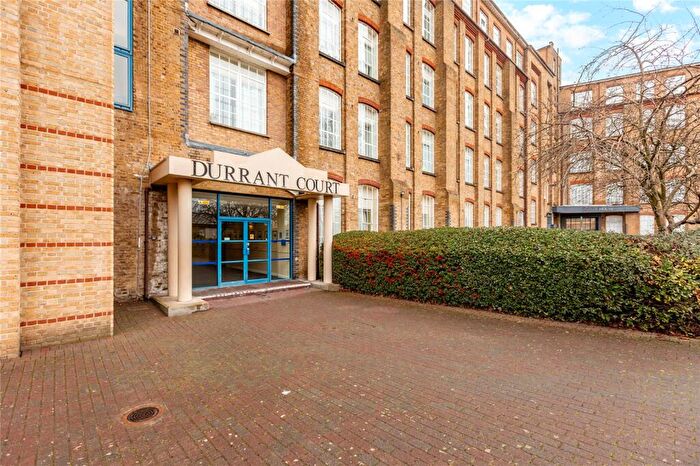
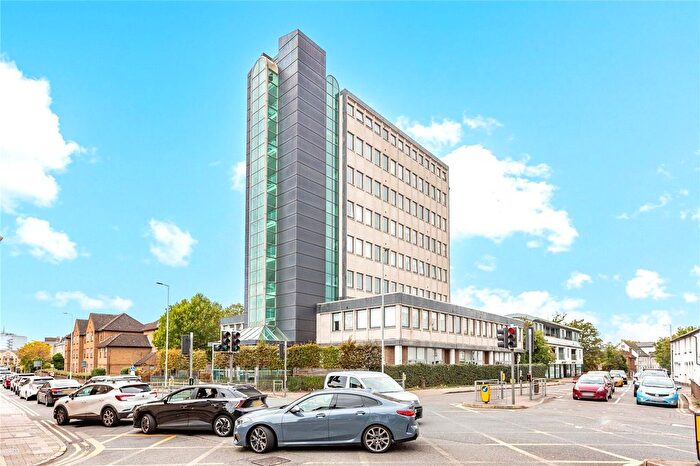
Properties for sale in Trinity
Roads and Postcodes in Trinity
Navigate through our locations to find the location of your next house in Trinity, Chelmsford for sale or to rent.
| Streets | Postcodes |
|---|---|
| Abbotts Place | CM2 6RD |
| All Saints Close | CM1 7HT |
| Arbour Lane | CM1 7RG CM1 7RL CM1 7UF CM1 7PL |
| Belgrave Place | CM2 6FR |
| Bishops Court Gardens | CM2 6AZ |
| Brookhurst Close | CM2 6DX |
| Byron Road | CM2 6EP CM2 6HH CM2 6HJ |
| Byron View | CM2 6ZN |
| Cavendish Gardens | CM2 6BB |
| Chaucer Road | CM2 6HL |
| Chelmer Road | CM2 6AA CM2 6DG CM2 6DY CM2 6NH CM2 6DZ |
| Chichester Drive | CM1 7RY CM1 7SA |
| Chinery Close | CM1 7QY |
| Cobbs Place | CM1 7PH |
| Coppins Close | CM2 6AY |
| Dalrymple Close | CM1 7RF |
| Gainsborough Crescent | CM2 6DJ |
| Hill Crescent | CM2 6HT |
| Hill Road | CM2 6HG CM2 6HP CM2 6HW |
| Hill View Road | CM1 7RS CM1 7RT |
| Hillview Road | CM1 7RU CM1 7RX CM1 7RZ |
| Kingston Avenue | CM2 6DP CM2 6DW |
| Kingston Crescent | CM2 6DL CM2 6DN |
| Land At The Back Of | CM2 6HA |
| Lionfield Terrace | CM1 7RH |
| Llewellyn Close | CM1 7RE |
| Morris Road | CM2 6EU |
| Mounthill Avenue | CM2 6DB |
| Navigation Road | CM2 6HD CM2 6HE CM2 6ND |
| New Court Place | CM2 6BW |
| New Court Road | CM2 6BZ |
| Oaklea Avenue | CM2 6BY |
| Oasis Court | CM2 6JU |
| Old Court Road | CM2 6LW |
| Old School Field | CM1 7HU |
| Oxford Court | CM2 6AX |
| Parklands Drive | CM1 7RJ CM1 7SP |
| Pearson Grove | CM1 7FE |
| Peel Road | CM2 6AH CM2 6AJ CM2 6AL CM2 6AQ |
| Perry Hill | CM1 7RD |
| Pynchon Mews | CM1 7SW |
| Queens Road | CM2 6HB |
| Redgates Place | CM2 6BG |
| Regency Close | CM2 6DU |
| Robert Close | CM2 6FJ |
| Ruskin Road | CM2 6HN |
| Sandford Road | CM2 6DD CM2 6DE CM2 6DF CM2 6DH CM2 6DQ CM2 6FT |
| Shelley Road | CM2 6ER CM2 6ES CM2 6ET |
| Springfield Green | CM1 7HR |
| Springfield Park Avenue | CM2 6EL CM2 6EN CM2 6EW |
| Springfield Park Hill | CM2 6EA |
| Springfield Park Lane | CM2 6EG CM2 6EH CM2 6EQ |
| Springfield Park Parade | CM2 6EF |
| Springfield Park Road | CM2 6EB CM2 6ED CM2 6EE |
| Springfield Road | CM1 7RA CM1 7RB CM2 6AN CM2 6AP CM2 6AR CM2 6AS CM2 6AT CM2 6AW CM2 6BA CM2 6BJ CM2 6BN CM2 6BP CM2 6BS CM2 6JP CM2 6JS CM2 6JT CM2 6LG CM2 6BU CM2 6LQ |
| St Annes Court | CM2 6NE |
| St Margarets Road | CM2 6DR CM2 6DS CM2 6DT |
| Telford Place | CM1 7QZ |
| The Cedars | CM2 6BL |
| The Heythrop | CM2 6BX |
| The Leys | CM2 6AU |
| Timsons Lane | CM2 6AF CM2 6AG |
| Trinity Road | CM2 6HR CM2 6HS |
| Turkey Oaks | CM1 7SR |
| Tyrells Close | CM2 6BT |
| Yarwood Road | CM2 6EJ |
Transport near Trinity
-
Chelmsford Station
-
Hatfield Peverel Station
-
Ingatestone Station
-
South Woodham Ferrers Station
-
Witham Station
-
Billericay Station
-
White Notley Station
-
Battlesbridge Station
-
Wickford Station
-
Cressing Station
- FAQ
- Price Paid By Year
- Property Type Price
Frequently asked questions about Trinity
What is the average price for a property for sale in Trinity?
The average price for a property for sale in Trinity is £426,827. This amount is 0.47% higher than the average price in Chelmsford. There are 1,885 property listings for sale in Trinity.
What streets have the most expensive properties for sale in Trinity?
The streets with the most expensive properties for sale in Trinity are Tyrells Close at an average of £934,187, Oaklea Avenue at an average of £815,000 and Redgates Place at an average of £785,500.
What streets have the most affordable properties for sale in Trinity?
The streets with the most affordable properties for sale in Trinity are Abbotts Place at an average of £211,928, Oasis Court at an average of £213,416 and Cavendish Gardens at an average of £238,529.
Which train stations are available in or near Trinity?
Some of the train stations available in or near Trinity are Chelmsford, Hatfield Peverel and Ingatestone.
Property Price Paid in Trinity by Year
The average sold property price by year was:
| Year | Average Sold Price | Price Change |
Sold Properties
|
|---|---|---|---|
| 2025 | £405,276 | -1% |
72 Properties |
| 2024 | £409,022 | -14% |
87 Properties |
| 2023 | £467,097 | -1% |
77 Properties |
| 2022 | £470,291 | 15% |
105 Properties |
| 2021 | £398,079 | -5% |
114 Properties |
| 2020 | £417,940 | 12% |
72 Properties |
| 2019 | £369,534 | -3% |
94 Properties |
| 2018 | £380,988 | 6% |
94 Properties |
| 2017 | £356,990 | 8% |
81 Properties |
| 2016 | £327,400 | 3% |
103 Properties |
| 2015 | £316,266 | 9% |
98 Properties |
| 2014 | £289,210 | 11% |
106 Properties |
| 2013 | £256,552 | -6% |
92 Properties |
| 2012 | £271,754 | 9% |
95 Properties |
| 2011 | £247,236 | -10% |
95 Properties |
| 2010 | £271,957 | 16% |
73 Properties |
| 2009 | £228,669 | 5% |
110 Properties |
| 2008 | £217,758 | -18% |
83 Properties |
| 2007 | £257,307 | 9% |
128 Properties |
| 2006 | £234,717 | 6% |
142 Properties |
| 2005 | £220,031 | 3% |
108 Properties |
| 2004 | £213,650 | 12% |
133 Properties |
| 2003 | £188,305 | 15% |
103 Properties |
| 2002 | £160,854 | 16% |
143 Properties |
| 2001 | £135,015 | 17% |
139 Properties |
| 2000 | £111,994 | 14% |
114 Properties |
| 1999 | £95,953 | 12% |
151 Properties |
| 1998 | £84,314 | 6% |
113 Properties |
| 1997 | £79,114 | 16% |
122 Properties |
| 1996 | £66,144 | 4% |
108 Properties |
| 1995 | £63,521 | - |
115 Properties |
Property Price per Property Type in Trinity
Here you can find historic sold price data in order to help with your property search.
The average Property Paid Price for specific property types in the last three years are:
| Property Type | Average Sold Price | Sold Properties |
|---|---|---|
| Semi Detached House | £424,937.00 | 88 Semi Detached Houses |
| Detached House | £777,986.00 | 36 Detached Houses |
| Terraced House | £381,563.00 | 61 Terraced Houses |
| Flat | £236,352.00 | 51 Flats |

