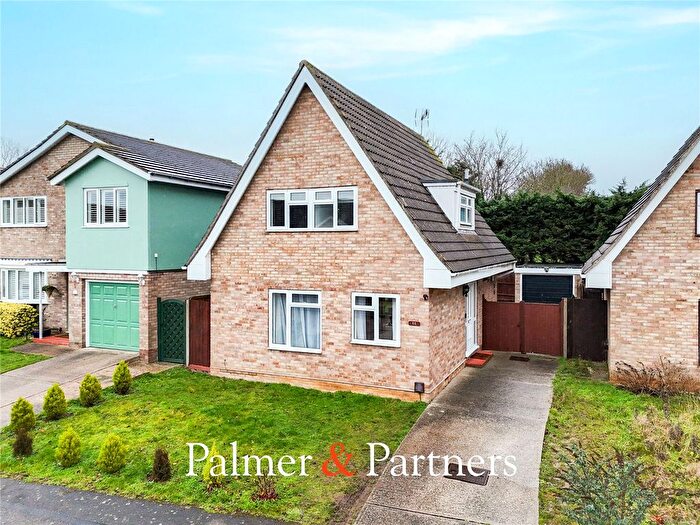
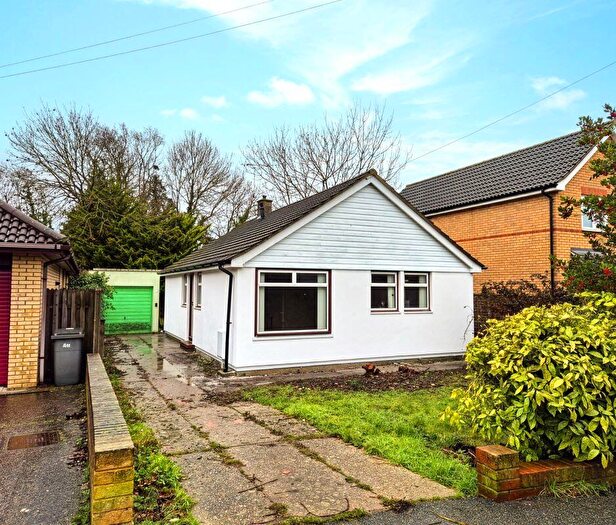
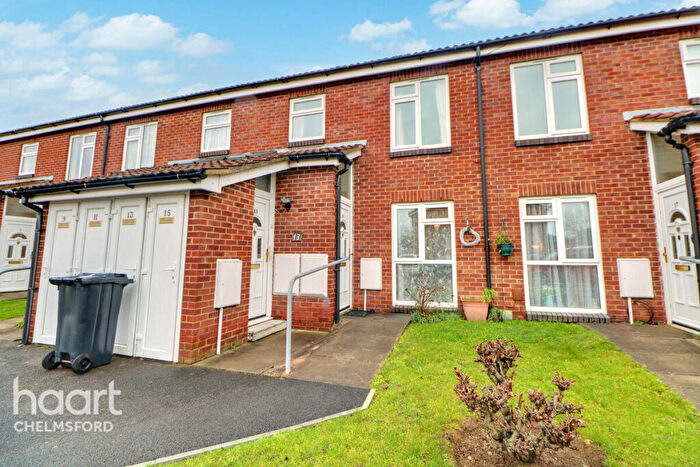
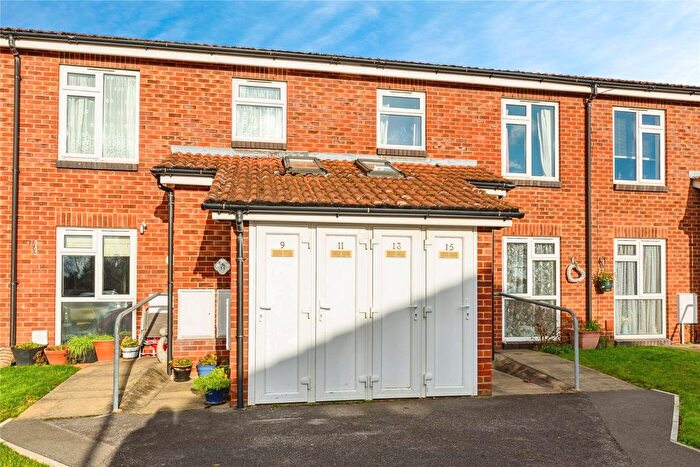
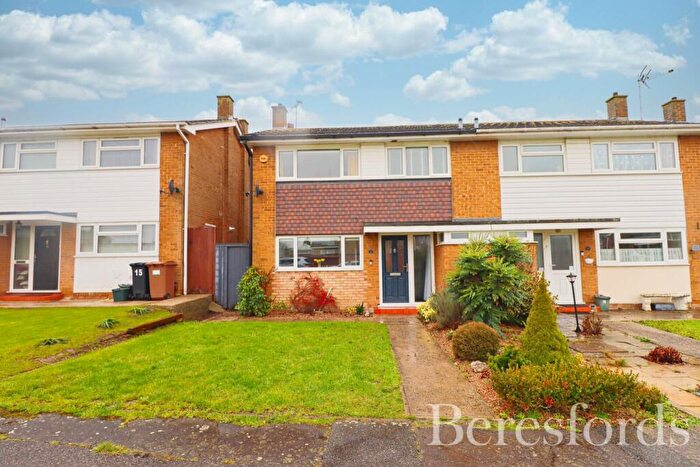
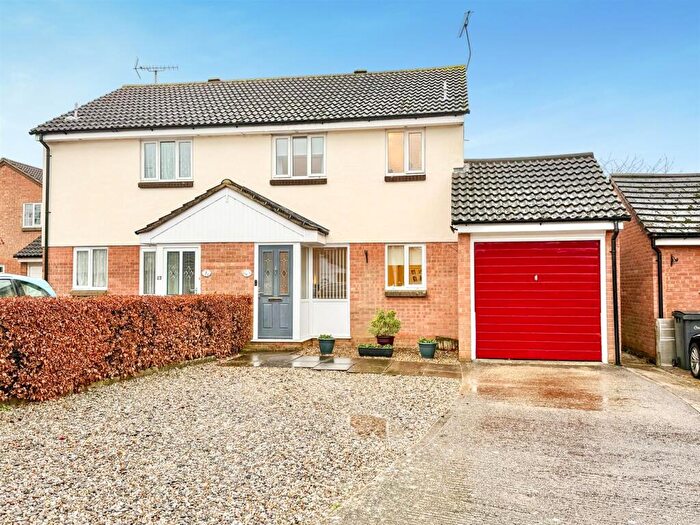
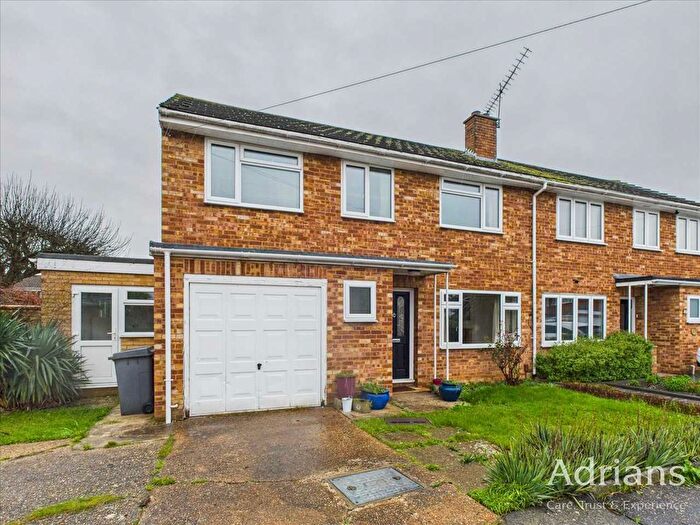
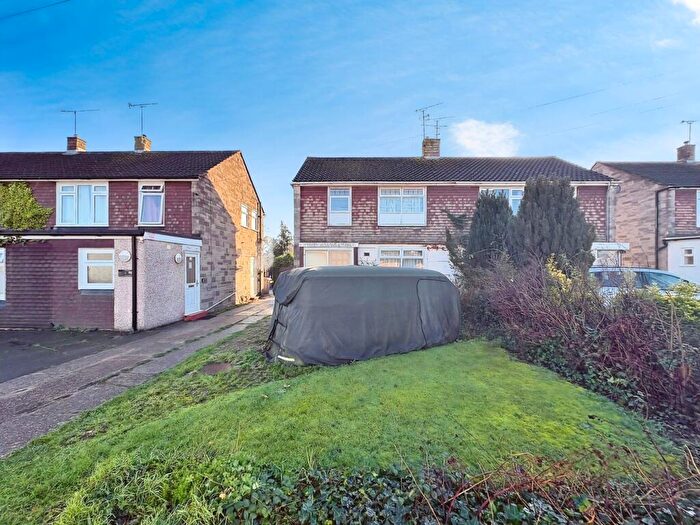
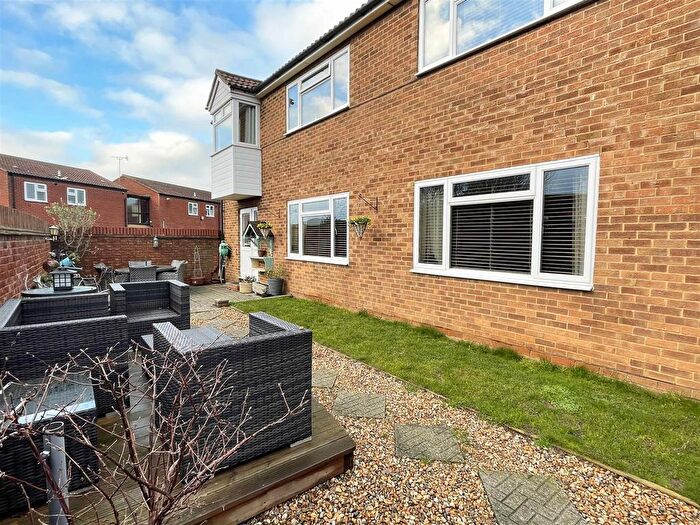
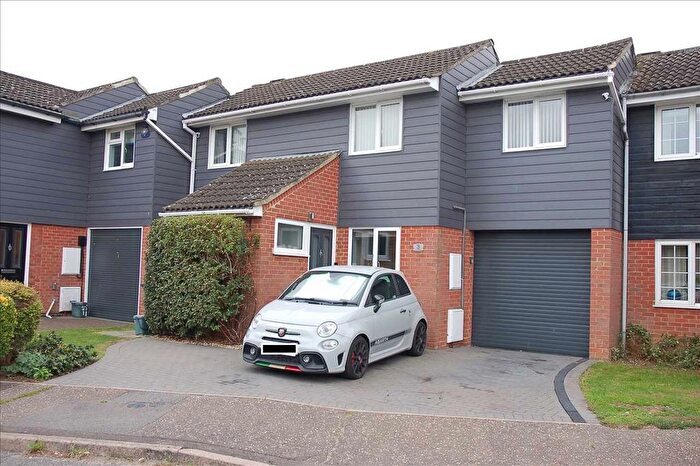
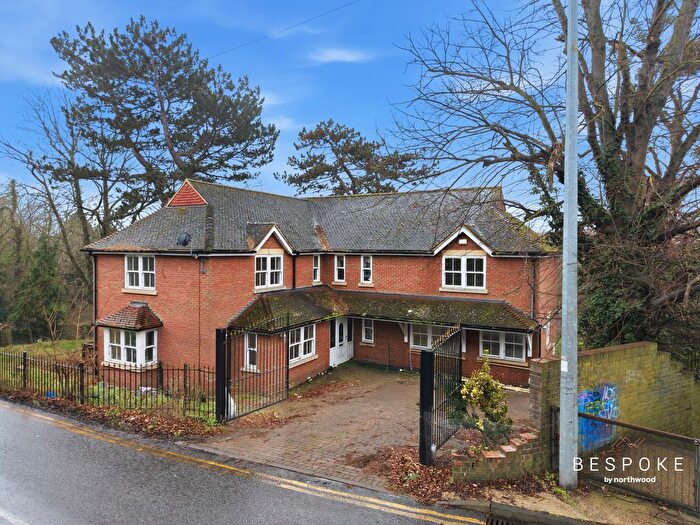
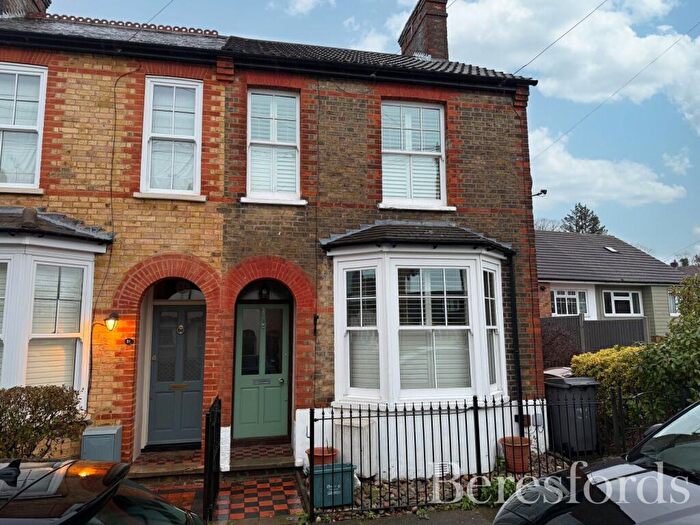
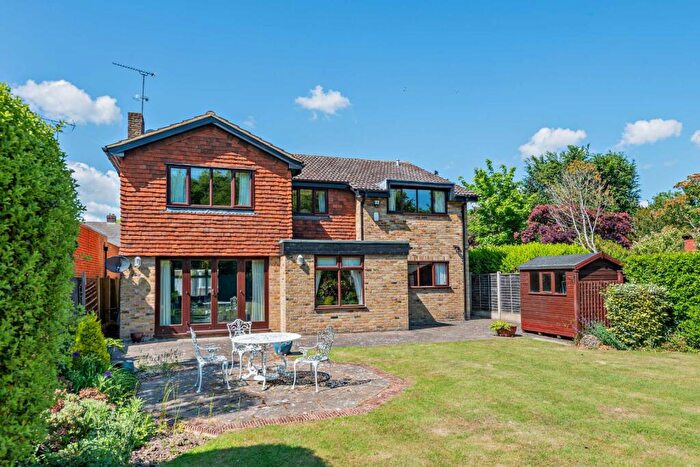
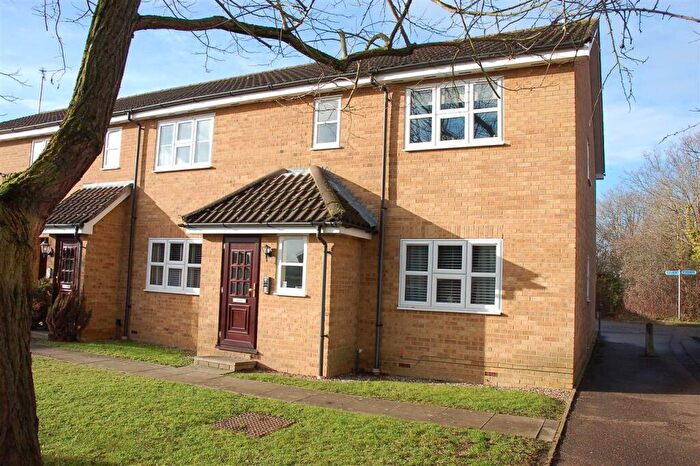
Houses for sale & to rent in The Lawns, Chelmsford
House Prices in The Lawns
Properties in The Lawns have an average house price of £430,874.00 and had 201 Property Transactions within the last 3 years¹.
The Lawns is an area in Chelmsford, Essex with 2,312 households², where the most expensive property was sold for £1,360,000.00.
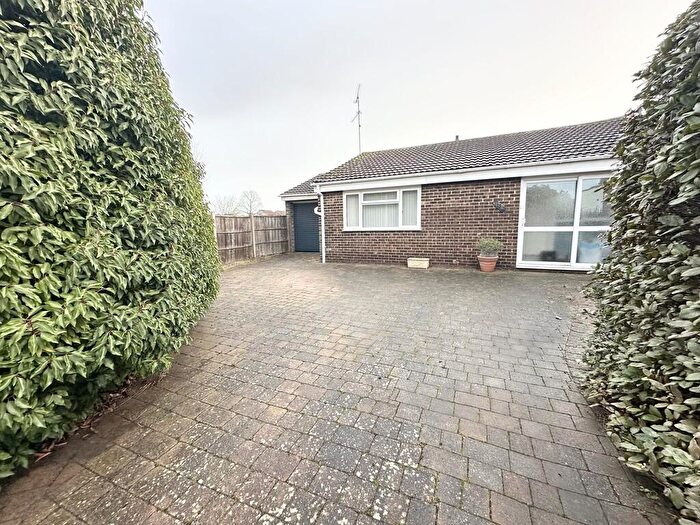
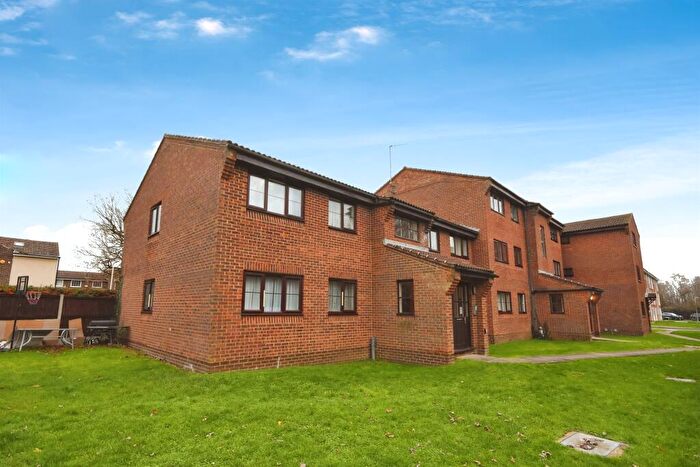
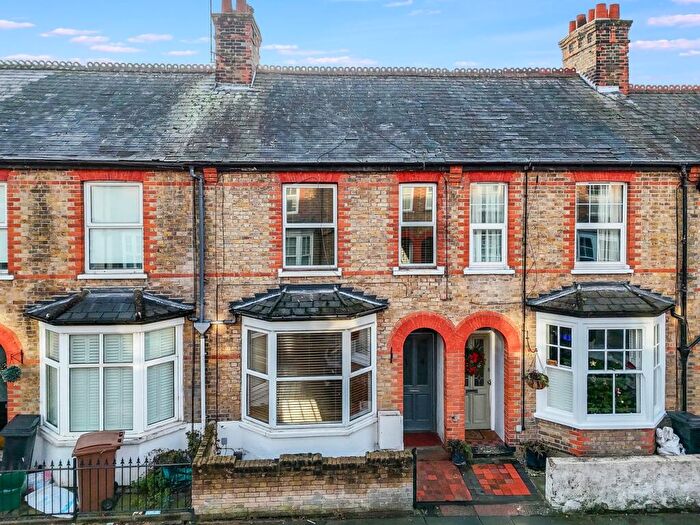
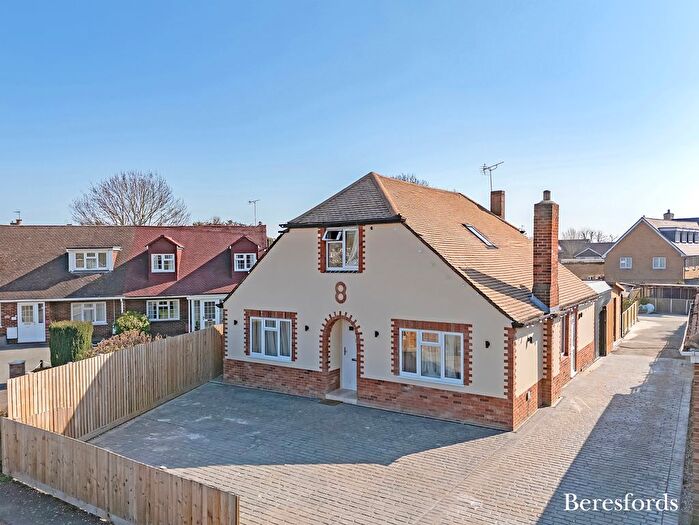
Properties for sale in The Lawns
Roads and Postcodes in The Lawns
Navigate through our locations to find the location of your next house in The Lawns, Chelmsford for sale or to rent.
| Streets | Postcodes |
|---|---|
| Acer Grove | CM1 7SZ |
| Aldeburgh Way | CM1 7PB CM1 7PD |
| Arbour Lane | CM1 7RW CM1 7SB CM1 7SD |
| Arun Close | CM1 7QE |
| Bishop Hall Lane | CM1 1RB |
| Blackwater Close | CM1 7QJ |
| Bodmin Road | CM1 6LH CM1 6LJ CM1 6LL CM1 6LN |
| Boyne Drive | CM1 7QW |
| Bridport Road | CM1 6NA CM1 6NB |
| Burnham Road | CM1 6LY CM1 6LZ |
| Camborne Close | CM1 6JD |
| Church Lane | CM1 7SF CM1 7SG CM1 7SQ |
| Dartmouth Road | CM1 6LT |
| Downsway | CM1 6TT CM1 6TU |
| Exeter Road | CM1 6HU |
| Falmouth Road | CM1 6HY CM1 6HZ CM1 6JA CM1 6JB |
| Great Cob | CM1 6LA |
| Green Close | CM1 7SL |
| Havengore | CM1 6JP CM1 6JR |
| Helston Road | CM1 6JE CM1 6JF |
| Hillary Close | CM1 7RP CM1 7RR |
| Humber Road | CM1 7PE CM1 7PF CM1 7PG |
| Lawn Lane | CM1 6NP CM1 6NR CM1 6PR CM1 6PS CM1 7PP CM1 7TJ |
| Lynton Drive | CM1 6NE |
| Meon Close | CM1 7QG CM1 7QP CM1 7QQ |
| Mulberry Way | CM1 7SN |
| Orford Crescent | CM1 7NY CM1 7NZ CM1 7PA |
| Osea Way | CM1 6JT |
| Paignton Avenue | CM1 7NS |
| Penzance Close | CM1 6JJ |
| Plymouth Road | CM1 6JG |
| Redruth Close | CM1 6JW |
| Rivermead Industrial Estate | CM1 1PD CM1 1PW |
| Rushleydale | CM1 6JX |
| Seven Ash Green | CM1 7SE |
| Sherborne Road | CM1 7NT CM1 7NU |
| Sidmouth Road | CM1 6LR CM1 6LS |
| Springfield Green | CM1 7HS CM1 7HZ |
| Springfield Place | CM1 7ZA |
| Stump Lane | CM1 7SJ |
| Swans Pasture | CM1 6AF |
| Tamar Rise | CM1 7QL CM1 7QN |
| Taunton Road | CM1 6JH CM1 6JQ |
| Tavistock Road | CM1 6JL CM1 6JN |
| Tees Road | CM1 7QH |
| The Ray | CM1 6JU |
| Torquay Road | CM1 6NF CM1 6NG CM1 7NX |
| Torrington Close | CM1 6HX |
| Totnes Walk | CM1 6LU CM1 6LX |
| Wallasea Gardens | CM1 6JY CM1 6JZ |
| Waveney Drive | CM1 7PJ CM1 7PX CM1 7PY CM1 7PZ CM1 7QA CM1 7QB CM1 7QD |
| Wear Drive | CM1 7PT CM1 7PU |
| Wells Court | CM1 6ND |
| Weymouth Road | CM1 6LP CM1 6LW |
| Windrush Drive | CM1 7QF CM1 7QR |
Transport near The Lawns
-
Chelmsford Station
-
Hatfield Peverel Station
-
Ingatestone Station
-
Witham Station
-
White Notley Station
-
Cressing Station
-
South Woodham Ferrers Station
-
Billericay Station
-
Battlesbridge Station
-
Braintree Freeport Station
- FAQ
- Price Paid By Year
- Property Type Price
Frequently asked questions about The Lawns
What is the average price for a property for sale in The Lawns?
The average price for a property for sale in The Lawns is £430,874. This amount is 1% higher than the average price in Chelmsford. There are 1,311 property listings for sale in The Lawns.
What streets have the most expensive properties for sale in The Lawns?
The streets with the most expensive properties for sale in The Lawns are Seven Ash Green at an average of £839,375, Green Close at an average of £832,500 and Torrington Close at an average of £657,125.
What streets have the most affordable properties for sale in The Lawns?
The streets with the most affordable properties for sale in The Lawns are The Ray at an average of £200,000, Windrush Drive at an average of £245,000 and Tamar Rise at an average of £268,416.
Which train stations are available in or near The Lawns?
Some of the train stations available in or near The Lawns are Chelmsford, Hatfield Peverel and Ingatestone.
Property Price Paid in The Lawns by Year
The average sold property price by year was:
| Year | Average Sold Price | Price Change |
Sold Properties
|
|---|---|---|---|
| 2025 | £437,887 | 5% |
58 Properties |
| 2024 | £417,549 | -5% |
77 Properties |
| 2023 | £440,258 | -1% |
66 Properties |
| 2022 | £446,437 | 14% |
89 Properties |
| 2021 | £382,589 | -6% |
93 Properties |
| 2020 | £406,669 | 14% |
75 Properties |
| 2019 | £350,239 | -3% |
71 Properties |
| 2018 | £360,289 | 1% |
76 Properties |
| 2017 | £358,168 | 4% |
83 Properties |
| 2016 | £343,461 | 8% |
98 Properties |
| 2015 | £316,323 | 11% |
83 Properties |
| 2014 | £281,830 | 16% |
92 Properties |
| 2013 | £238,026 | -1% |
73 Properties |
| 2012 | £239,280 | 10% |
71 Properties |
| 2011 | £216,541 | -13% |
74 Properties |
| 2010 | £244,931 | 10% |
74 Properties |
| 2009 | £220,152 | - |
76 Properties |
| 2008 | £220,105 | -6% |
64 Properties |
| 2007 | £233,622 | 15% |
89 Properties |
| 2006 | £199,393 | -3% |
112 Properties |
| 2005 | £204,842 | 6% |
91 Properties |
| 2004 | £192,985 | 10% |
101 Properties |
| 2003 | £174,534 | 15% |
89 Properties |
| 2002 | £149,159 | 14% |
106 Properties |
| 2001 | £127,951 | 12% |
109 Properties |
| 2000 | £112,372 | 13% |
126 Properties |
| 1999 | £98,064 | 12% |
115 Properties |
| 1998 | £86,095 | 10% |
100 Properties |
| 1997 | £77,268 | 8% |
94 Properties |
| 1996 | £71,141 | 9% |
107 Properties |
| 1995 | £64,889 | - |
91 Properties |
Property Price per Property Type in The Lawns
Here you can find historic sold price data in order to help with your property search.
The average Property Paid Price for specific property types in the last three years are:
| Property Type | Average Sold Price | Sold Properties |
|---|---|---|
| Semi Detached House | £405,871.00 | 79 Semi Detached Houses |
| Detached House | £619,709.00 | 55 Detached Houses |
| Terraced House | £364,675.00 | 40 Terraced Houses |
| Flat | £217,444.00 | 27 Flats |

