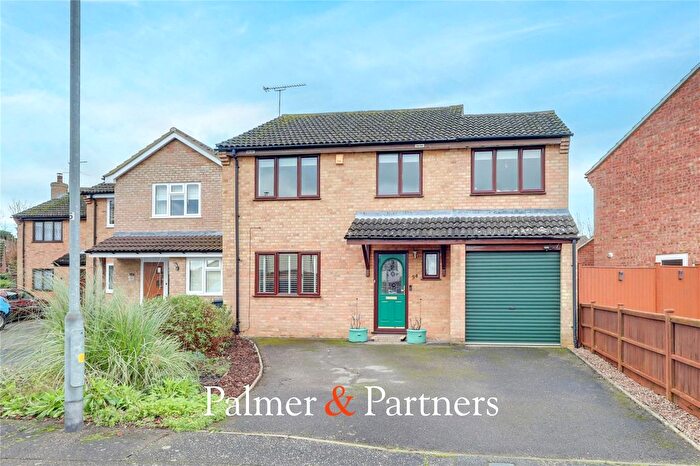
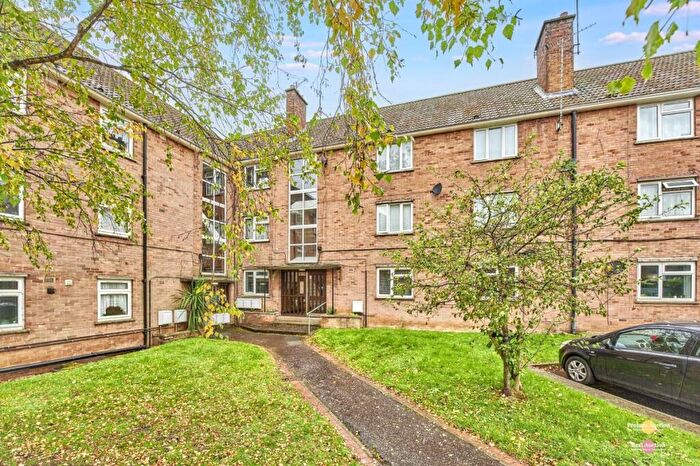
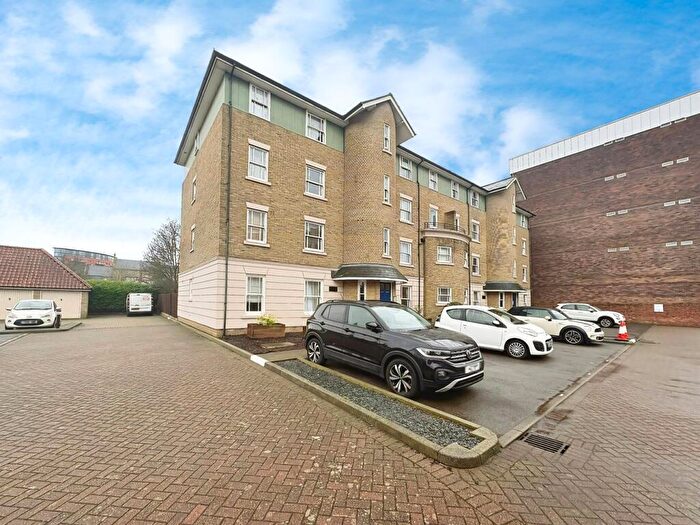
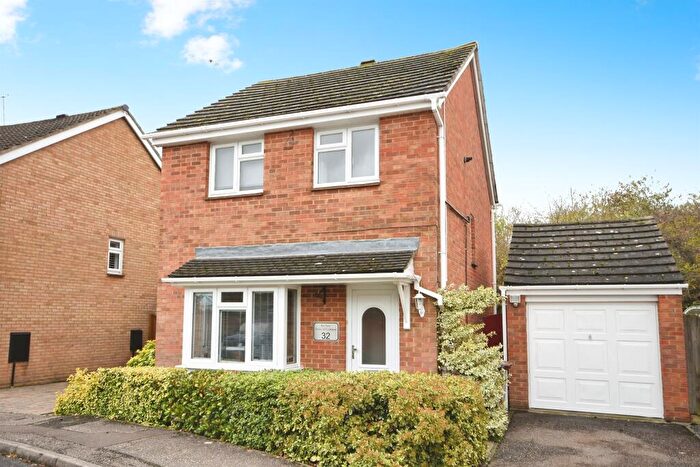
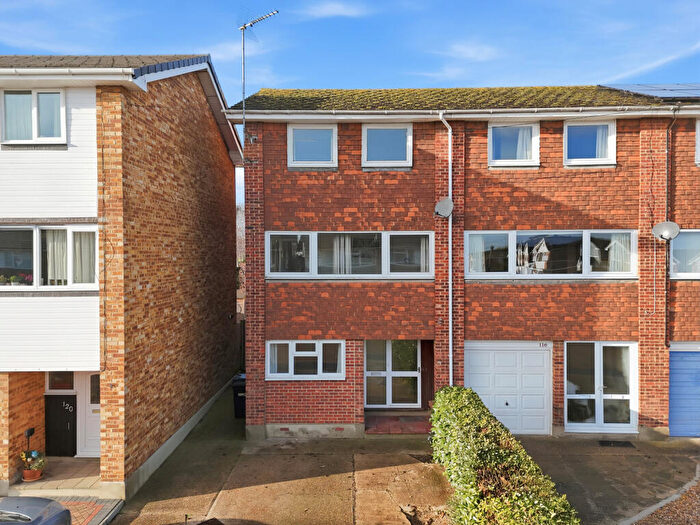
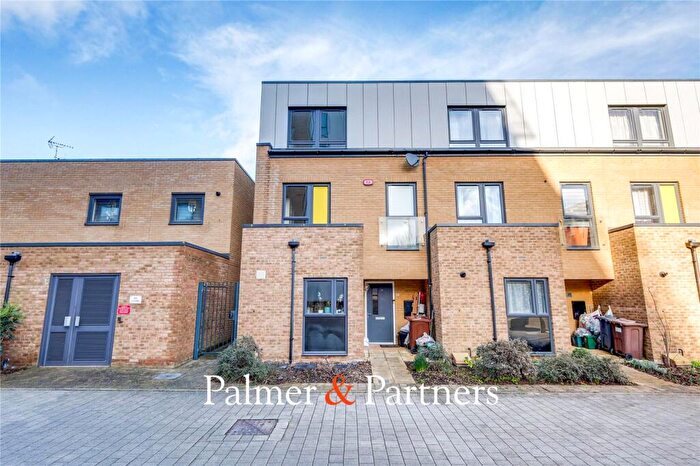
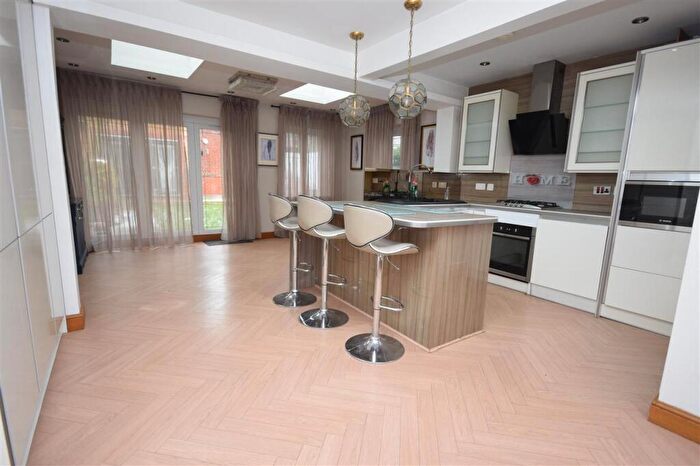
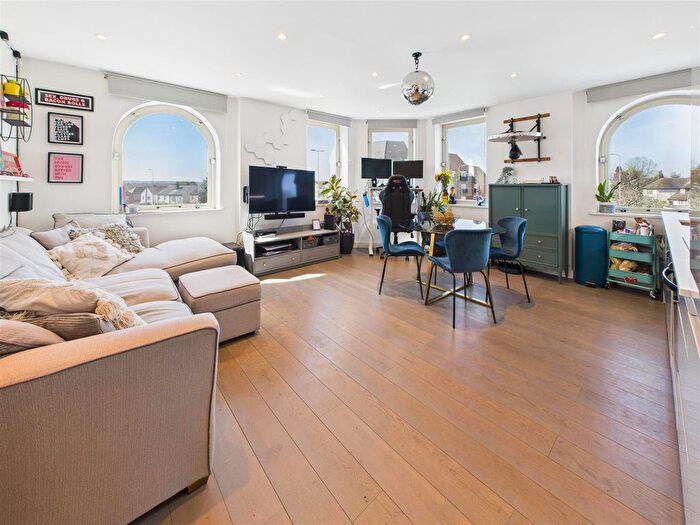
Houses for sale & to rent in Patching Hall, Chelmsford
House Prices in Patching Hall
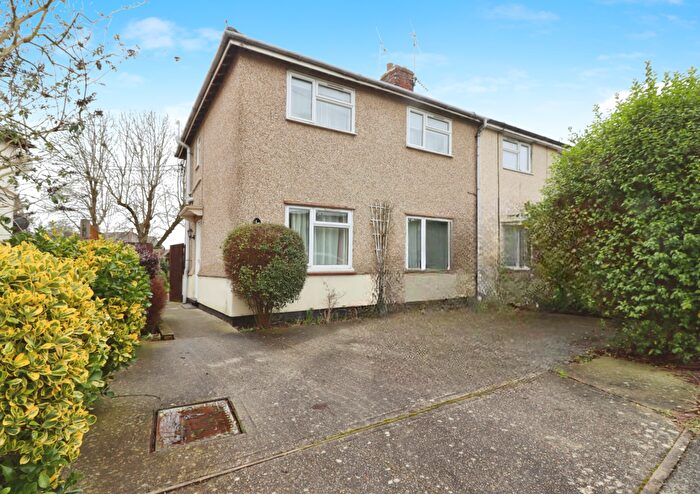
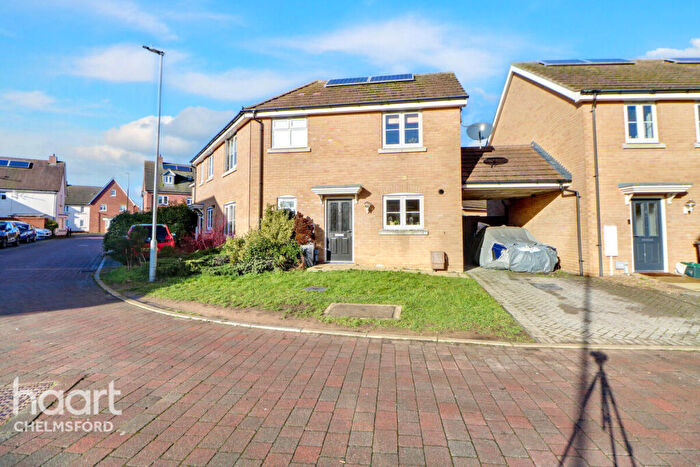
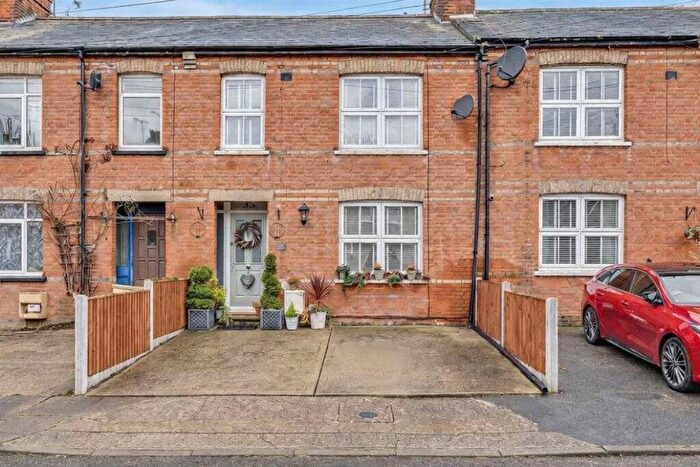
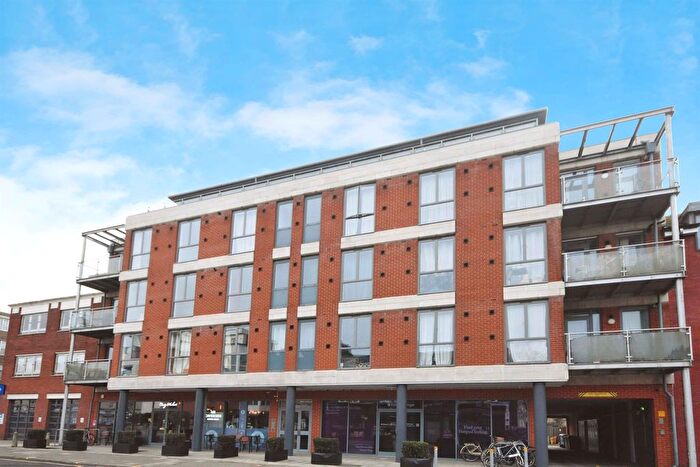
Properties in Patching Hall have an average house price of £418,084.00 and had 290 Property Transactions within the last 3 years¹.
Patching Hall is an area in Chelmsford, Essex with 3,821 households², where the most expensive property was sold for £1,190,000.00.
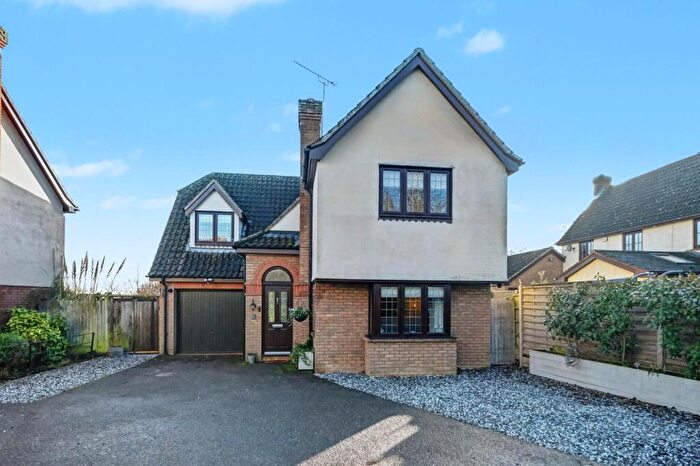
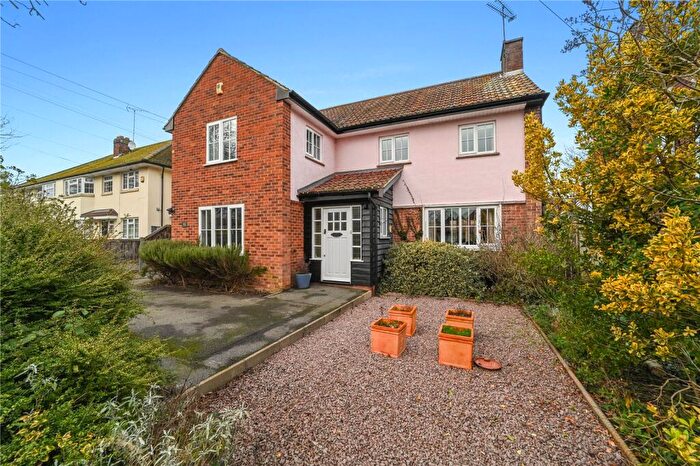
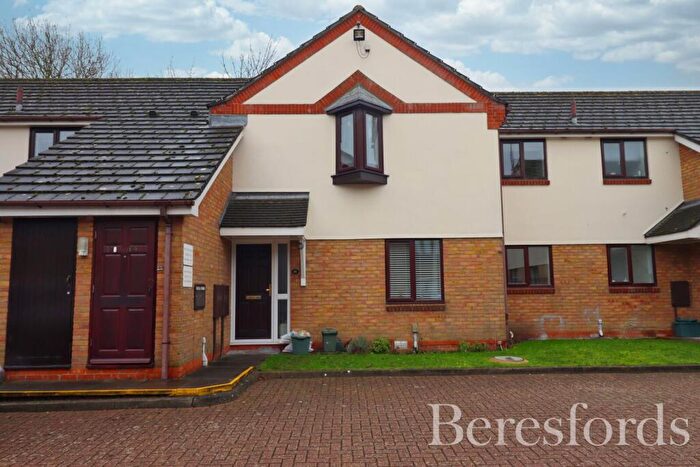
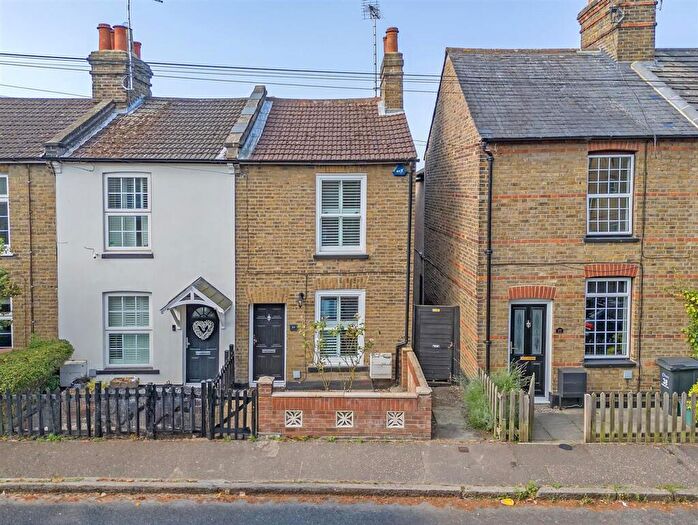
Properties for sale in Patching Hall
Roads and Postcodes in Patching Hall
Navigate through our locations to find the location of your next house in Patching Hall, Chelmsford for sale or to rent.
| Streets | Postcodes |
|---|---|
| Alan Cherry Drive | CM1 1QT |
| Aubrey Close | CM1 4EJ |
| Bardell Close | CM1 4WA |
| Barnaby Rudge | CM1 4YG |
| Barnfield Mews | CM1 4DF |
| Berwick Avenue | CM1 4AN CM1 4AP CM1 4AR |
| Borda Close | CM1 4JY |
| Bounderby Grove | CM1 4XN CM1 4XW |
| Broomfield Mews | CM1 4GA |
| Broomfield Road | CM1 1RN CM1 1RT CM1 4DP CM1 4DU CM1 4DX CM1 4DY CM1 4DZ CM1 4EA CM1 4ES CM1 4HE CM1 4HF CM1 4HG CM1 1RJ CM1 1RW CM1 4EB CM1 1RL |
| Brownings Avenue | CM1 4HX CM1 4HJ CM1 4RH CM1 4RQ |
| Burnside Crescent | CM1 4EH |
| Chester Place | CM1 4NQ |
| Chestnut Walk | CM1 4JT CM1 4JU |
| Coombe Rise | CM1 7DG |
| Cornwall Crescent | CM1 4BP |
| Corporation Road | CM1 2AR CM1 2AS CM1 2FQ |
| Courtlands | CM1 4DD |
| Crushton Place | CM1 4WH |
| Cumberland Crescent | CM1 4AJ CM1 4AL CM1 4FB |
| Darrell Close | CM1 4EL |
| Dombey Close | CM1 4YF |
| Drood Close | CM1 4XX |
| Eden Waters | CM1 4FQ |
| Elms Drive | CM1 1RH |
| Essex Avenue | CM1 4AQ |
| Eves Crescent | CM1 4HS |
| Fifth Avenue | CM1 4HB CM1 4HD |
| First Avenue | CM1 1RU CM1 1RX |
| Flintwich Manor | CM1 4YP |
| Fourth Avenue | CM1 4EZ CM1 4HA |
| Gloucester Crescent | CM1 4NG |
| Granger Row | CM1 4WF |
| Greenways | CM1 4EF |
| Jubilee Terrace | CM1 1SE |
| Kelvedon Close | CM1 4DG |
| Kings Road | CM1 4HP CM1 4HR CM1 4FS |
| Kipling Close | CM1 4HN |
| Leeford | CM1 4WT |
| Little Dorrit | CM1 4YQ |
| Little Nell | CM1 4YL |
| Longleat Close | CM1 4DQ |
| Magwitch Close | CM1 4YE |
| Merdle Square | CM1 4WG |
| Milton Place | CM1 4LA |
| Nalla Gardens | CM1 4AU CM1 4AX |
| Norfolk Drive | CM1 4AG |
| Oliver Way | CM1 4XR CM1 4ZB |
| Partridge Avenue | CM1 4JG |
| Patching Hall Lane | CM1 4BT CM1 4BU CM1 4BX CM1 4BY CM1 4BZ CM1 4DA CM1 4DB CM1 4DE CM1 4DH CM1 4BS |
| Peggotty Close | CM1 4XU |
| Pembroke Place | CM1 4AT |
| Pentland Avenue | CM1 4AY CM1 4AZ |
| Petersfield | CM1 4EP |
| Pipchin Road | CM1 4XT |
| Portreath Place | CM1 4DN CM1 4DL |
| Pottery Lane | CM1 4HH |
| Quilp Drive | CM1 4YA CM1 4YD |
| Rutland Road | CM1 4BH CM1 4BJ CM1 4BL CM1 4BN CM1 4BW |
| Second Avenue | CM1 4ET CM1 4EU |
| Seventh Avenue | CM1 4EE |
| Sixth Avenue | CM1 4ED |
| Skerry Rise | CM1 4EG CM1 4EQ |
| Somerset Place | CM1 4AH |
| Sowerberry Close | CM1 4YB |
| Sunrise Avenue | CM1 4JL CM1 4JN CM1 4JP CM1 4JR CM1 4JW |
| Tapley Road | CM1 4XY |
| Tennyson Road | CM1 4HY |
| The Drive | CM1 4JS |
| Third Avenue | CM1 4EX CM1 4EY |
| Town Croft | CM1 4JX |
| Traddles Court | CM1 4XZ |
| Tugby Place | CM1 4XL |
| Varden Close | CM1 4XS |
| Weller Grove | CM1 4YJ |
| Wickham Crescent | CM1 4WD |
| Woodhall Parade | CM1 4BA |
| Woodhall Road | CM1 4AA CM1 4AB CM1 4AD CM1 4AE CM1 4AF |
| Woodland Road | CM1 2AT |
| Wordsworth Court | CM1 4HL |
| CM1 1RZ CM1 4WB |
Transport near Patching Hall
-
Chelmsford Station
-
Hatfield Peverel Station
-
Ingatestone Station
-
White Notley Station
-
Witham Station
-
Cressing Station
-
Billericay Station
-
Braintree Freeport Station
-
South Woodham Ferrers Station
-
Braintree Station
- FAQ
- Price Paid By Year
- Property Type Price
Frequently asked questions about Patching Hall
What is the average price for a property for sale in Patching Hall?
The average price for a property for sale in Patching Hall is £418,084. This amount is 2% lower than the average price in Chelmsford. There are 1,302 property listings for sale in Patching Hall.
What streets have the most expensive properties for sale in Patching Hall?
The streets with the most expensive properties for sale in Patching Hall are Patching Hall Lane at an average of £671,489, Longleat Close at an average of £655,000 and Barnaby Rudge at an average of £643,333.
What streets have the most affordable properties for sale in Patching Hall?
The streets with the most affordable properties for sale in Patching Hall are Wordsworth Court at an average of £95,000, Drood Close at an average of £170,000 and Bounderby Grove at an average of £206,818.
Which train stations are available in or near Patching Hall?
Some of the train stations available in or near Patching Hall are Chelmsford, Hatfield Peverel and Ingatestone.
Property Price Paid in Patching Hall by Year
The average sold property price by year was:
| Year | Average Sold Price | Price Change |
Sold Properties
|
|---|---|---|---|
| 2025 | £411,791 | 0,3% |
90 Properties |
| 2024 | £410,678 | -5% |
95 Properties |
| 2023 | £430,177 | 7% |
105 Properties |
| 2022 | £398,889 | -1% |
118 Properties |
| 2021 | £401,687 | 6% |
158 Properties |
| 2020 | £378,724 | 6% |
89 Properties |
| 2019 | £357,392 | -7% |
103 Properties |
| 2018 | £382,907 | 5% |
139 Properties |
| 2017 | £362,738 | 2% |
122 Properties |
| 2016 | £353,729 | 17% |
137 Properties |
| 2015 | £295,013 | 11% |
158 Properties |
| 2014 | £261,171 | 3% |
131 Properties |
| 2013 | £252,740 | 6% |
125 Properties |
| 2012 | £237,841 | -0,3% |
115 Properties |
| 2011 | £238,622 | 6% |
127 Properties |
| 2010 | £224,475 | -0,4% |
84 Properties |
| 2009 | £225,430 | 3% |
97 Properties |
| 2008 | £217,871 | -13% |
94 Properties |
| 2007 | £246,756 | 13% |
161 Properties |
| 2006 | £215,011 | 4% |
201 Properties |
| 2005 | £205,363 | 3% |
135 Properties |
| 2004 | £199,339 | 11% |
175 Properties |
| 2003 | £177,234 | 16% |
156 Properties |
| 2002 | £149,691 | 12% |
160 Properties |
| 2001 | £132,444 | 9% |
223 Properties |
| 2000 | £121,109 | 22% |
253 Properties |
| 1999 | £94,943 | 14% |
216 Properties |
| 1998 | £81,494 | 13% |
126 Properties |
| 1997 | £70,537 | 3% |
175 Properties |
| 1996 | £68,770 | 4% |
176 Properties |
| 1995 | £66,294 | - |
124 Properties |
Property Price per Property Type in Patching Hall
Here you can find historic sold price data in order to help with your property search.
The average Property Paid Price for specific property types in the last three years are:
| Property Type | Average Sold Price | Sold Properties |
|---|---|---|
| Semi Detached House | £452,092.00 | 124 Semi Detached Houses |
| Detached House | £574,742.00 | 65 Detached Houses |
| Terraced House | £344,315.00 | 52 Terraced Houses |
| Flat | £202,494.00 | 49 Flats |

