
Houses for sale & to rent in SO53 2QG, THURSTON CLOSE, Hiltingbury, Eastleigh
House Prices in SO53 2QG, THURSTON CLOSE, Hiltingbury
Properties in SO53 2QG have an average house price of £700,000.00 and had 1 Property Transaction within the last 3 years.¹ SO53 2QG is a postcode in THURSTON CLOSE located in Hiltingbury, an area in Eastleigh, Hampshire, with 6 households², where the most expensive property was sold for £700,000.00.
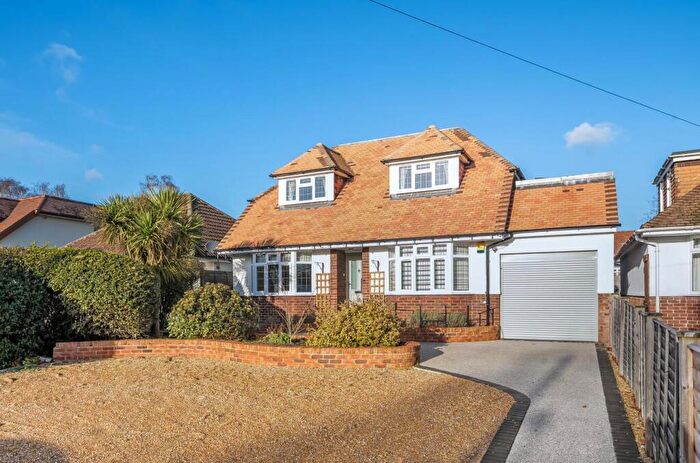
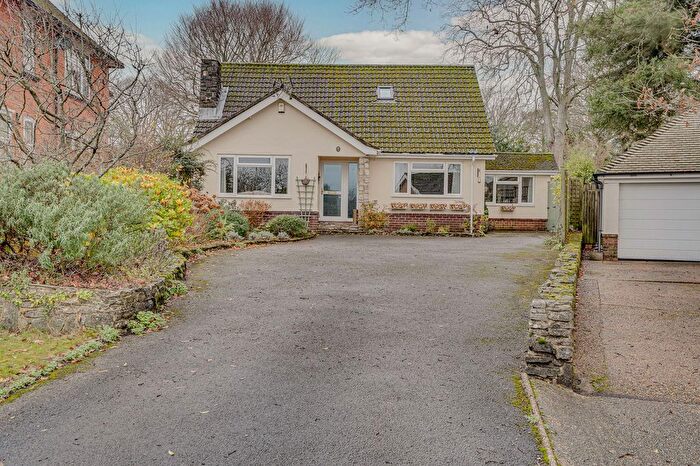
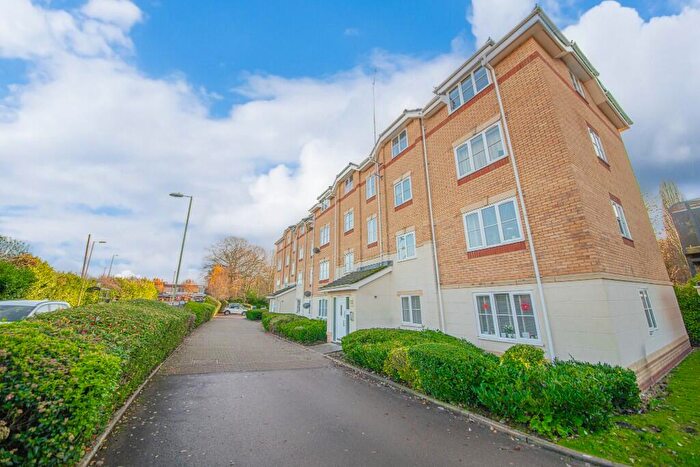
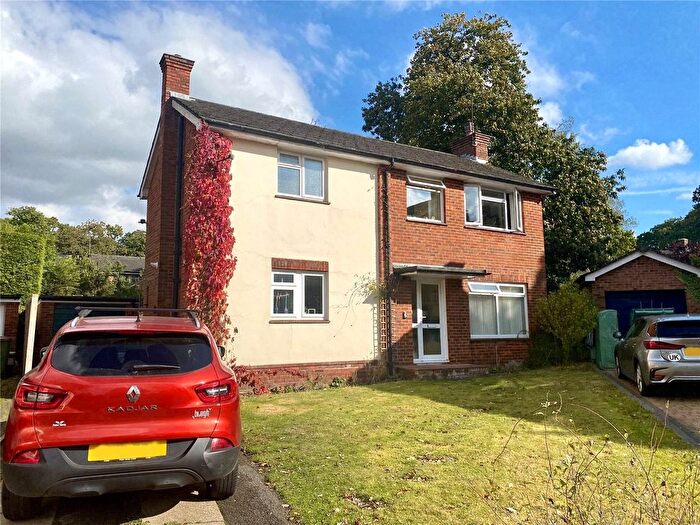
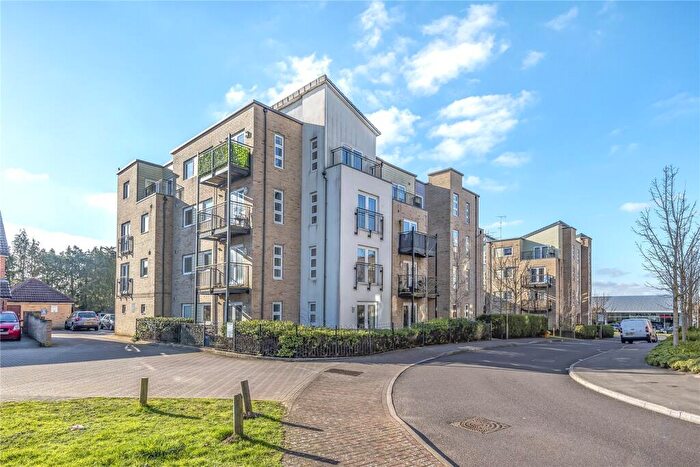
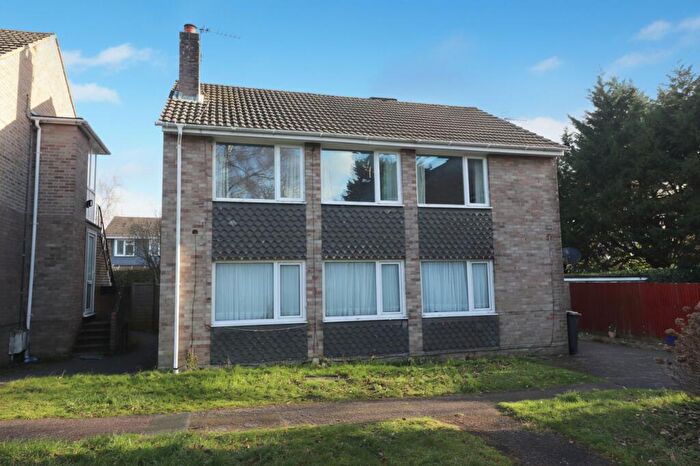
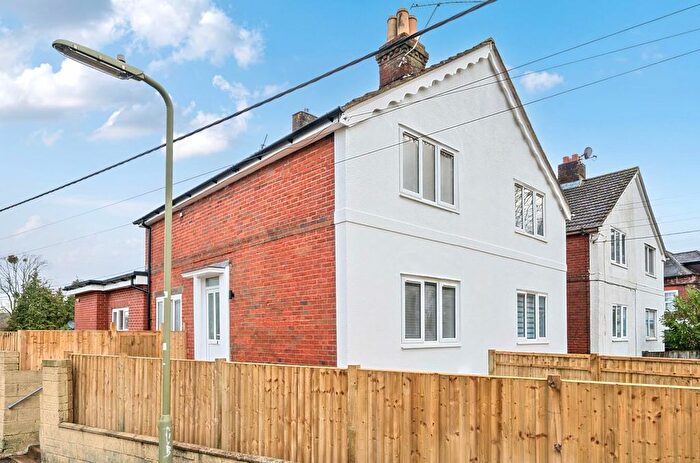
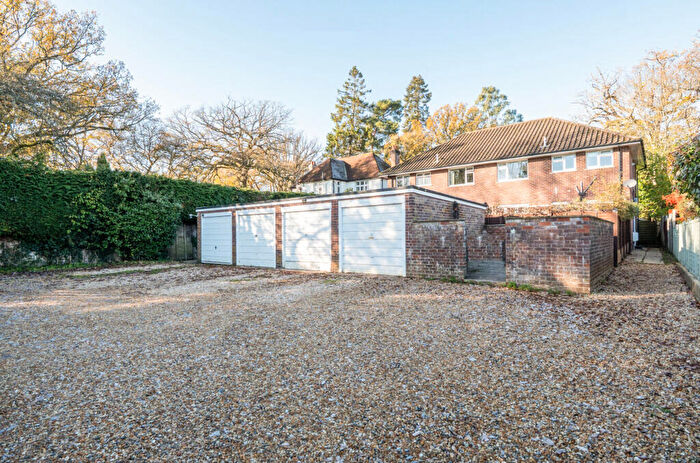
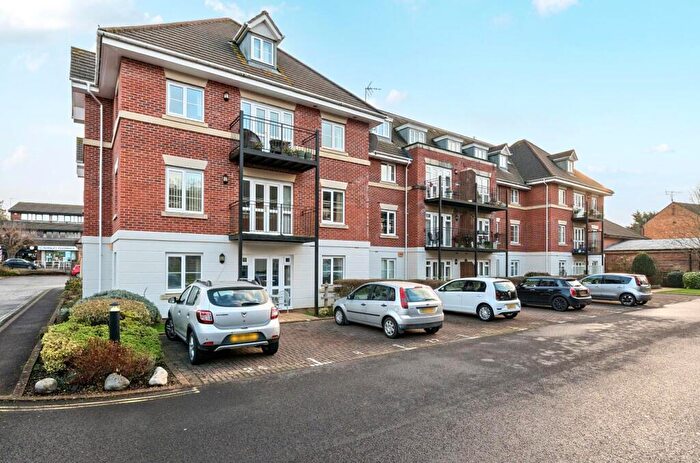
Properties for sale near SO53 2QG, THURSTON CLOSE
![]()
If you are looking to sell your house, let it out, or receive a property valuation, an expert can help you.
Click the button below to get started.

Price Paid in THURSTON CLOSE, SO53 2QG, Hiltingbury
1A THURSTON CLOSE, SO53 2QG, Hiltingbury Eastleigh
Property 1A has been sold 1 time. The last time it was sold was in 03/09/2025 and the sold price was £700,000.00.
This is a Detached House which was sold as a freehold in 03/09/2025
| Date | Price | Property Type | Tenure | Classification |
|---|---|---|---|---|
| 03/09/2025 | £700,000.00 | Detached House | freehold | Established Building |
4 THURSTON CLOSE, SO53 2QG, Hiltingbury Eastleigh
Property 4 has been sold 2 times. The last time it was sold was in 20/12/2021 and the sold price was £835,000.00.
This detached house, sold as a freehold on 20/12/2021, is a 187 sqm detached bungalow with an EPC rating of D.
| Date | Price | Property Type | Tenure | Classification |
|---|---|---|---|---|
| 20/12/2021 | £835,000.00 | Detached House | freehold | Established Building |
| 29/11/2016 | £577,500.00 | Detached House | freehold | Established Building |
1 THURSTON CLOSE, SO53 2QG, Hiltingbury Eastleigh
Property 1 has been sold 1 time. The last time it was sold was in 07/01/2021 and the sold price was £550,000.00.
This detached house, sold as a freehold on 07/01/2021, is a 100 sqm detached bungalow with an EPC rating of D.
| Date | Price | Property Type | Tenure | Classification |
|---|---|---|---|---|
| 07/01/2021 | £550,000.00 | Detached House | freehold | Established Building |
3 THURSTON CLOSE, SO53 2QG, Hiltingbury Eastleigh
Property 3 has been sold 1 time. The last time it was sold was in 12/06/2020 and the sold price was £610,100.00.
This detached house, sold as a freehold on 12/06/2020, is a 149 sqm detached bungalow with an EPC rating of D.
| Date | Price | Property Type | Tenure | Classification |
|---|---|---|---|---|
| 12/06/2020 | £610,100.00 | Detached House | freehold | Established Building |
Transport near SO53 2QG, THURSTON CLOSE

House price paid reports for SO53 2QG, THURSTON CLOSE
Click on the buttons below to see price paid reports by year or property price:
- Price Paid By Year
- Property Type Price
Property Price Paid in SO53 2QG, THURSTON CLOSE by Year
The average sold property price by year was:
| Year | Average Sold Price | Price Change |
Sold Properties
|
|---|---|---|---|
| 2025 | £700,000 | 1% |
1 Property |
| 2021 | £692,500 | 12% |
2 Properties |
| 2020 | £610,100 | 5% |
1 Property |
| 2016 | £577,500 | - |
1 Property |
Property Price per Property Type in SO53 2QG, THURSTON CLOSE
Here you can find historic sold price data in order to help with your property search.
The average Property Paid Price for specific property types in the last three years are:
| Property Type | Average Sold Price | Sold Properties |
|---|---|---|
| Detached House | £700,000.00 | 1 Detached House |