
Houses for sale & to rent in SO51 8GU, Banning Street, Abbey, Romsey
House Prices in SO51 8GU, Banning Street, Abbey
Properties in SO51 8GU have no sales history available within the last 3 years. SO51 8GU is a postcode in Banning Street located in Abbey, an area in Romsey, Hampshire, with 7 households².
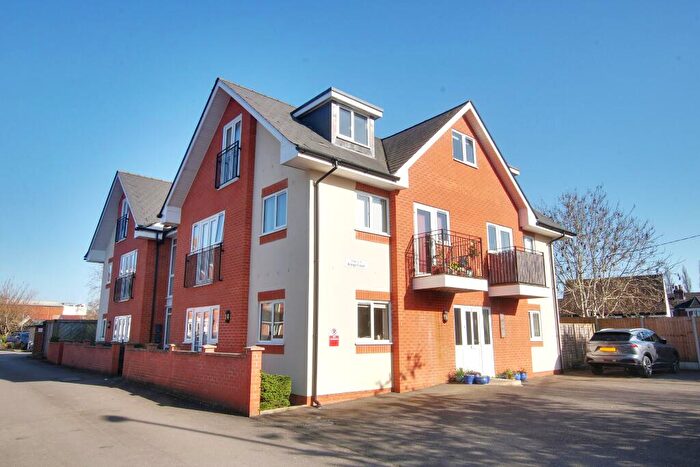
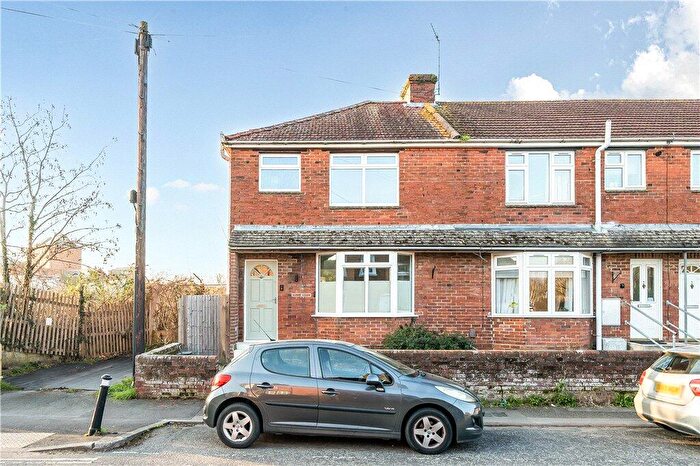
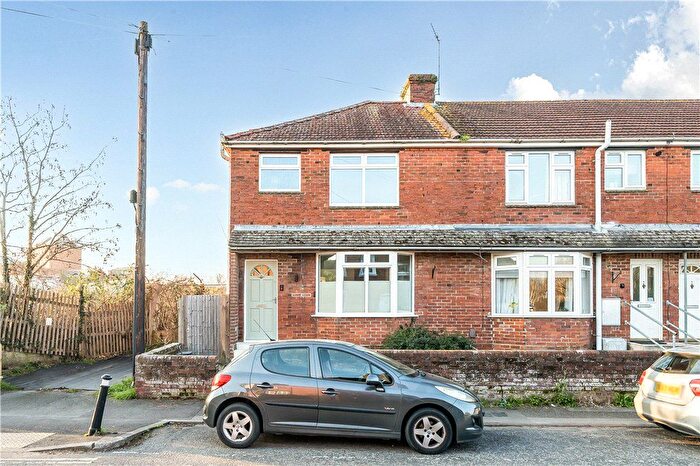
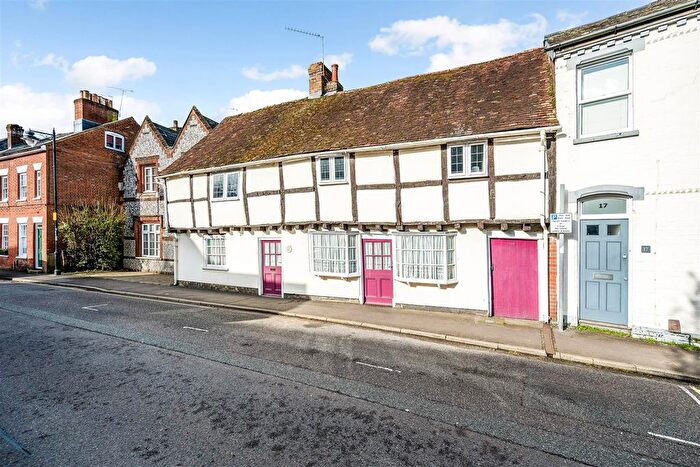
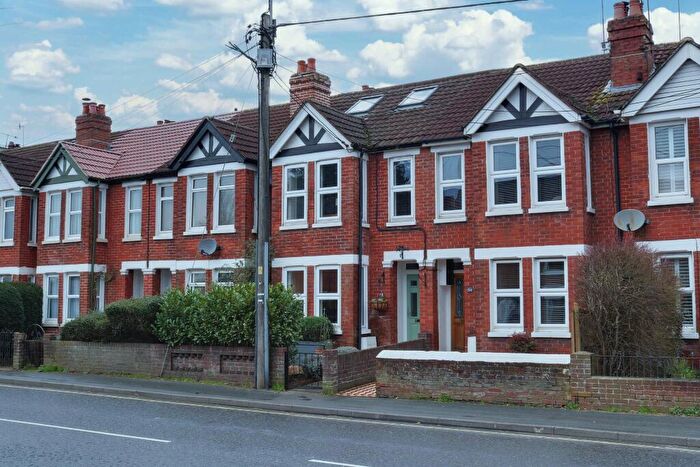
Properties for sale near SO51 8GU, Banning Street
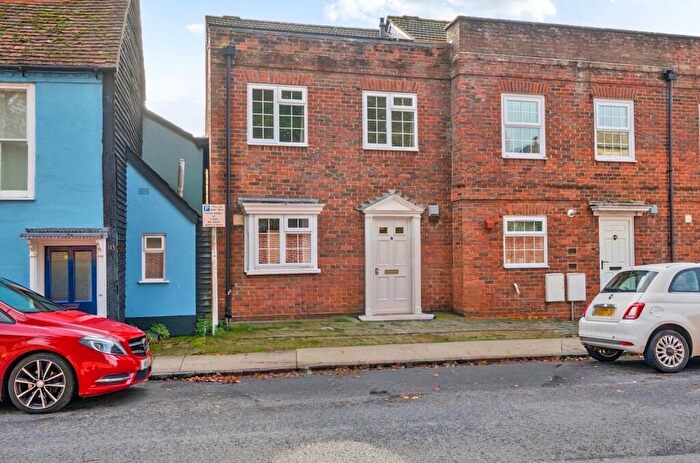
![]()
If you are looking to sell your house, let it out, or receive a property valuation, an expert can help you.
Click the button below to get started.


Price Paid in Banning Street, SO51 8GU, Abbey
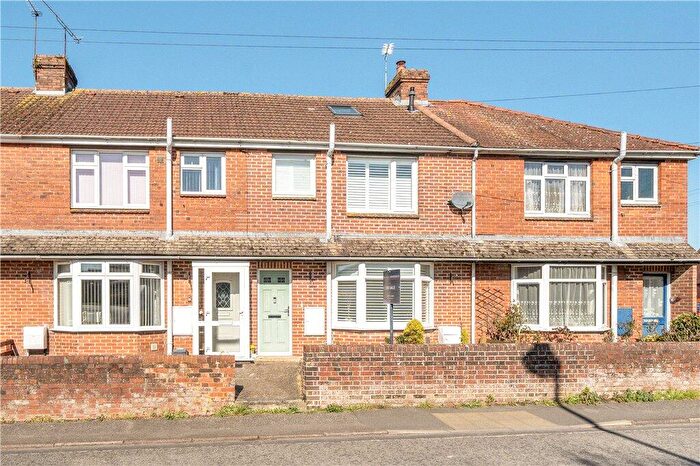
64 Banning Street, SO51 8GU, Abbey Romsey
Property 64 has been sold 2 times. The last time it was sold was in 23/04/2021 and the sold price was £355,000.00.
This terraced house, sold as a freehold on 23/04/2021, is a 119 sqm semi-detached house with an EPC rating of D.
| Date | Price | Property Type | Tenure | Classification |
|---|---|---|---|---|
| 23/04/2021 | £355,000.00 | Terraced House | freehold | Established Building |
| 01/09/2017 | £202,500.00 | Terraced House | freehold | Established Building |
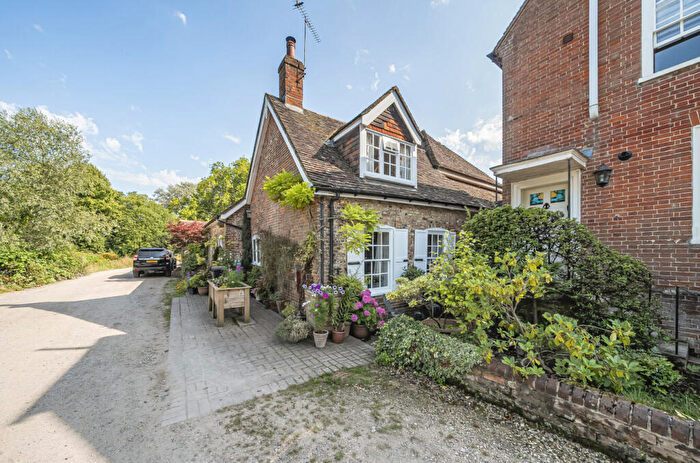
WILLOW COTTAGE Banning Street, SO51 8GU, Abbey Romsey
Property WILLOW COTTAGE has been sold 2 times. The last time it was sold was in 21/12/2016 and the sold price was £400,000.00.
This detached house, sold as a freehold on 21/12/2016, is a 256 sqm detached house with an EPC rating of D.
| Date | Price | Property Type | Tenure | Classification |
|---|---|---|---|---|
| 21/12/2016 | £400,000.00 | Detached House | freehold | Established Building |
| 28/07/2000 | £268,000.00 | Detached House | freehold | Established Building |
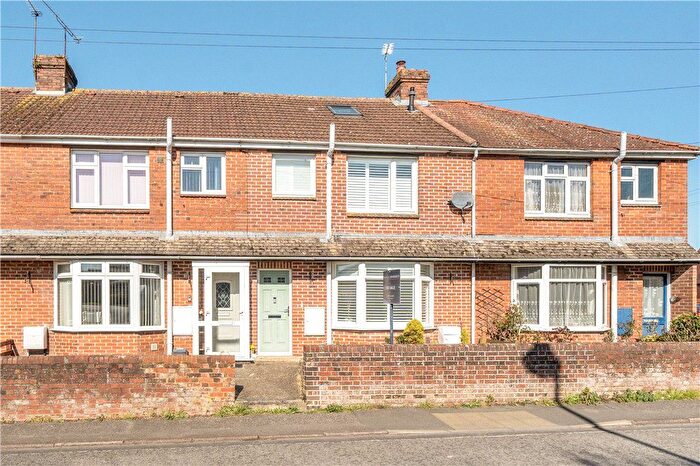
66 Banning Street, SO51 8GU, Abbey Romsey
This is a 84 square meter End-terrace House with an EPC rating of C. Currently, there is no transaction history available for this property.
Transport near SO51 8GU, Banning Street
-
 Romsey Station
 -
Mottisfont and Dunbridge Station
-
Redbridge Station
-
Totton Station
-
Chandlers Ford Station
House price paid reports for SO51 8GU, Banning Street
Click on the buttons below to see price paid reports by year or property price:
- Price Paid By Year
Property Price Paid in SO51 8GU, Banning Street by Year
The average sold property price by year was:
| Year | Average Sold Price | Price Change |
Sold Properties
|
|---|---|---|---|
| 2021 | £355,000 | 43% |
1 Property |
| 2017 | £202,500 | -98% |
1 Property |
| 2016 | £400,000 | 33% |
1 Property |
| 2000 | £268,000 | - |
1 Property |