
Houses for sale & to rent in SO51 5SS, Montfort Road, Tadburn, Romsey
House Prices in SO51 5SS, Montfort Road, Tadburn
Properties in SO51 5SS have no sales history available within the last 3 years. SO51 5SS is a postcode in Montfort Road located in Tadburn, an area in Romsey, Hampshire, with 3 households².
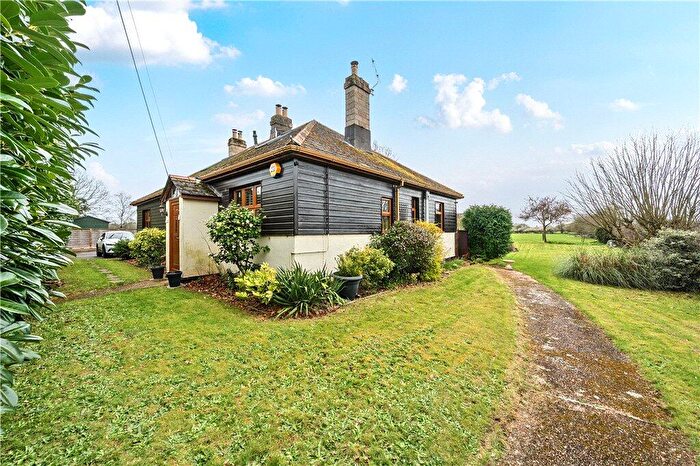
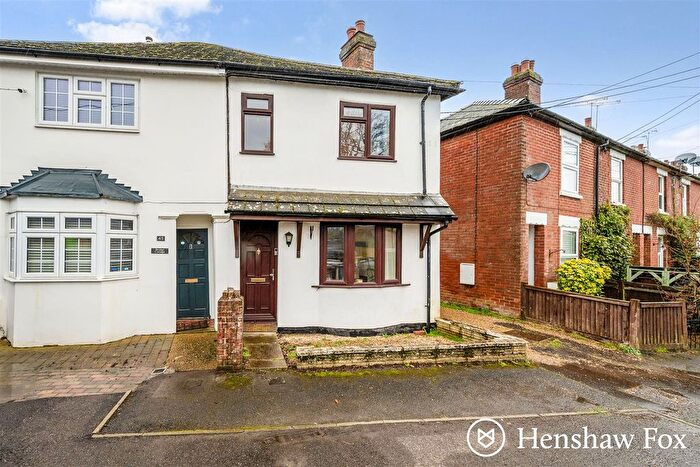
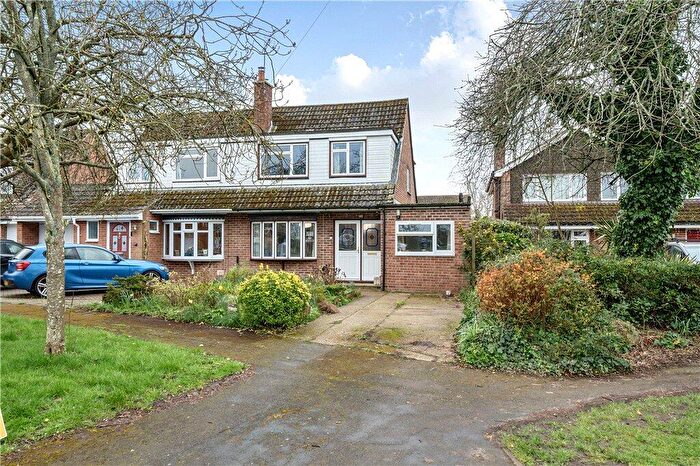
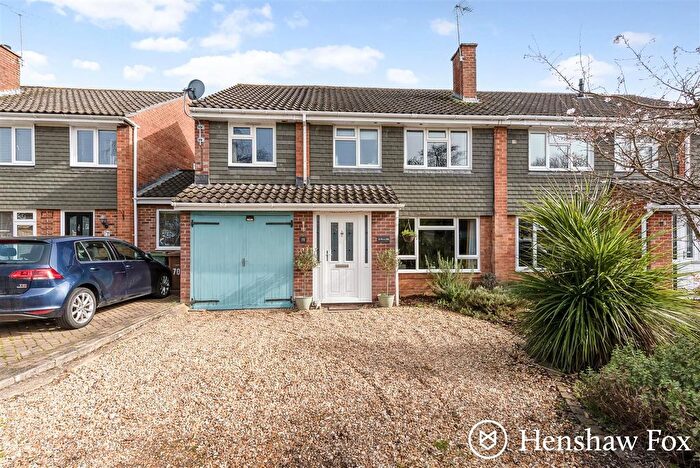
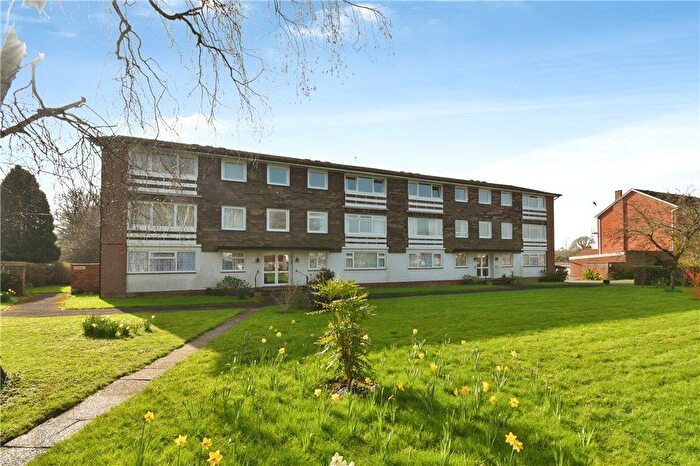
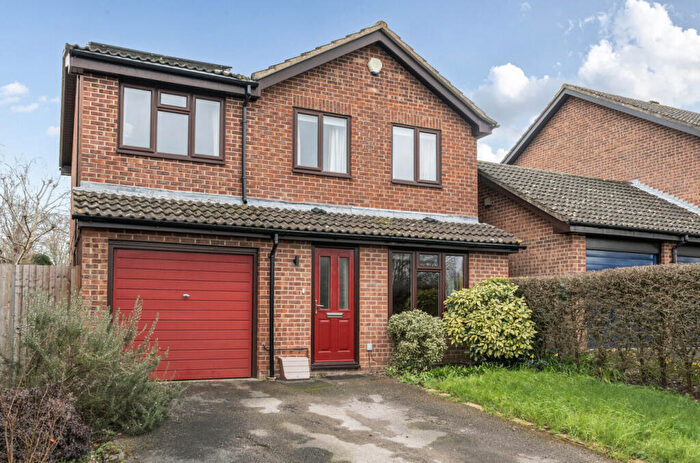
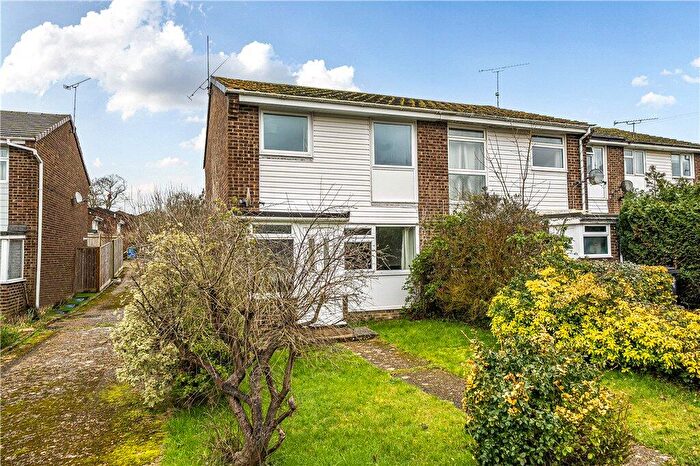
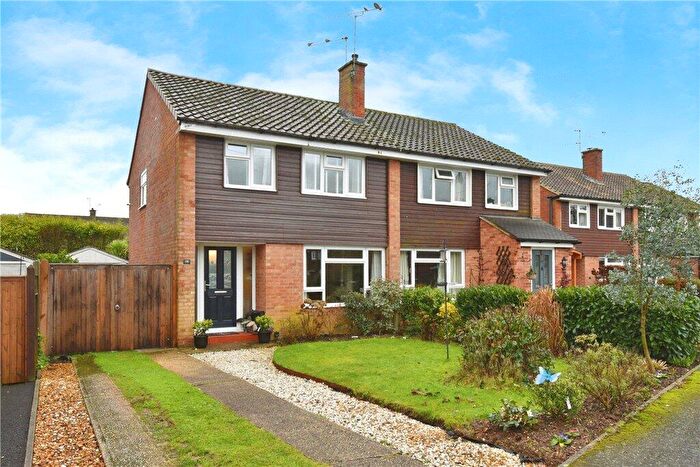
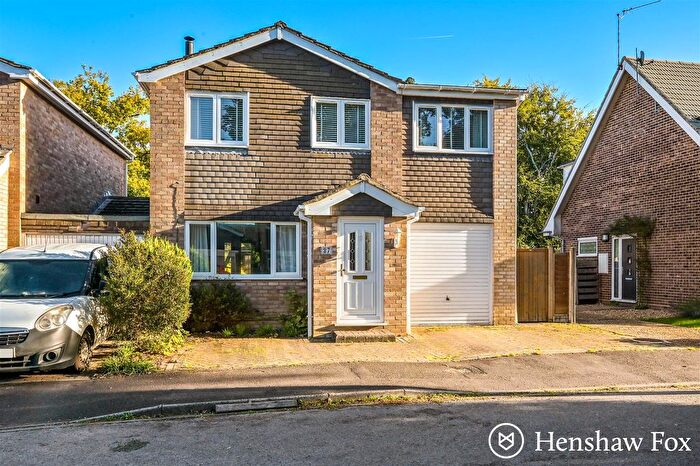
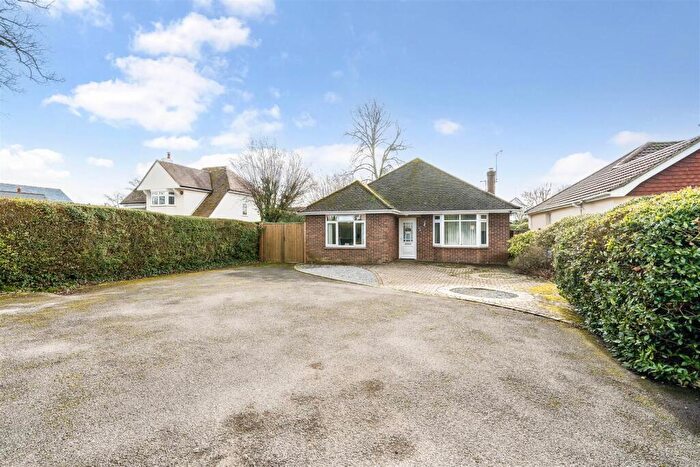
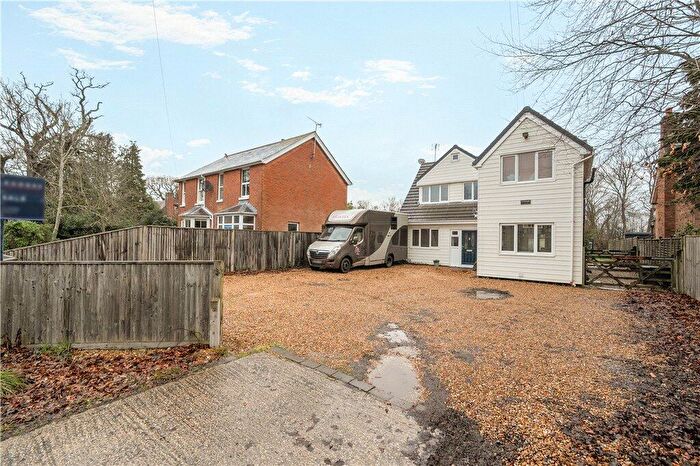
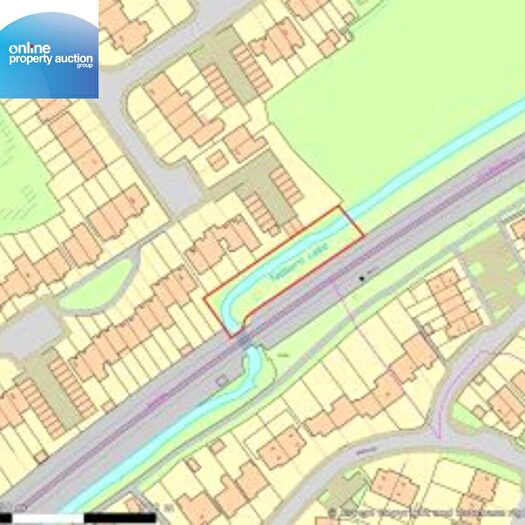
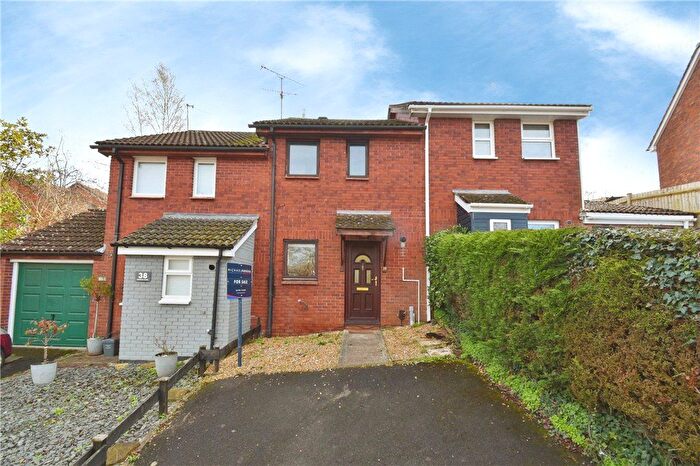
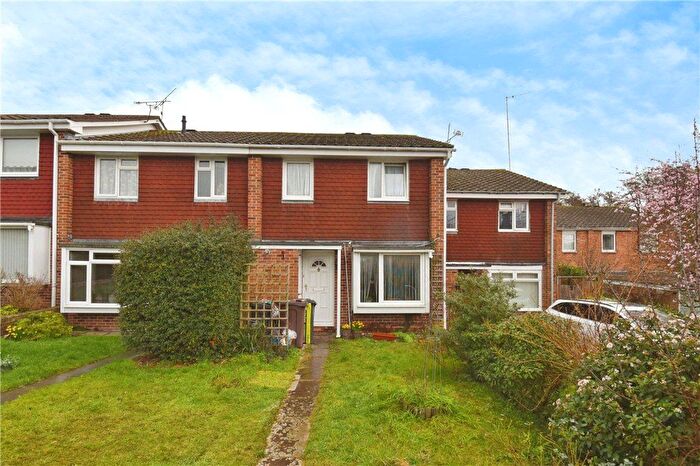
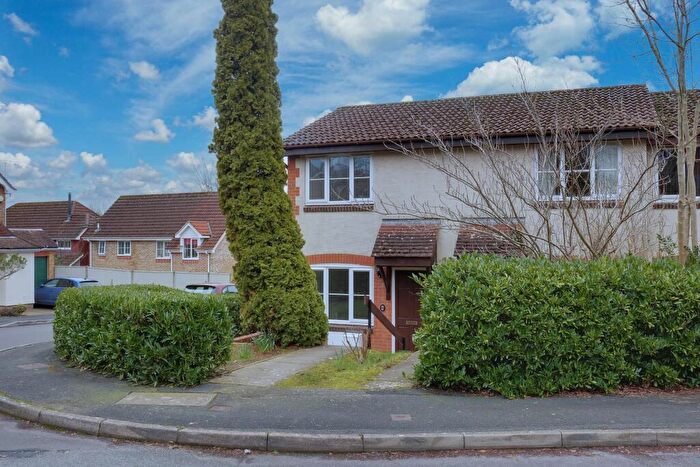
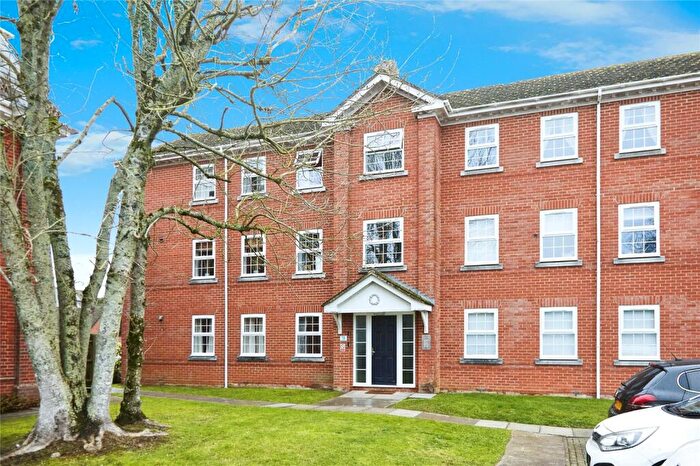
Properties for sale near SO51 5SS, Montfort Road


![]()
If you are looking to sell your house, let it out, or receive a property valuation, an expert can help you.
Click the button below to get started.


Price Paid in Montfort Road, SO51 5SS, Tadburn
20 Montfort Road, SO51 5SS, Tadburn Romsey
Property 20 has been sold 2 times. The last time it was sold was in 16/11/2018 and the sold price was £420,000.00.
This semi detached house, sold as a freehold on 16/11/2018, is a 137 sqm semi-detached house with an EPC rating of D.
| Date | Price | Property Type | Tenure | Classification |
|---|---|---|---|---|
| 16/11/2018 | £420,000.00 | Semi Detached House | freehold | Established Building |
| 09/10/2006 | £280,000.00 | Semi Detached House | freehold | Established Building |
24 Montfort Road, SO51 5SS, Tadburn Romsey
Property 24 has been sold 2 times. The last time it was sold was in 15/04/2003 and the sold price was £248,000.00.
This semi detached house, sold as a freehold on 15/04/2003, is a 105 sqm semi-detached house with an EPC rating of D.
| Date | Price | Property Type | Tenure | Classification |
|---|---|---|---|---|
| 15/04/2003 | £248,000.00 | Semi Detached House | freehold | Established Building |
| 27/11/1998 | £108,000.00 | Semi Detached House | freehold | Established Building |
Postcodes in Montfort Road, Tadburn
Navigate through other locations in Montfort Road, Tadburn, Romsey to see more property listings for sale or to rent.
Transport near SO51 5SS, Montfort Road
-
 Romsey Station
 -
Chandlers Ford Station
-
Redbridge Station
-
Totton Station
-
Mottisfont and Dunbridge Station
House price paid reports for SO51 5SS, Montfort Road
Click on the buttons below to see price paid reports by year or property price:
- Price Paid By Year
Property Price Paid in SO51 5SS, Montfort Road by Year
The average sold property price by year was:
| Year | Average Sold Price | Price Change |
Sold Properties
|
|---|---|---|---|
| 2018 | £420,000 | 33% |
1 Property |
| 2006 | £280,000 | 11% |
1 Property |
| 2003 | £248,000 | 56% |
1 Property |
| 1998 | £108,000 | - |
1 Property |