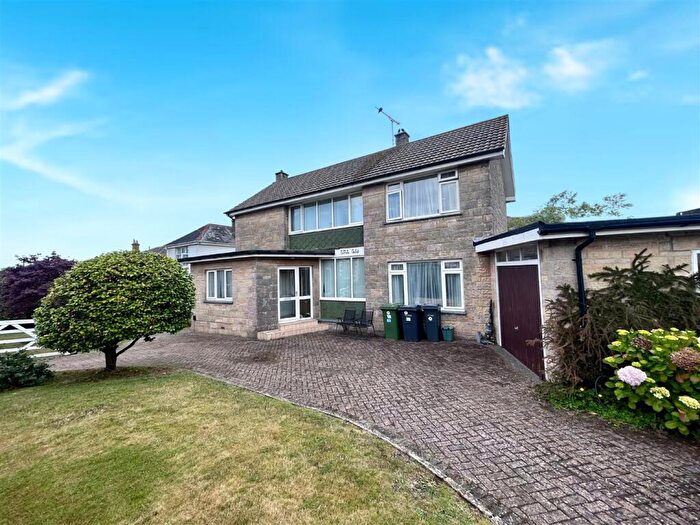
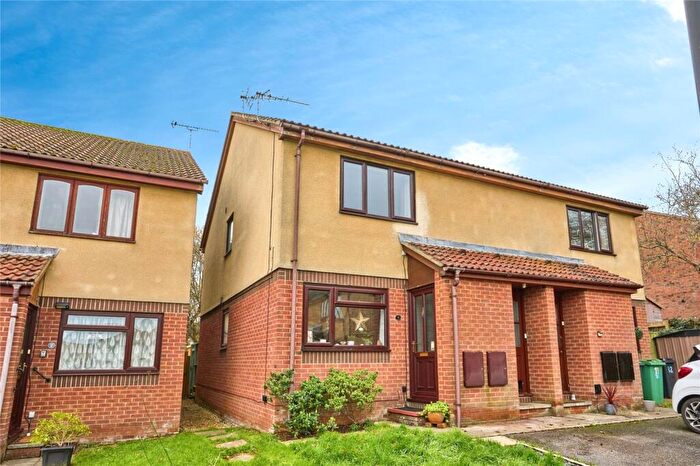
Houses for sale & to rent in Sandown North, Sandown
House Prices in Sandown North
Properties in Sandown North have an average house price of £284,808.00 and had 191 Property Transactions within the last 3 years¹.
Sandown North is an area in Sandown, Isle of Wight with 1,250 households², where the most expensive property was sold for £950,000.00.
Properties for sale in Sandown North
Roads and Postcodes in Sandown North
Navigate through our locations to find the location of your next house in Sandown North, Sandown for sale or to rent.
| Streets | Postcodes |
|---|---|
| Albert Road | PO36 8AW |
| Albion Road | PO36 8AG |
| Avenue Nurseries | PO36 8BS |
| Avenue Road | PO36 8AY PO36 8AZ PO36 8BE PO36 8BN PO36 8BW PO36 8DY PO36 8DZ PO36 9AN PO36 8BD PO36 9AL PO36 9PU |
| Breakwater Way | PO36 8FE |
| Brickfields Way | PO36 8BU |
| Bridge Mead Mews | PO36 9AP |
| Broadway | PO36 9AA PO36 9AE PO36 9AG PO36 9AQ PO36 9BD |
| Carter Street | PO36 8BL PO36 8BP PO36 8DQ |
| Chatsworth Mews | PO36 8RB |
| Chesham Terrace | PO36 8BB |
| College Close | PO36 8EA PO36 8EB PO36 8ED |
| Crescent Road | PO36 8AX |
| Cross Street | PO36 8BJ PO36 8BQ |
| Culver Parade | PO36 8AS PO36 8AT PO36 8QA |
| Culver Way | PO36 8QG PO36 8QJ PO36 8QL |
| East Yar Park | PO36 9FA |
| East Yar Road | PO36 9AT PO36 9FG PO36 9AS PO36 9AX PO36 9AY PO36 9FS |
| Faulkner Lane | PO36 9AZ |
| Fitzroy Street | PO36 8HG PO36 8HQ PO36 8HR |
| Fort Mews | PO36 8BH |
| Fort Street | PO36 8AU PO36 8BA |
| Foxes Close | PO36 9AF |
| Gordon Close | PO36 9AD |
| Grayswood Close | PO36 9BJ |
| Grove Road | PO36 8HH PO36 9BE PO36 9BG PO36 9BQ |
| High Street | PO36 8AE PO36 8AQ PO36 8AF PO36 8AH PO36 8AJ |
| Marsh Close | PO36 8EU |
| Meadow Way | PO36 8QD PO36 8QE |
| North Street | PO36 8BG |
| Park Mews | PO36 9BL |
| Parsonage Road | PO36 9AH PO36 9AJ |
| Queens Road | PO36 8DT |
| Redcliff Close | PO36 8QQ |
| Seagrove Drive | PO36 9AB |
| Senator Industrial Estate | PO36 8EH |
| St Johns Crescent | PO36 8EE PO36 8EF PO36 8EG PO36 8EQ |
| St Johns Road | PO36 8HE PO36 8HF PO36 8HS |
| St Pete Way | PO36 8DB |
| Station Lane | PO36 9QX |
| Station Road | PO36 9BP |
| Sunset Drive | PO36 9BH |
| Tamar Close | PO36 9AW |
| The Cloisters | PO36 9AR |
| Victoria Road | PO36 8AL PO36 8AP |
| Vinings Gardens | PO36 8DX |
| Vinings Road | PO36 8DU |
| Whitecliff Close | PO36 8QH |
| Winchester Park Road | PO36 8HJ PO36 9BA PO36 8FD |
| Yaverland Close | PO36 8QF |
| Yaverland Road | PO36 8QB PO36 8QN PO36 8QP PO36 8QW PO36 8FF PO36 8QS |
Transport near Sandown North
- FAQ
- Price Paid By Year
- Property Type Price
Frequently asked questions about Sandown North
What is the average price for a property for sale in Sandown North?
The average price for a property for sale in Sandown North is £284,808. This amount is 3% higher than the average price in Sandown. There are 1,336 property listings for sale in Sandown North.
What streets have the most expensive properties for sale in Sandown North?
The streets with the most expensive properties for sale in Sandown North are Meadow Way at an average of £457,000, Culver Way at an average of £452,576 and Whitecliff Close at an average of £370,000.
What streets have the most affordable properties for sale in Sandown North?
The streets with the most affordable properties for sale in Sandown North are The Cloisters at an average of £135,000, Seagrove Drive at an average of £146,000 and High Street at an average of £153,500.
Which train stations are available in or near Sandown North?
Some of the train stations available in or near Sandown North are Sandown, Lake and Brading.
Property Price Paid in Sandown North by Year
The average sold property price by year was:
| Year | Average Sold Price | Price Change |
Sold Properties
|
|---|---|---|---|
| 2025 | £320,720 | 19% |
25 Properties |
| 2024 | £259,763 | -13% |
57 Properties |
| 2023 | £292,659 | 2% |
47 Properties |
| 2022 | £287,401 | 3% |
62 Properties |
| 2021 | £279,609 | 25% |
68 Properties |
| 2020 | £208,619 | -13% |
61 Properties |
| 2019 | £236,120 | 17% |
58 Properties |
| 2018 | £197,128 | -3% |
76 Properties |
| 2017 | £203,629 | 11% |
57 Properties |
| 2016 | £182,129 | -2% |
69 Properties |
| 2015 | £186,240 | 7% |
63 Properties |
| 2014 | £172,677 | -1% |
70 Properties |
| 2013 | £175,211 | 1% |
63 Properties |
| 2012 | £174,073 | -1% |
41 Properties |
| 2011 | £175,648 | -1% |
40 Properties |
| 2010 | £176,959 | 1% |
50 Properties |
| 2009 | £174,831 | -3% |
45 Properties |
| 2008 | £179,909 | -15% |
33 Properties |
| 2007 | £206,026 | 12% |
89 Properties |
| 2006 | £180,731 | 6% |
104 Properties |
| 2005 | £169,533 | -2% |
70 Properties |
| 2004 | £172,750 | 21% |
86 Properties |
| 2003 | £136,124 | 17% |
68 Properties |
| 2002 | £112,885 | 13% |
104 Properties |
| 2001 | £97,687 | 11% |
76 Properties |
| 2000 | £86,563 | 11% |
78 Properties |
| 1999 | £76,822 | 7% |
79 Properties |
| 1998 | £71,626 | 22% |
78 Properties |
| 1997 | £55,906 | 11% |
75 Properties |
| 1996 | £49,917 | -0,2% |
63 Properties |
| 1995 | £50,011 | - |
56 Properties |
Property Price per Property Type in Sandown North
Here you can find historic sold price data in order to help with your property search.
The average Property Paid Price for specific property types in the last three years are:
| Property Type | Average Sold Price | Sold Properties |
|---|---|---|
| Semi Detached House | £280,657.00 | 60 Semi Detached Houses |
| Detached House | £444,394.00 | 52 Detached Houses |
| Terraced House | £215,616.00 | 43 Terraced Houses |
| Flat | £143,859.00 | 36 Flats |

