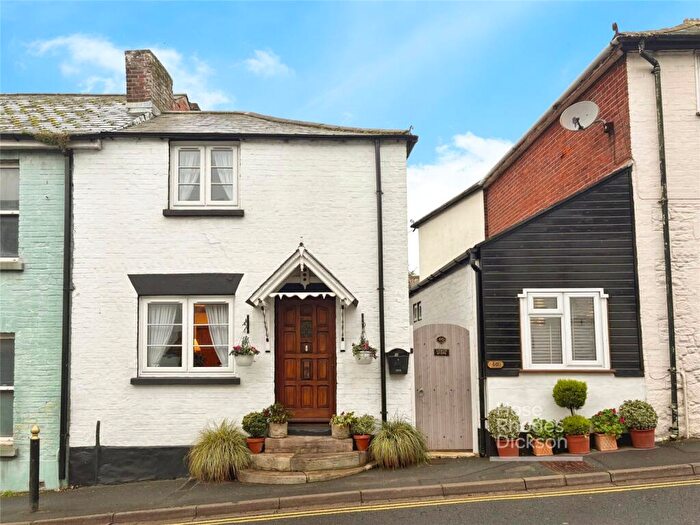
Houses for sale & to rent in Brading, St Helens And Bembridge, Sandown
House Prices in Brading, St Helens And Bembridge
Properties in Brading, St Helens And Bembridge have an average house price of £301,902.00 and had 104 Property Transactions within the last 3 years¹.
Brading, St Helens And Bembridge is an area in Sandown, Isle of Wight with 894 households², where the most expensive property was sold for £950,000.00.
Properties for sale in Brading, St Helens And Bembridge
Roads and Postcodes in Brading, St Helens And Bembridge
Navigate through our locations to find the location of your next house in Brading, St Helens And Bembridge, Sandown for sale or to rent.
| Streets | Postcodes |
|---|---|
| Arnolds Yard | PO36 0AE |
| Aylett Close | PO36 0AP |
| Beaper Shute | PO36 0AZ |
| Broadstone Corner | PO36 0AR |
| Broadstone Crescent | PO36 0AX |
| Bullys Hill | PO36 0ER |
| Carpenters Road | PO36 0BB PO36 0QA PO36 0QD |
| Church Lane | PO36 0BX |
| Clarendon Close | PO36 0BW |
| Cliff Close | PO36 0AU |
| Coach Lane | PO36 0HT PO36 0JE |
| Coastguard Cottages | PO36 8QT |
| Cross Street | PO36 0DL |
| Devonia Gardens | PO36 0PL |
| Downs View Close | PO36 0JA |
| Greenwood Villas | PO36 0EH |
| Hadrians Way | PO36 0HP |
| Haven Crest | PO36 0AL |
| Hawkins Close | PO36 0HZ |
| High Street | PO36 0DG PO36 0DJ PO36 0DQ PO36 0DH PO36 0ED |
| Kyngs Close | PO36 0JF |
| Linden Terrace | PO36 0DA |
| Lower Adgestone Road | PO36 0PJ |
| Lower Furlongs | PO36 0DX PO36 0EA |
| Lower Road | PO36 0HL PO36 0HN PO36 0HW |
| Mallfield Terrace | PO36 0BY |
| Morton Manor Road | PO36 0EP |
| Morton Old Road | PO36 0EN PO36 0EW PO36 0PH |
| Morton Road | PO36 0BH PO36 0BJ PO36 0BN PO36 0EJ PO36 0EL |
| New Road | PO36 0AB PO36 0AD PO36 0AG PO36 0AH PO36 0AJ PO36 0AN PO36 0AQ PO36 0AS PO36 0AW PO36 0DT PO36 0DU |
| Nicholas Close | PO36 0BL |
| Old Pound Close | PO36 0BG |
| Park Road | PO36 0HU |
| Quay Lane | PO36 0AT PO36 0BD |
| Queens Drive | PO36 0JB |
| Rose Close | PO36 0HY |
| Rowborough Lane | PO36 0AY |
| St Marys Road | PO36 0HX |
| Station Gardens | PO36 0DZ |
| Station Road | PO36 0DY PO36 0EB |
| The Bull Ring | PO36 0DF |
| The Mall | PO36 0BS PO36 0BT PO36 0BU PO36 0BZ PO36 0DB PO36 0DE |
| Upper Road | PO36 0ES PO36 0ET PO36 0EU |
| Well Lane | PO36 0EF |
| West Lane | PO36 0JG PO36 0JQ |
| West Street | PO36 0DN PO36 0DP PO36 0DR PO36 0DS PO36 0DW PO36 0FA |
| Wrax Road | PO36 0DD |
| Yarbridge | PO36 0AA PO36 0BP |
| PO36 0BA PO36 8QY |
Transport near Brading, St Helens And Bembridge
- FAQ
- Price Paid By Year
- Property Type Price
Frequently asked questions about Brading, St Helens And Bembridge
What is the average price for a property for sale in Brading, St Helens And Bembridge?
The average price for a property for sale in Brading, St Helens And Bembridge is £301,902. This amount is 9% higher than the average price in Sandown. There are 2,935 property listings for sale in Brading, St Helens And Bembridge.
What streets have the most expensive properties for sale in Brading, St Helens And Bembridge?
The streets with the most expensive properties for sale in Brading, St Helens And Bembridge are Beaper Shute at an average of £900,000, The Mall at an average of £388,928 and Morton Old Road at an average of £374,600.
What streets have the most affordable properties for sale in Brading, St Helens And Bembridge?
The streets with the most affordable properties for sale in Brading, St Helens And Bembridge are Upper Road at an average of £200,000, Yarbridge at an average of £205,000 and High Street at an average of £207,751.
Which train stations are available in or near Brading, St Helens And Bembridge?
Some of the train stations available in or near Brading, St Helens And Bembridge are Brading, Sandown and Smallbrook Junction.
Property Price Paid in Brading, St Helens And Bembridge by Year
The average sold property price by year was:
| Year | Average Sold Price | Price Change |
Sold Properties
|
|---|---|---|---|
| 2025 | £243,520 | -20% |
22 Properties |
| 2024 | £292,520 | -12% |
25 Properties |
| 2023 | £328,325 | -0,1% |
22 Properties |
| 2022 | £328,693 | 12% |
35 Properties |
| 2021 | £288,222 | 28% |
49 Properties |
| 2020 | £207,467 | -28% |
31 Properties |
| 2019 | £265,144 | 12% |
44 Properties |
| 2018 | £233,667 | 12% |
41 Properties |
| 2017 | £204,967 | - |
50 Properties |
| 2016 | £204,960 | -3% |
42 Properties |
| 2015 | £211,680 | -13% |
48 Properties |
| 2014 | £239,647 | 19% |
43 Properties |
| 2013 | £194,112 | 1% |
33 Properties |
| 2012 | £192,139 | -11% |
39 Properties |
| 2011 | £212,635 | -6% |
24 Properties |
| 2010 | £226,322 | 18% |
31 Properties |
| 2009 | £186,290 | -16% |
43 Properties |
| 2008 | £216,166 | 6% |
24 Properties |
| 2007 | £203,173 | 11% |
41 Properties |
| 2006 | £179,862 | 4% |
63 Properties |
| 2005 | £173,210 | 6% |
49 Properties |
| 2004 | £162,301 | 15% |
50 Properties |
| 2003 | £138,012 | -2% |
44 Properties |
| 2002 | £140,378 | 16% |
52 Properties |
| 2001 | £117,869 | 20% |
39 Properties |
| 2000 | £93,879 | 17% |
56 Properties |
| 1999 | £77,494 | 6% |
44 Properties |
| 1998 | £72,705 | 7% |
60 Properties |
| 1997 | £67,325 | 17% |
52 Properties |
| 1996 | £55,822 | 0,3% |
50 Properties |
| 1995 | £55,676 | - |
33 Properties |
Property Price per Property Type in Brading, St Helens And Bembridge
Here you can find historic sold price data in order to help with your property search.
The average Property Paid Price for specific property types in the last three years are:
| Property Type | Average Sold Price | Sold Properties |
|---|---|---|
| Semi Detached House | £269,879.00 | 31 Semi Detached Houses |
| Detached House | £386,942.00 | 45 Detached Houses |
| Terraced House | £215,854.00 | 21 Terraced Houses |
| Flat | £155,181.00 | 7 Flats |

