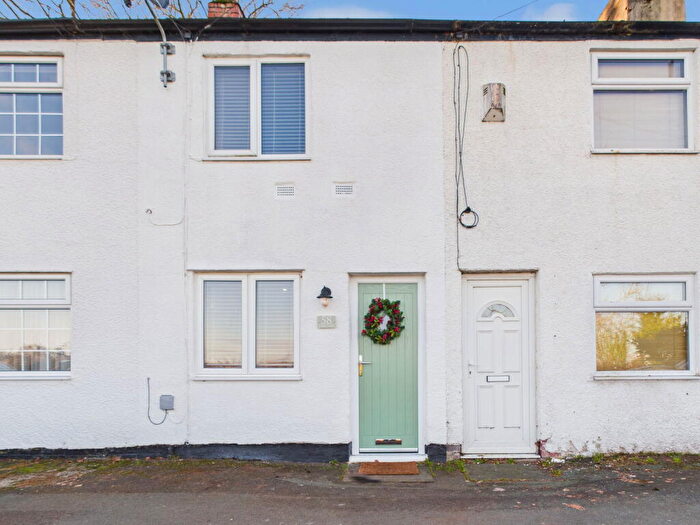
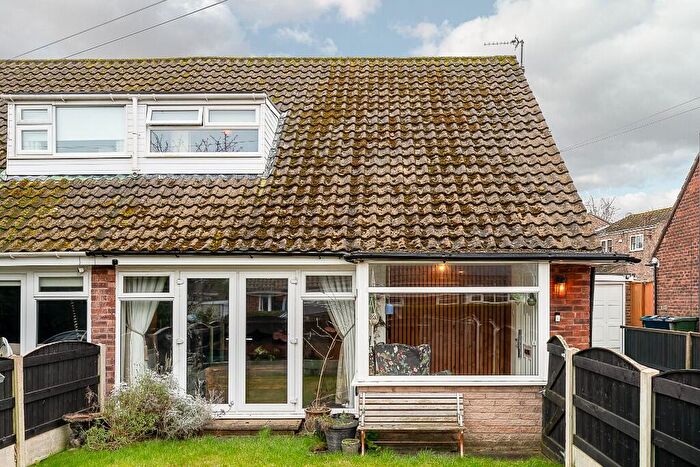
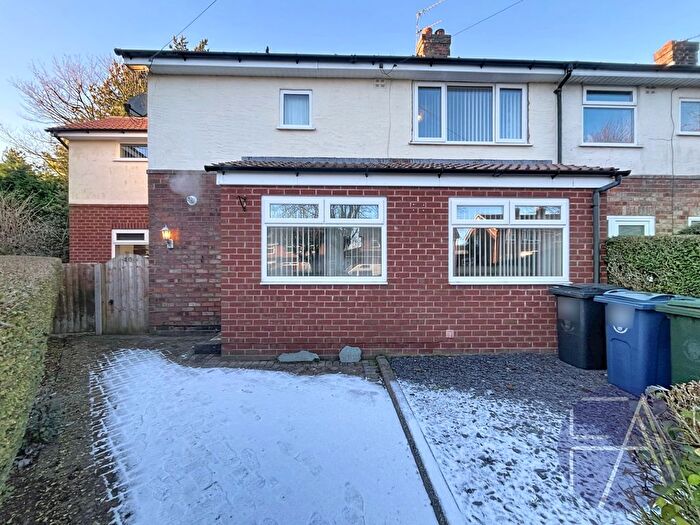
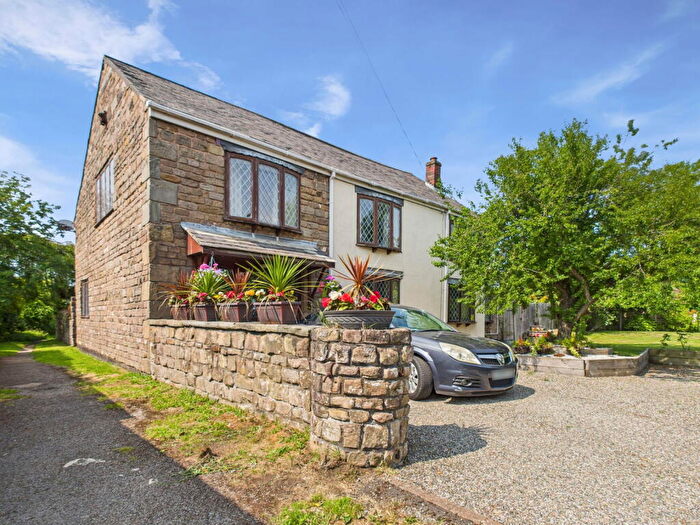
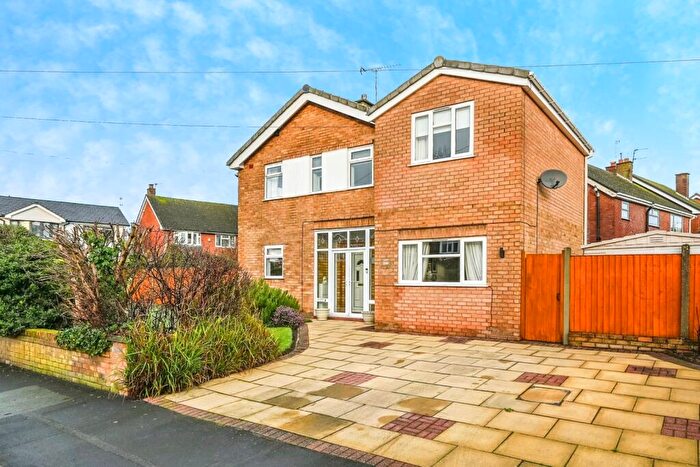
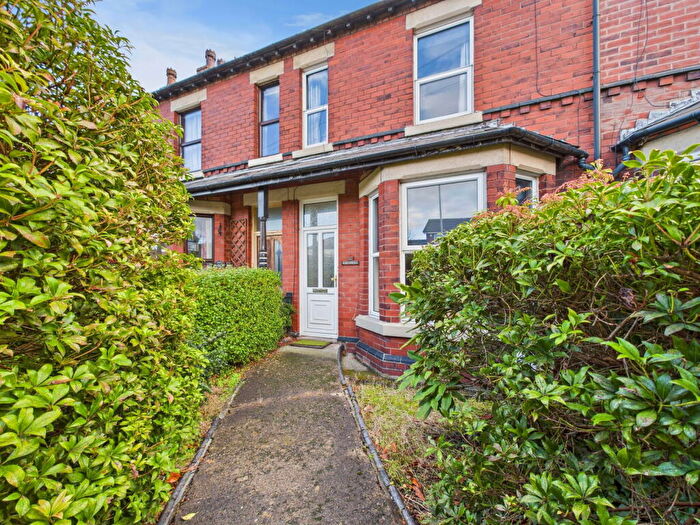
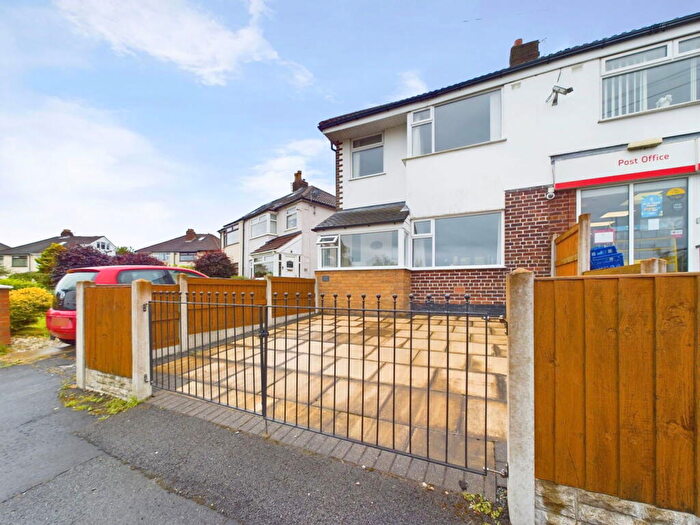
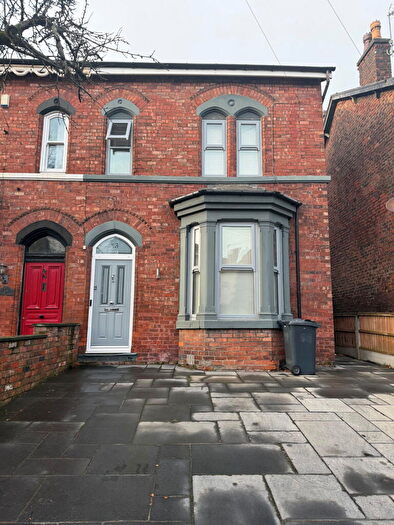
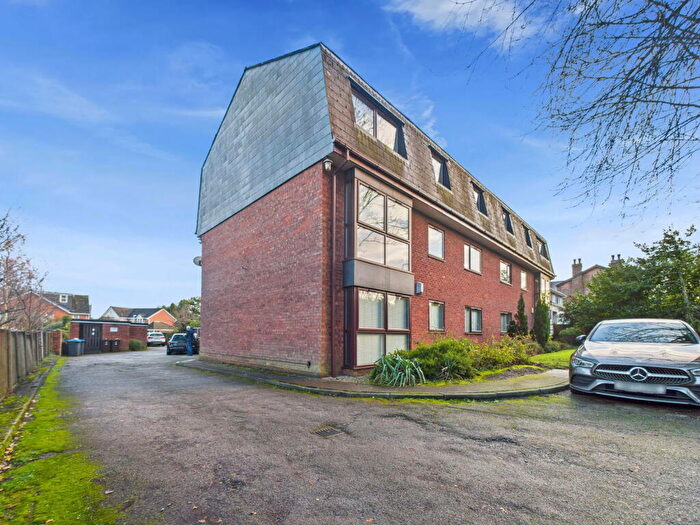
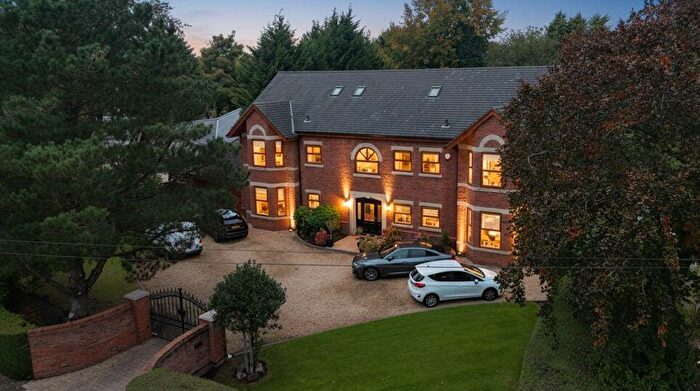
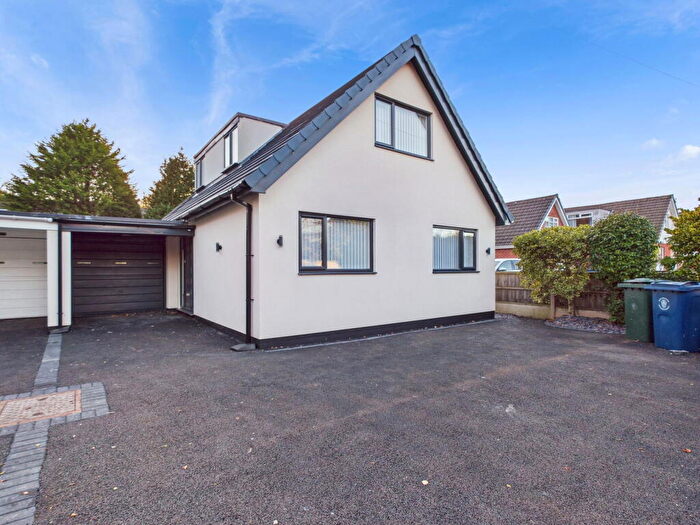
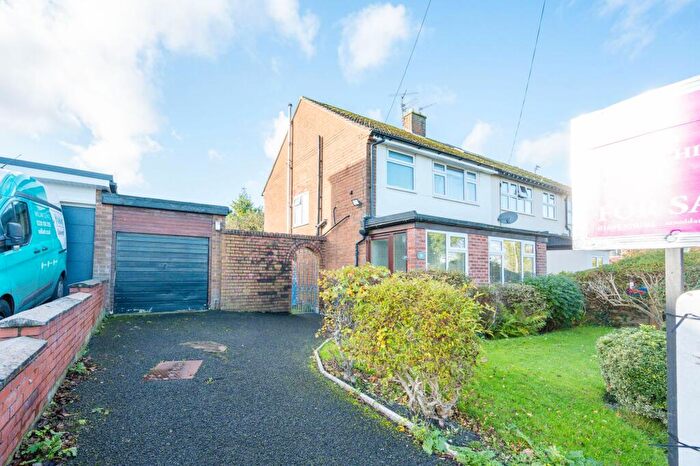
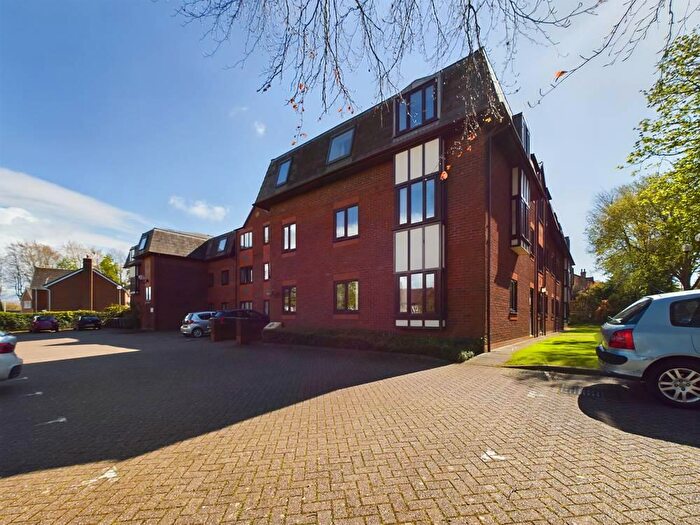
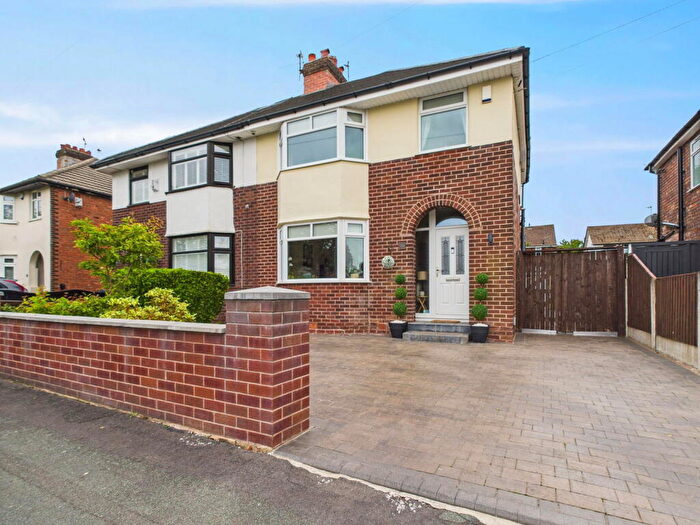
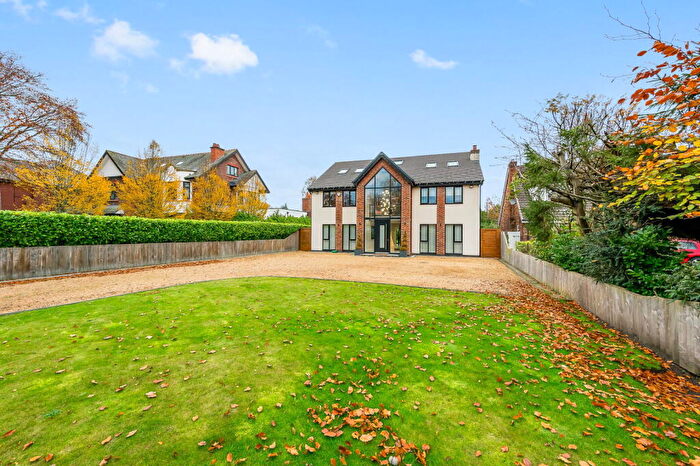
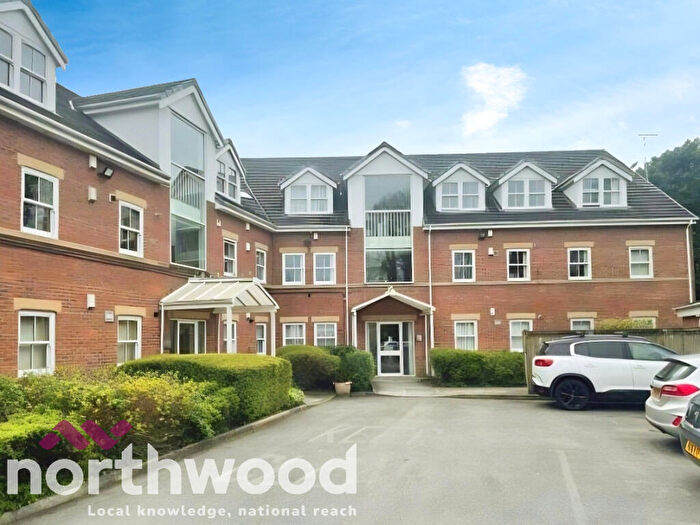
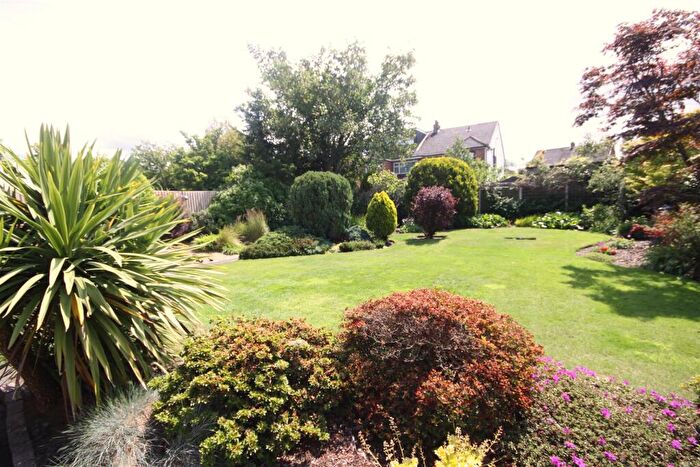
Houses for sale & to rent in Aughton Park, Ormskirk
House Prices in Aughton Park
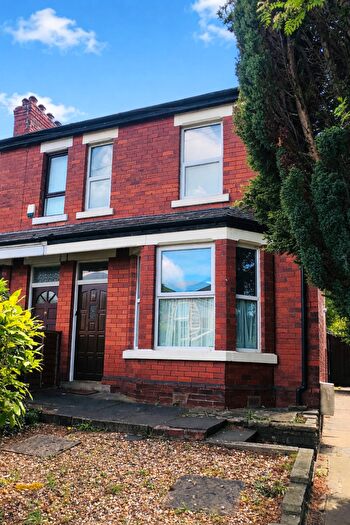
Properties in Aughton Park have an average house price of £398,073.00 and had 198 Property Transactions within the last 3 years¹.
Aughton Park is an area in Ormskirk, Lancashire with 1,506 households², where the most expensive property was sold for £2,950,000.00.
Properties for sale in Aughton Park
Roads and Postcodes in Aughton Park
Navigate through our locations to find the location of your next house in Aughton Park, Ormskirk for sale or to rent.
| Streets | Postcodes |
|---|---|
| Aughton Park Drive | L39 5RA L39 5RB L39 5RD L39 5RE L39 5RF L39 5RJ L39 5RL L39 5QE |
| Beaumont Crescent | L39 5QA |
| Black Moss Lane | L39 4UE L39 4UG |
| Booths Lane | L39 7HE L39 7HF |
| Butterfield Gardens | L39 4XN |
| Carmel Close | L39 5QB |
| Clieves Hills Lane | L39 7HP |
| Convent Close | L39 4XP |
| Cromfield | L39 5AB |
| Cromwell Close | L39 5ET |
| Cut Lane | L39 8RD |
| Cygnet Close | L39 5QH |
| Delph Close | L39 5QF |
| Drake Close | L39 5QL |
| Ennerdale Drive | L39 5EA L39 5HF |
| Eskdale Avenue | L39 5EU L39 5EX |
| Fir Tree Lane | L39 7HH |
| Firs Lane | L39 7HL |
| Formby Lane | L39 7HG |
| Gaw Hill Lane | L39 3LR L39 7HA L39 3LS |
| Gaw Hill View | L39 3QX |
| Greenbank | L39 5JX |
| Greenwood Close | L39 5BL |
| Greystokes | L39 5HE |
| Hallmoor Close | L39 4UQ |
| Haven Brow | L39 5BE |
| Holly Lane | L39 7HB |
| Liverpool Road | L39 3LL L39 3LW L39 5AP L39 3LN |
| Long Lane | L39 5AS L39 5AT L39 5BT L39 5BU L39 5BY L39 5BZ L39 5DA L39 9EE L39 5DB |
| Lynwood Avenue | L39 5BB |
| Lynwood End | L39 5JA |
| Mallard Close | L39 5QJ |
| Martin Close | L39 4AT |
| Meadow Drive | L39 5BD |
| Moss Bank | L39 5DD |
| Moss Delph Lane | L39 5BH L39 5BJ L39 5DY |
| Moss Nook | L39 5QS |
| Mount Carmel Gardens | L39 5BF |
| Narrow Lane | L39 7HD L39 7LJ |
| New Lane | L39 4UD |
| Orchard View | L39 5AD |
| Parrs Lane | L39 5BP |
| Pine Crest | L39 5HX |
| Prescot Road | L39 4SN L39 5AE L39 5AG L39 5AF |
| Quarry Green | L39 5FA |
| Red Fold | L39 4TX |
| Redsands | L39 4SG L39 4SQ |
| Rose Place | L39 4UJ |
| Rosehill Drive | L39 5AA |
| Rothwell Drive | L39 5AN L39 5AW |
| Ryder Close | L39 5HJ |
| Ryder Crescent | L39 5EY L39 5EZ |
| Sandfield Park | L39 5JQ |
| Scarth Hill Lane | L39 4UH |
| Shepherds Lane | L39 7LB |
| Sherwood Avenue | L39 5BA |
| Spencers Close | L39 4AZ |
| Standhouse Lane | L39 5AR |
| Swan Delph | L39 5QG |
| Swanpool Lane | L39 5AX L39 5AY L39 5AZ |
| Teal Close | L39 5QQ |
| The Acorns | L39 5FB |
| The Hollies | L39 7LE |
| The Paddock | L39 4TU |
| Turnpike Road | L39 3LF |
| Victoria Road | L39 5AU |
| Westhaven Crescent | L39 5BN L39 5BW |
Transport near Aughton Park
- FAQ
- Price Paid By Year
- Property Type Price
Frequently asked questions about Aughton Park
What is the average price for a property for sale in Aughton Park?
The average price for a property for sale in Aughton Park is £398,073. This amount is 28% higher than the average price in Ormskirk. There are 993 property listings for sale in Aughton Park.
What streets have the most expensive properties for sale in Aughton Park?
The streets with the most expensive properties for sale in Aughton Park are The Acorns at an average of £675,000, Swanpool Lane at an average of £671,500 and Prescot Road at an average of £641,857.
What streets have the most affordable properties for sale in Aughton Park?
The streets with the most affordable properties for sale in Aughton Park are Carmel Close at an average of £161,000, Pine Crest at an average of £165,000 and Rothwell Drive at an average of £206,500.
Which train stations are available in or near Aughton Park?
Some of the train stations available in or near Aughton Park are Aughton Park, Town Green and Ormskirk.
Property Price Paid in Aughton Park by Year
The average sold property price by year was:
| Year | Average Sold Price | Price Change |
Sold Properties
|
|---|---|---|---|
| 2025 | £419,343 | -3% |
22 Properties |
| 2024 | £432,456 | 7% |
62 Properties |
| 2023 | £400,514 | 13% |
60 Properties |
| 2022 | £347,220 | -18% |
54 Properties |
| 2021 | £411,414 | 22% |
82 Properties |
| 2020 | £321,767 | -1% |
67 Properties |
| 2019 | £326,244 | -4% |
58 Properties |
| 2018 | £338,811 | -2% |
79 Properties |
| 2017 | £344,064 | 9% |
90 Properties |
| 2016 | £314,284 | 4% |
87 Properties |
| 2015 | £301,859 | 10% |
73 Properties |
| 2014 | £270,306 | -7% |
58 Properties |
| 2013 | £289,125 | 15% |
60 Properties |
| 2012 | £245,683 | -2% |
47 Properties |
| 2011 | £251,095 | -11% |
33 Properties |
| 2010 | £278,276 | 4% |
42 Properties |
| 2009 | £268,490 | -3% |
42 Properties |
| 2008 | £275,395 | -23% |
36 Properties |
| 2007 | £340,062 | 23% |
64 Properties |
| 2006 | £260,709 | -16% |
56 Properties |
| 2005 | £302,570 | 18% |
48 Properties |
| 2004 | £249,100 | 17% |
55 Properties |
| 2003 | £206,525 | 13% |
70 Properties |
| 2002 | £178,758 | 9% |
88 Properties |
| 2001 | £162,937 | 11% |
63 Properties |
| 2000 | £145,661 | 22% |
66 Properties |
| 1999 | £114,280 | 10% |
85 Properties |
| 1998 | £102,612 | -2% |
86 Properties |
| 1997 | £104,608 | 11% |
73 Properties |
| 1996 | £92,705 | 4% |
47 Properties |
| 1995 | £88,541 | - |
48 Properties |
Property Price per Property Type in Aughton Park
Here you can find historic sold price data in order to help with your property search.
The average Property Paid Price for specific property types in the last three years are:
| Property Type | Average Sold Price | Sold Properties |
|---|---|---|
| Semi Detached House | £307,183.00 | 62 Semi Detached Houses |
| Detached House | £574,235.00 | 82 Detached Houses |
| Terraced House | £222,598.00 | 26 Terraced Houses |
| Flat | £246,373.00 | 28 Flats |

