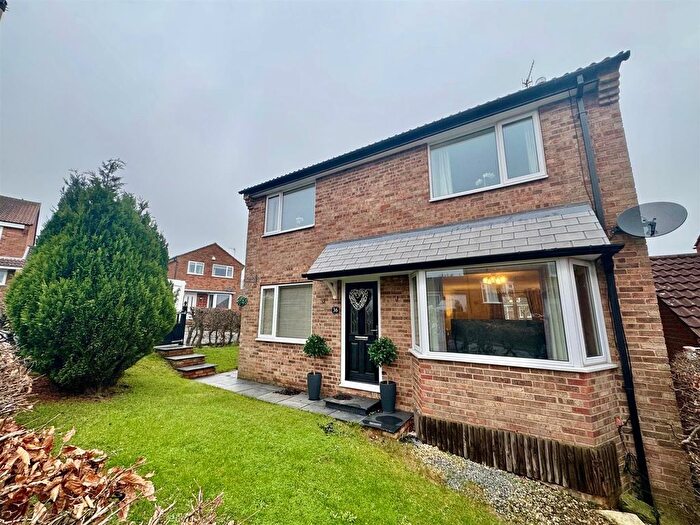
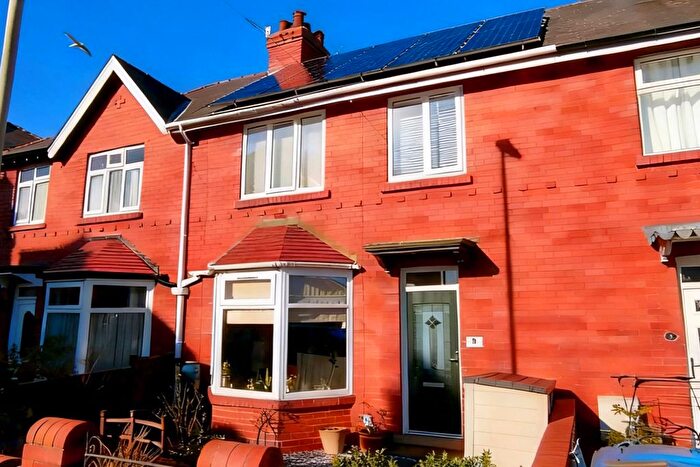
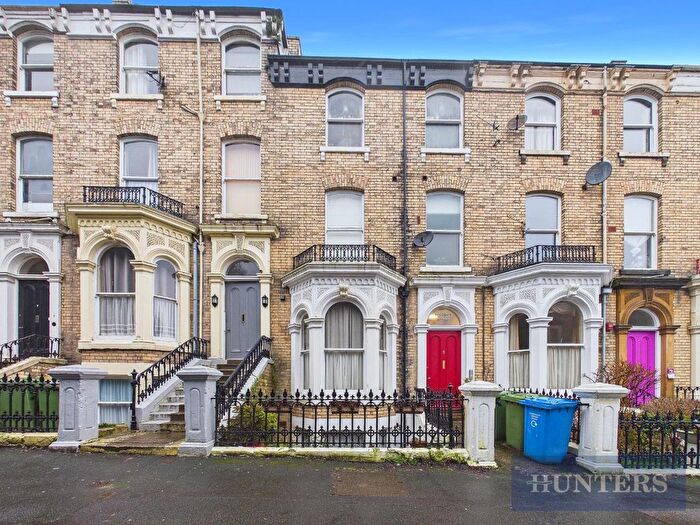
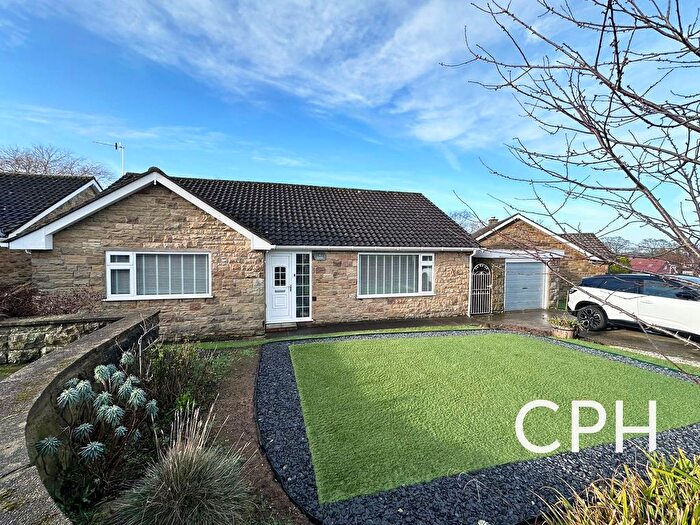
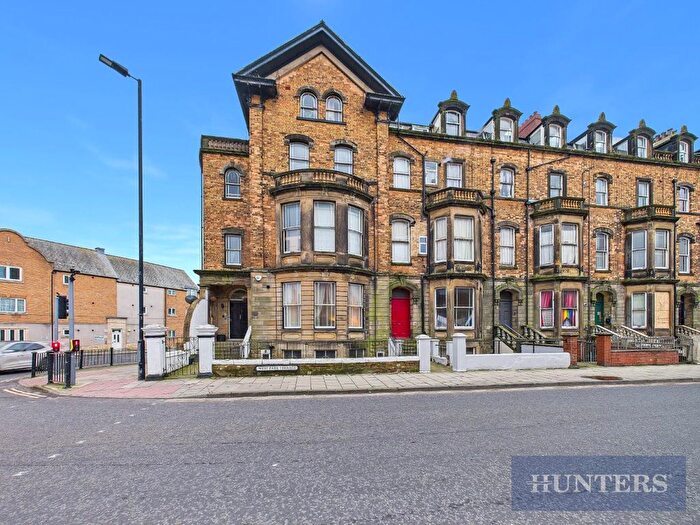
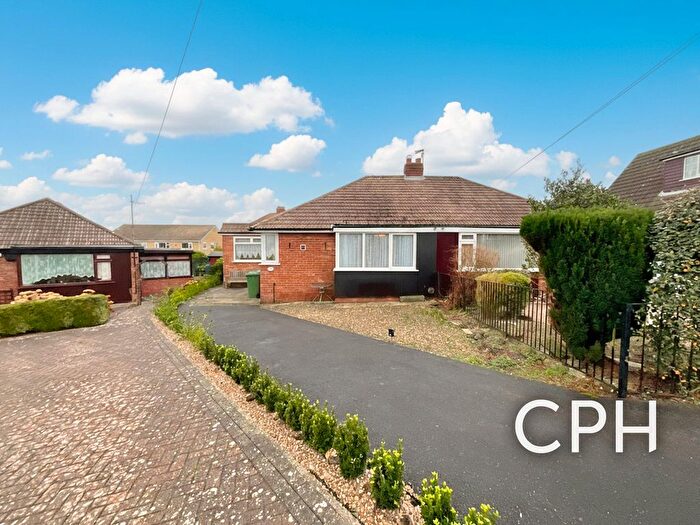
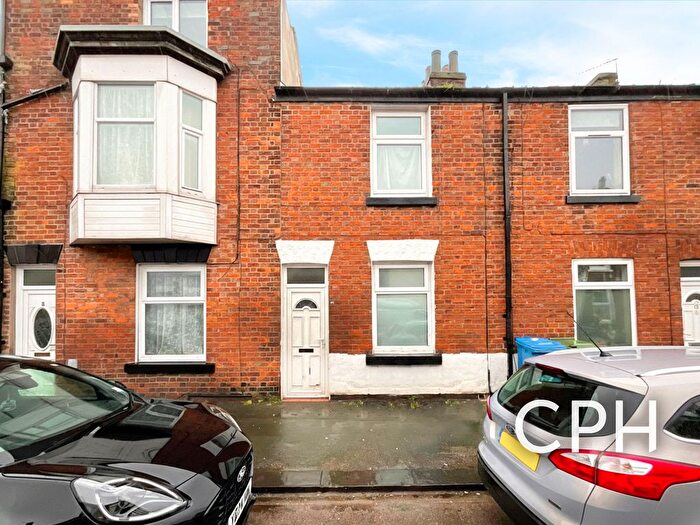
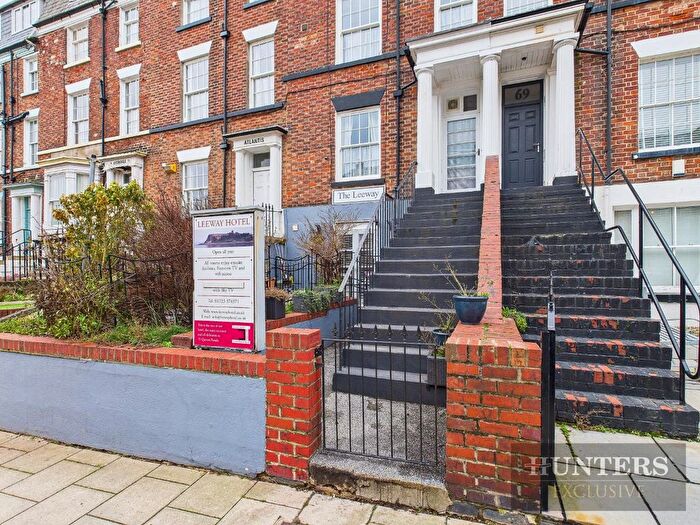
Houses for sale & to rent in Woodlands, Scarborough
House Prices in Woodlands
Properties in Woodlands have an average house price of £206,493.00 and had 112 Property Transactions within the last 3 years¹.
Woodlands is an area in Scarborough, North Yorkshire with 2,055 households², where the most expensive property was sold for £550,000.00.
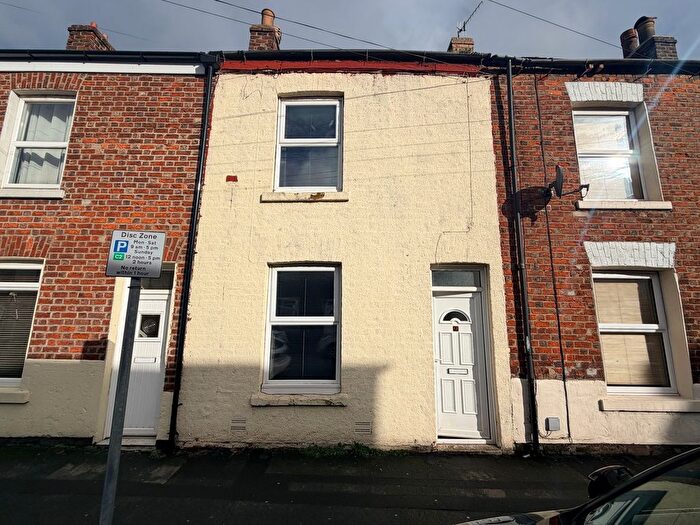
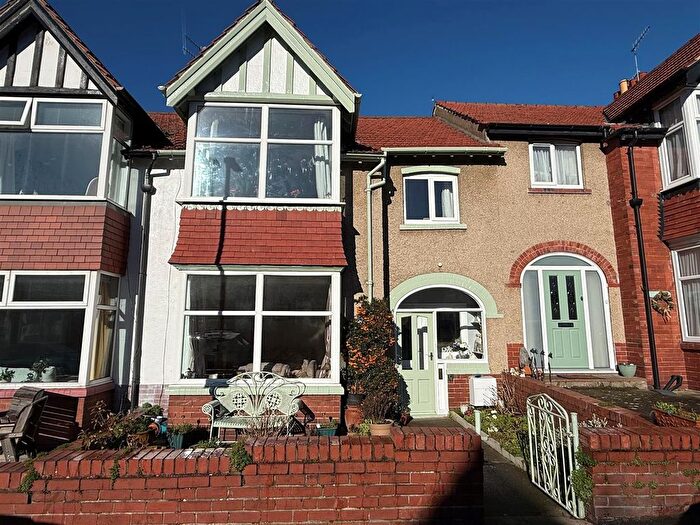
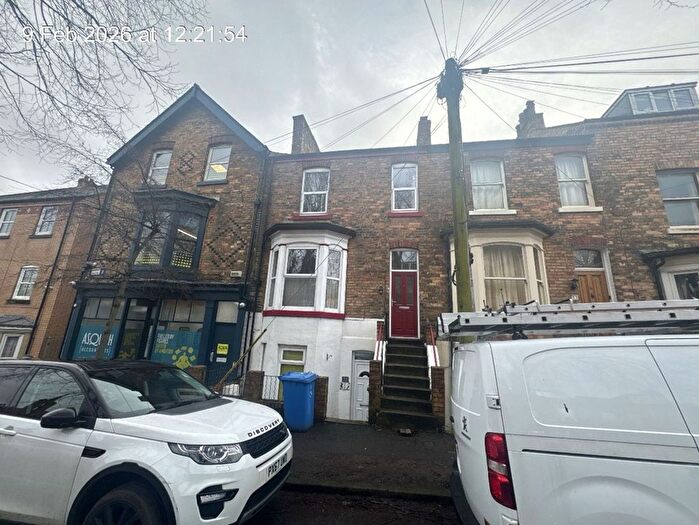
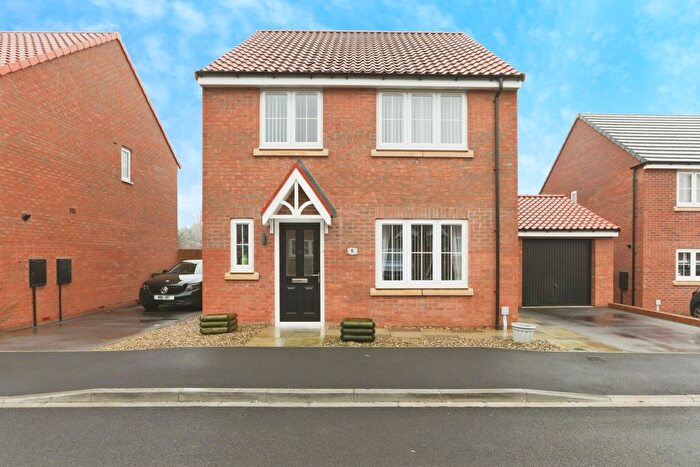
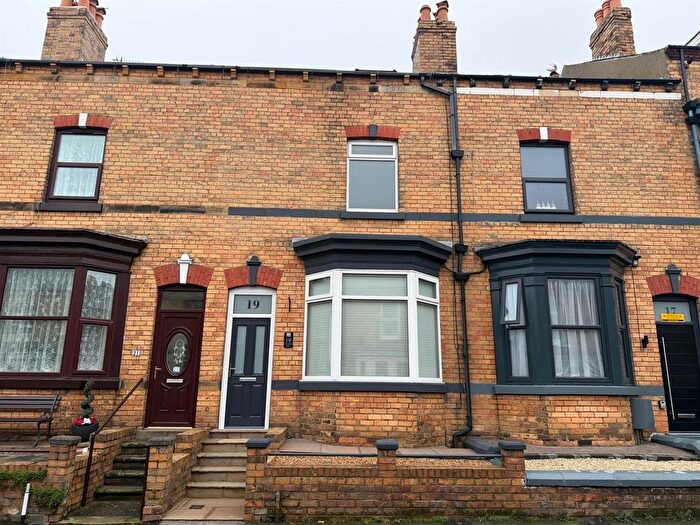
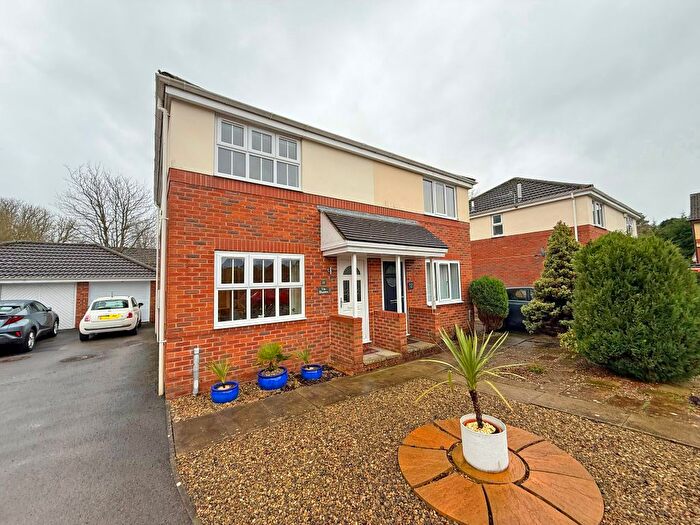
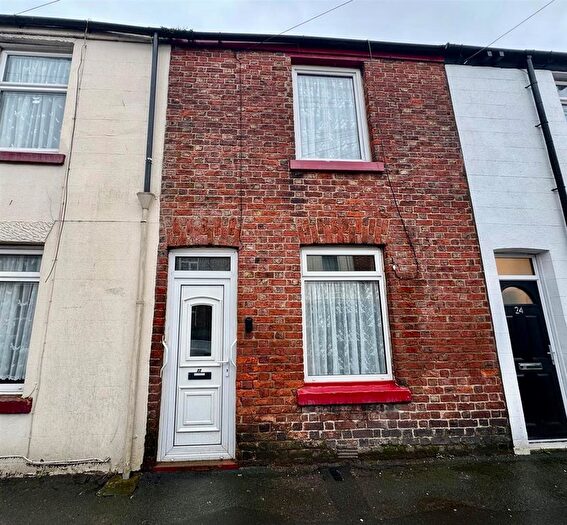
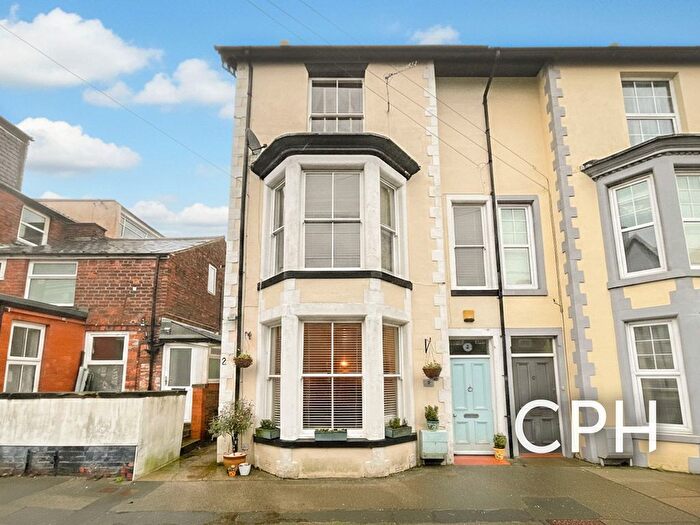
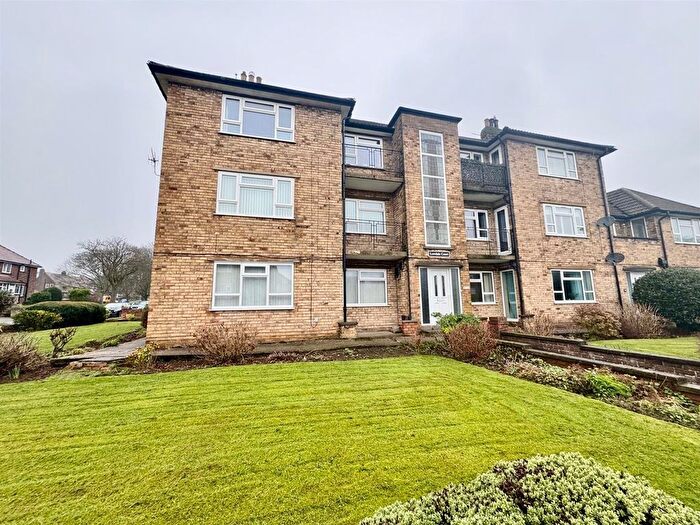
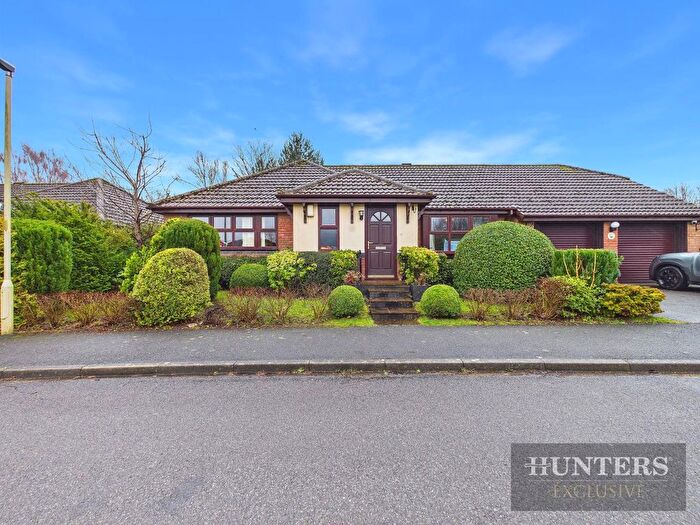
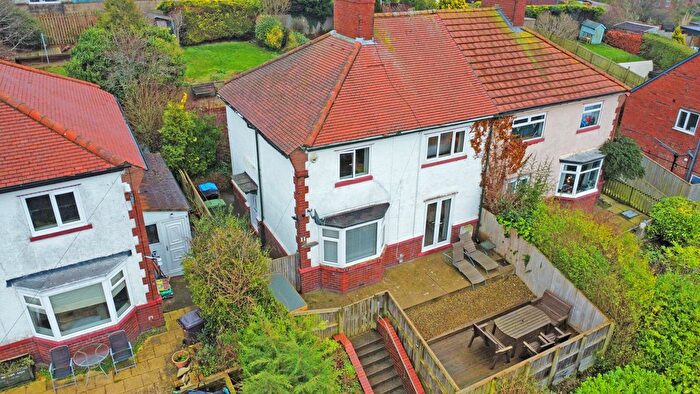
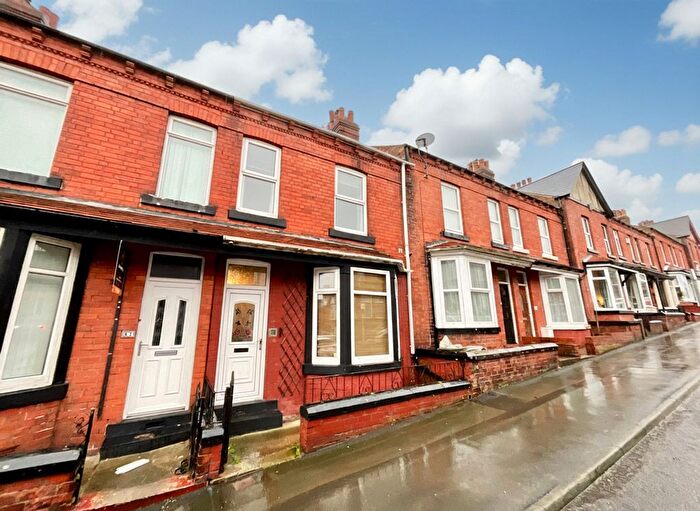
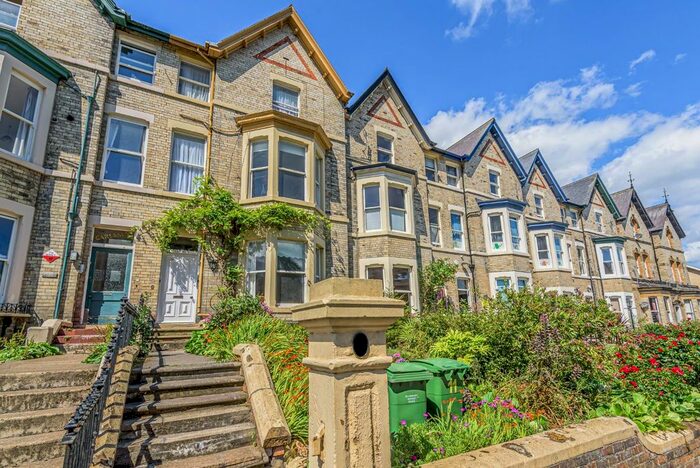
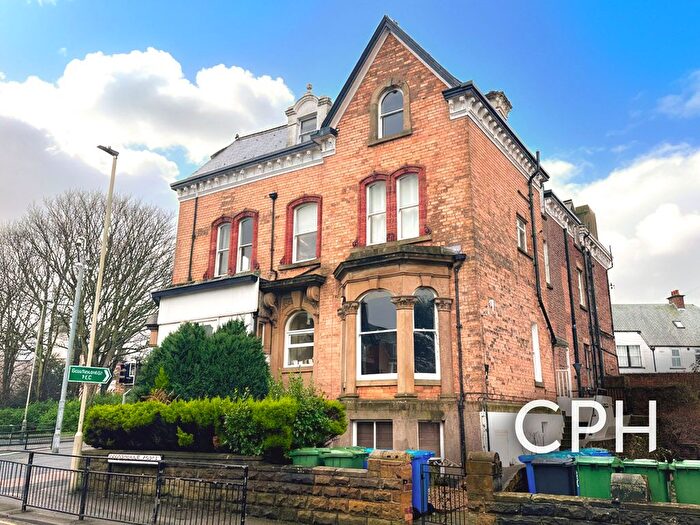
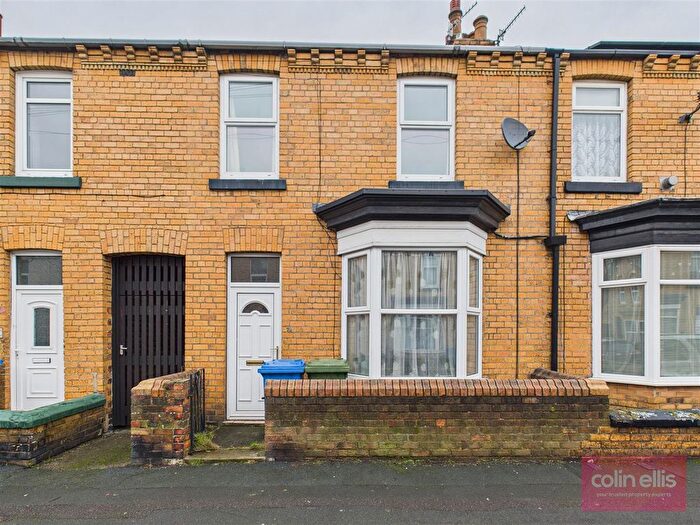
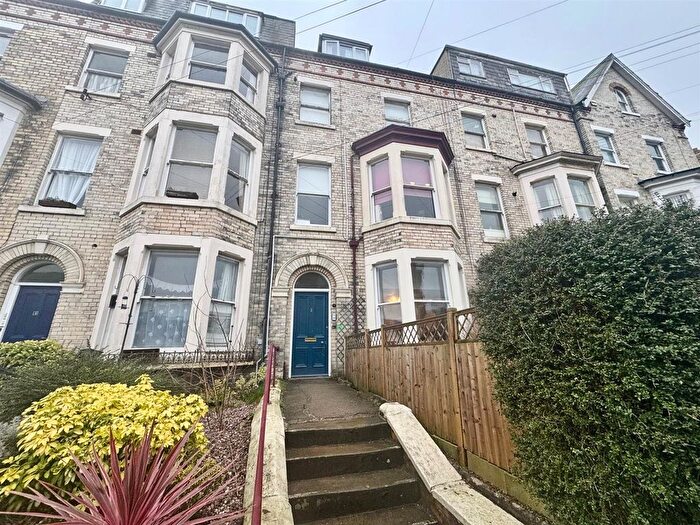
Properties for sale in Woodlands
Roads and Postcodes in Woodlands
Navigate through our locations to find the location of your next house in Woodlands, Scarborough for sale or to rent.
| Streets | Postcodes |
|---|---|
| Ash Grove | YO12 6NJ |
| Barrowcliff Road | YO12 6EX YO12 6EY YO12 6EZ |
| Bickley Howe | YO12 5TR |
| Billow Drive | YO12 6BF |
| Bracken Hill | YO12 6HB |
| Briercliffe | YO12 6NR YO12 6NS |
| Caburn Close | YO12 5DY |
| Cherry Tree Avenue | YO12 5DX YO12 5HL |
| Colescliffe Crescent | YO12 6SW |
| Colescliffe Road | YO12 6SA YO12 6SB |
| Corn Mill Gardens | YO12 6EJ |
| Coverdale Drive | YO12 5TP |
| Cropton Rise | YO12 5TS |
| Dalby Close | YO12 5HH |
| Gildercliffe | YO12 6NT YO12 6NU YO12 6NX |
| Gillylees | YO12 5DR |
| Hatterboard Drive | YO12 6NG YO12 6NQ |
| Hildenley Close | YO12 5DU |
| Hovingham Drive | YO12 5DQ YO12 5DT YO12 5XT |
| Lady Ediths Drive | YO12 5RJ YO12 5RL YO12 5RN |
| Leppington Drive | YO12 5DZ |
| Loftus Close | YO12 5TU |
| Manor Road | YO12 7BE |
| North Leas Avenue | YO12 6LX |
| Northstead Flats | YO12 6BH |
| Oxcliff | YO12 6HA |
| Oxpasture Close | YO12 5HJ |
| Pinewood Drive | YO12 5JL |
| Plaxton Court | YO12 6QT |
| Prospect Bank | YO12 6ER |
| Prospect Crescent | YO12 6ES |
| Prospect Mount Road | YO12 6EN YO12 6EW |
| Prospect Park | YO12 6ET |
| Quaker Close | YO12 5QZ |
| Redcliffe Court | YO12 6EL |
| Redcliffe Gardens | YO12 6SU |
| Redcliffe Road | YO12 6EU |
| Rowan Close | YO12 6NH |
| Ryndle Crescent | YO12 6AQ |
| Scalby Road | YO12 6TB YO12 6TE YO12 6QJ |
| Selley Park Drive | YO12 5TT |
| Settrington Road | YO12 5DL |
| Sinclair Court | YO12 7SD |
| Skiplam Close | YO12 5DS |
| St Leonards Crescent | YO12 6SP YO12 6SR |
| St Lukes Crescent | YO12 6TD |
| Stepney Drive | YO12 5DP |
| Stepney Road | YO12 5NJ |
| The Copse | YO12 5HG |
| The Spinney | YO12 5HQ |
| Weydale Avenue | YO12 6AX YO12 6BA YO12 6BB |
| Woodland Grove | YO12 6NF YO12 6NE |
| Woodland Place | YO12 6EP |
| Woodland Ravine | YO12 6TA |
| Woodland Walk | YO12 6HG |
| Woodlands Avenue | YO12 6HF |
| Woodlands Drive | YO12 6QN YO12 6QL YO12 6QW |
| Wreyfield Drive | YO12 6NN |
| YO12 5TQ YO12 6HE YO12 6PB |
Transport near Woodlands
- FAQ
- Price Paid By Year
- Property Type Price
Frequently asked questions about Woodlands
What is the average price for a property for sale in Woodlands?
The average price for a property for sale in Woodlands is £206,493. This amount is 0.18% higher than the average price in Scarborough. There are 2,823 property listings for sale in Woodlands.
What streets have the most expensive properties for sale in Woodlands?
The streets with the most expensive properties for sale in Woodlands are Stepney Drive at an average of £533,333, Bickley Howe at an average of £393,500 and Gillylees at an average of £387,500.
What streets have the most affordable properties for sale in Woodlands?
The streets with the most affordable properties for sale in Woodlands are Barrowcliff Road at an average of £103,375, St Leonards Crescent at an average of £107,000 and Oxcliff at an average of £115,000.
Which train stations are available in or near Woodlands?
Some of the train stations available in or near Woodlands are Scarborough, Seamer and Filey.
Property Price Paid in Woodlands by Year
The average sold property price by year was:
| Year | Average Sold Price | Price Change |
Sold Properties
|
|---|---|---|---|
| 2025 | £220,654 | 8% |
24 Properties |
| 2024 | £203,018 | 0,5% |
53 Properties |
| 2023 | £202,045 | 12% |
35 Properties |
| 2022 | £176,929 | -2% |
51 Properties |
| 2021 | £180,301 | 2% |
61 Properties |
| 2020 | £176,928 | 12% |
50 Properties |
| 2019 | £156,356 | -1% |
58 Properties |
| 2018 | £157,445 | -0,3% |
46 Properties |
| 2017 | £157,851 | 6% |
55 Properties |
| 2016 | £147,798 | -2% |
63 Properties |
| 2015 | £151,109 | 15% |
50 Properties |
| 2014 | £127,819 | -17% |
49 Properties |
| 2013 | £148,916 | 8% |
49 Properties |
| 2012 | £137,196 | -13% |
28 Properties |
| 2011 | £154,745 | 11% |
24 Properties |
| 2010 | £138,069 | 11% |
43 Properties |
| 2009 | £123,097 | -14% |
47 Properties |
| 2008 | £139,840 | -8% |
34 Properties |
| 2007 | £151,684 | -2% |
67 Properties |
| 2006 | £155,100 | 21% |
65 Properties |
| 2005 | £123,081 | -4% |
43 Properties |
| 2004 | £128,008 | 26% |
63 Properties |
| 2003 | £94,238 | 21% |
64 Properties |
| 2002 | £74,301 | 0,4% |
80 Properties |
| 2001 | £74,011 | 26% |
73 Properties |
| 2000 | £54,775 | 5% |
62 Properties |
| 1999 | £52,275 | -4% |
71 Properties |
| 1998 | £54,623 | -2% |
62 Properties |
| 1997 | £55,514 | 1% |
59 Properties |
| 1996 | £55,030 | 9% |
61 Properties |
| 1995 | £50,185 | - |
57 Properties |
Property Price per Property Type in Woodlands
Here you can find historic sold price data in order to help with your property search.
The average Property Paid Price for specific property types in the last three years are:
| Property Type | Average Sold Price | Sold Properties |
|---|---|---|
| Semi Detached House | £185,137.00 | 48 Semi Detached Houses |
| Detached House | £332,923.00 | 26 Detached Houses |
| Terraced House | £135,159.00 | 22 Terraced Houses |
| Flat | £163,200.00 | 16 Flats |

