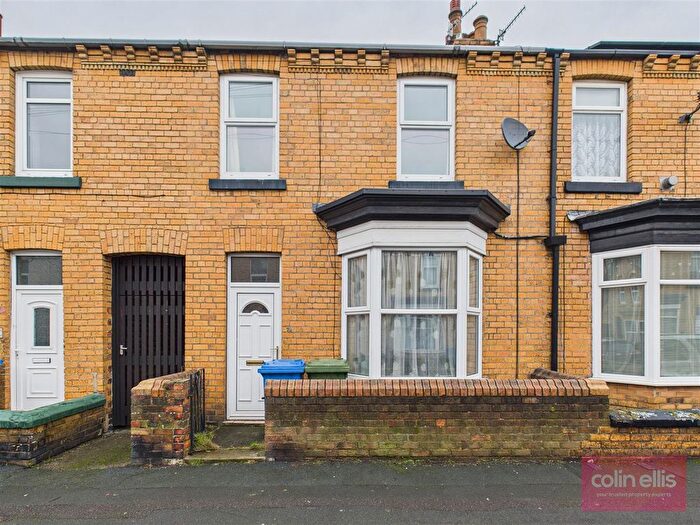
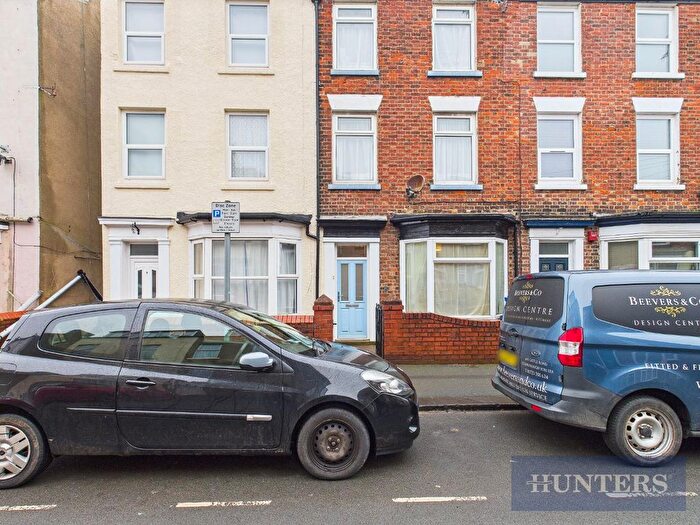
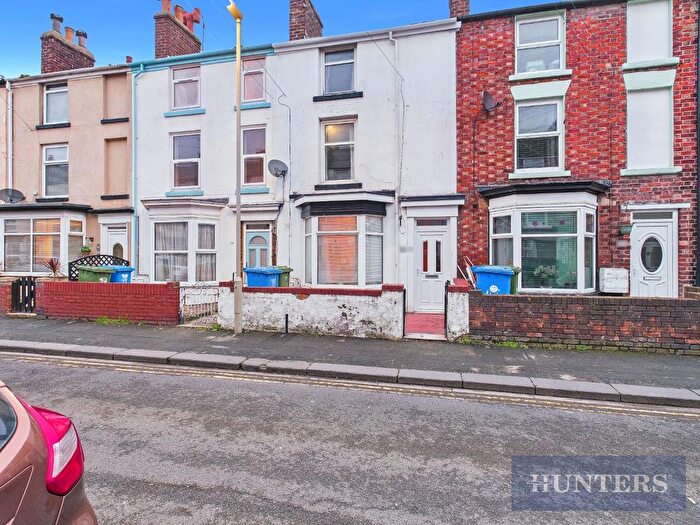
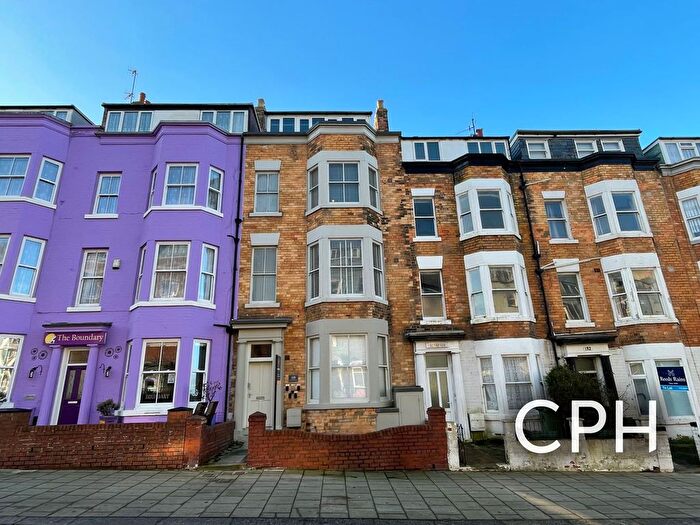
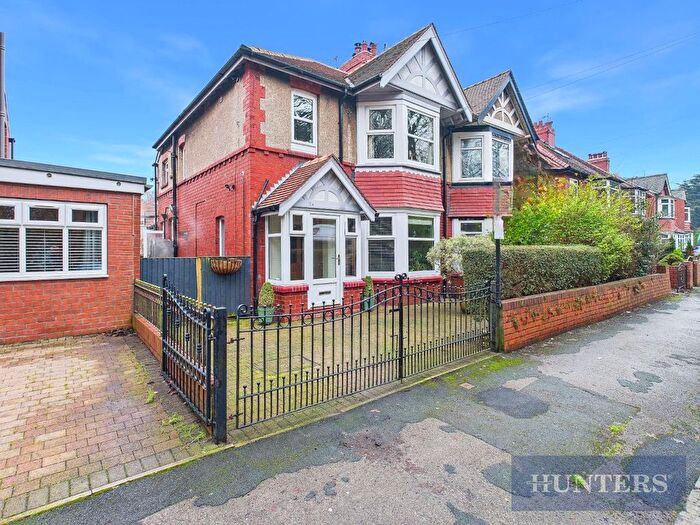
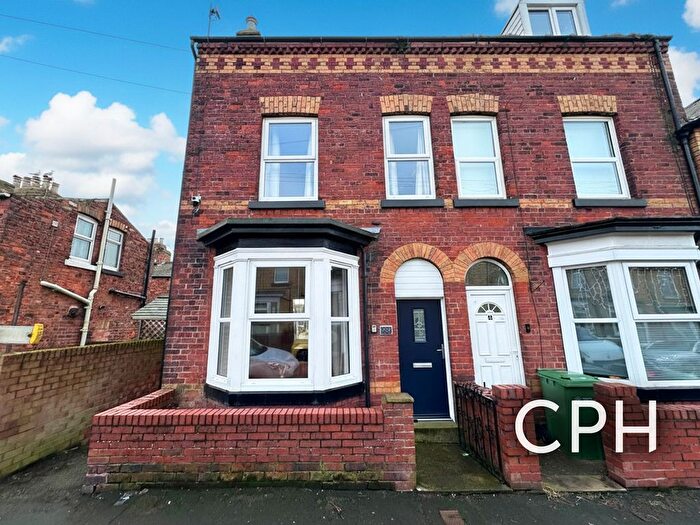
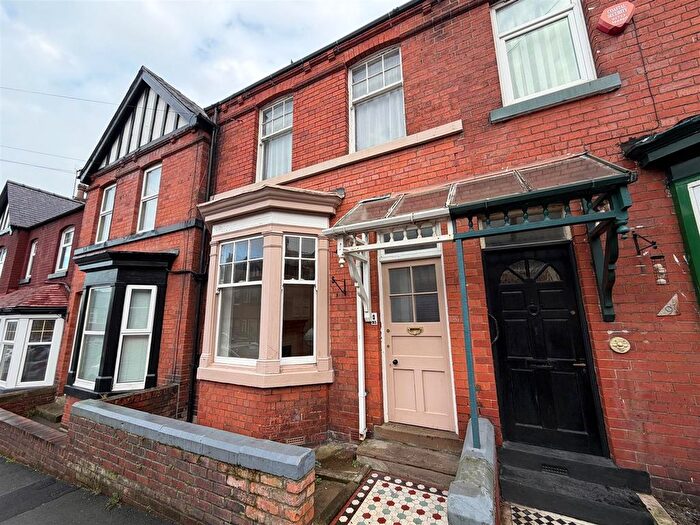
Houses for sale & to rent in Northstead, Scarborough
House Prices in Northstead
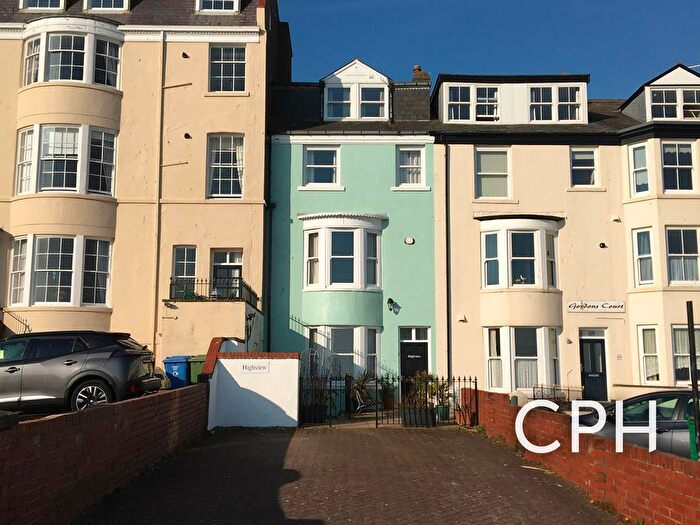
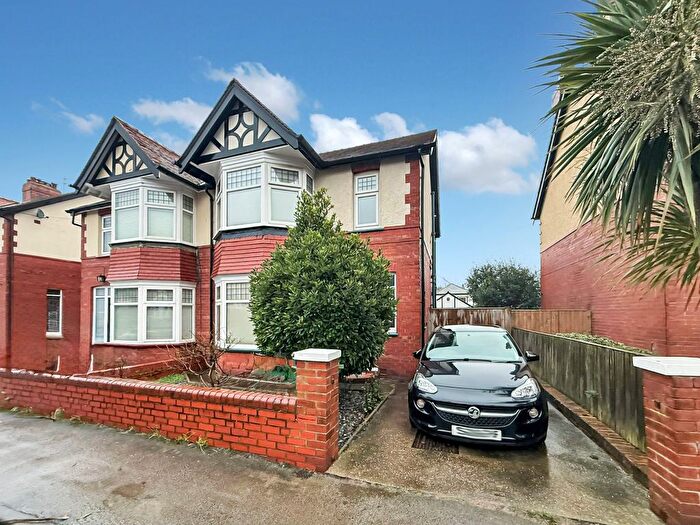
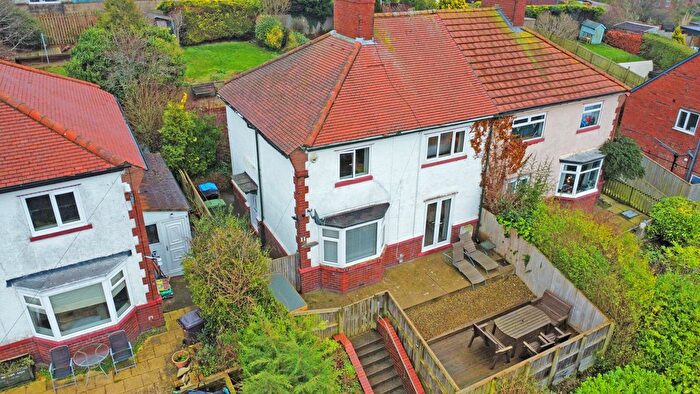
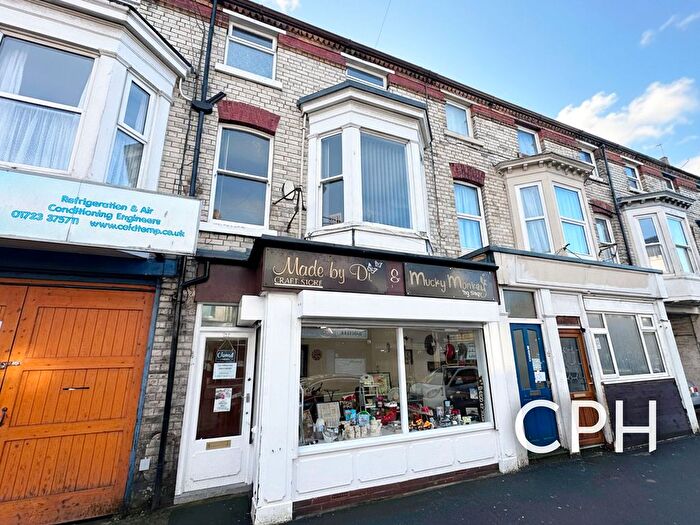
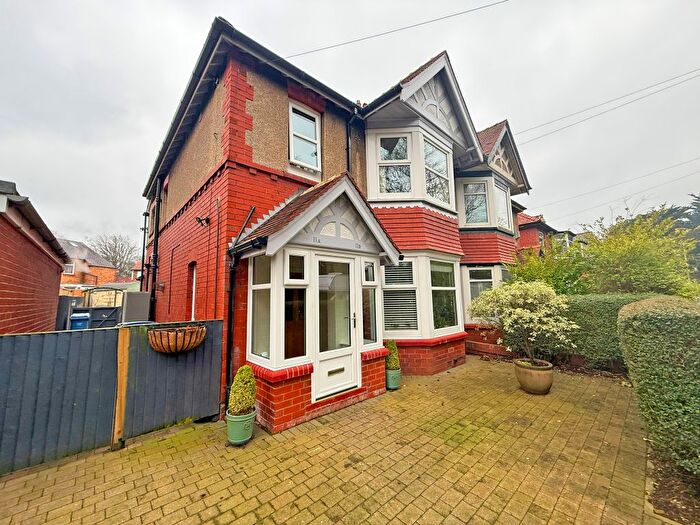
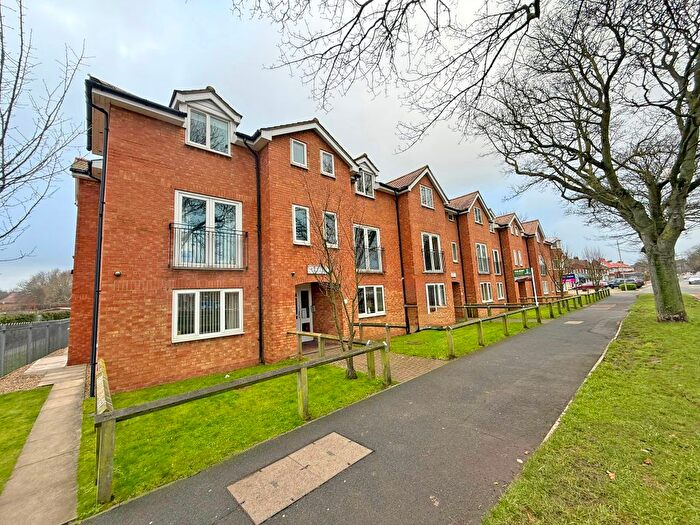
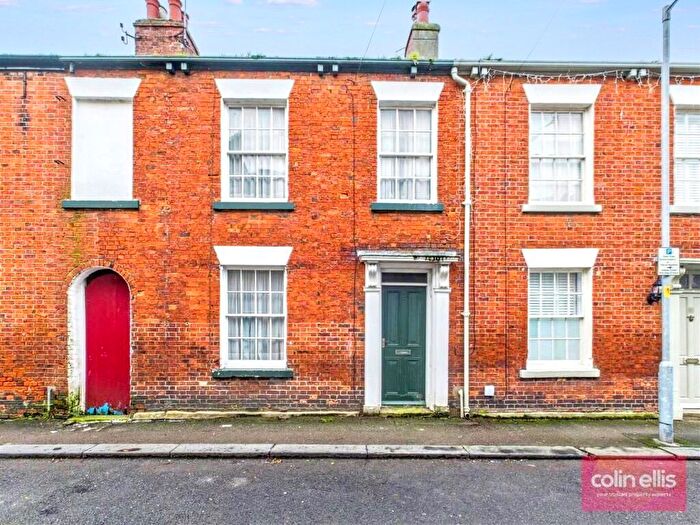
Properties in Northstead have an average house price of £202,433.00 and had 210 Property Transactions within the last 3 years¹.
Northstead is an area in Scarborough, North Yorkshire with 1,839 households², where the most expensive property was sold for £532,500.00.
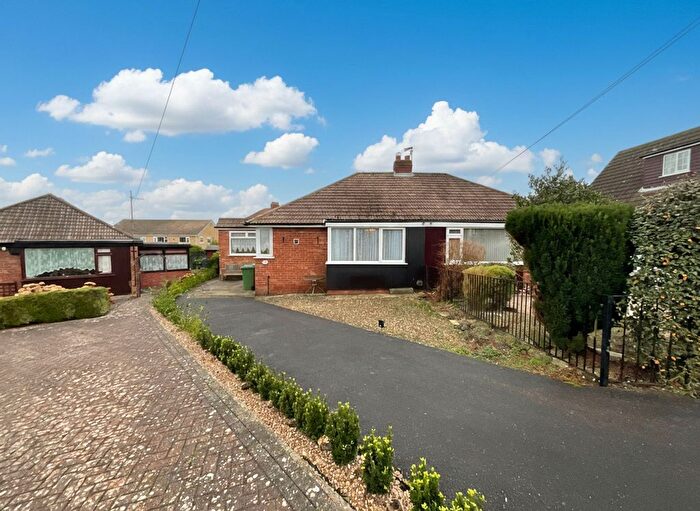
Properties for sale in Northstead
Roads and Postcodes in Northstead
Navigate through our locations to find the location of your next house in Northstead, Scarborough for sale or to rent.
| Streets | Postcodes |
|---|---|
| Albert Road | YO12 7HA |
| Ashville Avenue | YO12 7NF |
| Bedale Avenue | YO12 6JY YO12 6JZ |
| Beechville Avenue | YO12 7NG |
| Blenheim Street | YO12 7EU |
| Blenheim Terrace | YO12 7BF |
| Broadway | YO12 6BG |
| Broom Walk | YO12 6LU |
| Burniston Road | YO12 6PG YO12 6PQ YO12 6PF |
| Caledonia Street | YO12 7DX |
| Cecil Court | YO12 6AE |
| Chatsworth Gardens | YO12 7NQ |
| Clark Street | YO12 7QQ |
| Dean Road | YO12 7JH |
| Devonshire Drive | YO12 7NH |
| Dovedale Avenue | YO12 6JX |
| Elmville Avenue | YO12 7NL YO12 7NN |
| Fieldside | YO12 6BD YO12 6BE |
| Garfield Road | YO12 7LL |
| Givendale Road | YO12 6LB YO12 6LD YO12 6LE YO12 6LF YO12 6LG |
| Glenside | YO12 6BN |
| High Walk | YO12 6BL |
| Highdale Road | YO12 6LL |
| Holly Walk | YO12 6LS |
| Lilac Walk | YO12 6LT |
| Long Walk | YO12 6BQ |
| Lowdale Avenue | YO12 6JN YO12 6JP YO12 6JR YO12 6JS YO12 6JW |
| Lower Clark Street Industrial Estate | YO12 7PP |
| Lower William Street | YO12 7PL |
| Lyell Street | YO12 7LW |
| Manor Gardens | YO12 7RS |
| Manor Road | YO12 7RT YO12 7RL |
| Maple Drive | YO12 6LP YO12 6LR YO12 6LW |
| Mayville Avenue | YO12 7NP YO12 7NW |
| Middle Walk | YO12 6BJ |
| Nansen Street | YO12 7LN |
| Nares Street | YO12 7RR |
| North Leas Avenue | YO12 6JH YO12 6JJ YO12 6JL YO12 6JQ YO12 6LH YO12 6LJ YO12 6LN |
| North Leas Shops | YO12 6JG |
| North Marine Road | YO12 7TJ |
| Northcliff Avenue | YO12 6PP |
| Northstead Manor Drive | YO12 6AA YO12 6AB YO12 6AF |
| Northstead Manor Gardens | YO12 6BP |
| Oakville Avenue | YO12 7NR |
| Peasholm Avenue | YO12 7NE |
| Peasholm Crescent | YO12 7QX YO12 7QY |
| Peasholm Drive | YO12 7NA YO12 7NB |
| Peasholm Gap | YO12 7TP |
| Peasholm Gardens | YO12 7ND |
| Prospect Road | YO12 7LB |
| Queens Parade | YO12 7HE YO12 7HX |
| Raleigh Street | YO12 7LQ |
| Ramsey Street | YO12 7LP YO12 7LR |
| Roseville Avenue | YO12 7NS |
| Royal Albert Drive | YO12 7TY |
| Ryndle Walk | YO12 6JT YO12 6JU |
| Ryndleside | YO12 6AD |
| Scardale Crescent | YO12 6LA |
| Strensall Drive | YO12 6QH |
| The Dene | YO12 7NJ |
| Victoria Park Mount | YO12 7RG |
| Weydale Avenue | YO12 6AH YO12 6AJ YO12 6AL YO12 6AN YO12 6AR YO12 6AS YO12 6AT YO12 6AU YO12 6AY YO12 6BW |
| Wheelhouse Square | YO12 7SP |
| Wrea Lane | YO12 7PN |
| YO12 7TQ |
Transport near Northstead
- FAQ
- Price Paid By Year
- Property Type Price
Frequently asked questions about Northstead
What is the average price for a property for sale in Northstead?
The average price for a property for sale in Northstead is £202,433. This amount is 2% lower than the average price in Scarborough. There are 1,520 property listings for sale in Northstead.
What streets have the most expensive properties for sale in Northstead?
The streets with the most expensive properties for sale in Northstead are Burniston Road at an average of £385,833, Ryndle Walk at an average of £318,300 and Scardale Crescent at an average of £316,250.
What streets have the most affordable properties for sale in Northstead?
The streets with the most affordable properties for sale in Northstead are Lilac Walk at an average of £95,000, Cecil Court at an average of £120,000 and Lyell Street at an average of £133,333.
Which train stations are available in or near Northstead?
Some of the train stations available in or near Northstead are Scarborough, Seamer and Filey.
Property Price Paid in Northstead by Year
The average sold property price by year was:
| Year | Average Sold Price | Price Change |
Sold Properties
|
|---|---|---|---|
| 2025 | £204,411 | -2% |
63 Properties |
| 2024 | £208,147 | 6% |
73 Properties |
| 2023 | £195,114 | -1% |
74 Properties |
| 2022 | £196,090 | 13% |
72 Properties |
| 2021 | £170,549 | 5% |
86 Properties |
| 2020 | £162,285 | 8% |
77 Properties |
| 2019 | £148,658 | -1% |
69 Properties |
| 2018 | £150,301 | -6% |
77 Properties |
| 2017 | £158,817 | 8% |
67 Properties |
| 2016 | £145,889 | 7% |
81 Properties |
| 2015 | £135,005 | -8% |
81 Properties |
| 2014 | £145,856 | 10% |
75 Properties |
| 2013 | £131,629 | 3% |
70 Properties |
| 2012 | £127,595 | -1% |
58 Properties |
| 2011 | £129,220 | -7% |
58 Properties |
| 2010 | £137,934 | 5% |
42 Properties |
| 2009 | £131,724 | -15% |
49 Properties |
| 2008 | £151,689 | -1% |
54 Properties |
| 2007 | £153,210 | 10% |
98 Properties |
| 2006 | £138,400 | 2% |
102 Properties |
| 2005 | £136,076 | 5% |
78 Properties |
| 2004 | £129,089 | 13% |
79 Properties |
| 2003 | £111,772 | 29% |
122 Properties |
| 2002 | £79,753 | 15% |
108 Properties |
| 2001 | £67,996 | 16% |
108 Properties |
| 2000 | £57,315 | 8% |
105 Properties |
| 1999 | £52,622 | 6% |
125 Properties |
| 1998 | £49,697 | -0,5% |
109 Properties |
| 1997 | £49,941 | 5% |
92 Properties |
| 1996 | £47,290 | -4% |
77 Properties |
| 1995 | £49,254 | - |
69 Properties |
Property Price per Property Type in Northstead
Here you can find historic sold price data in order to help with your property search.
The average Property Paid Price for specific property types in the last three years are:
| Property Type | Average Sold Price | Sold Properties |
|---|---|---|
| Semi Detached House | £242,784.00 | 72 Semi Detached Houses |
| Detached House | £374,730.00 | 13 Detached Houses |
| Terraced House | £170,248.00 | 87 Terraced Houses |
| Flat | £140,723.00 | 38 Flats |

