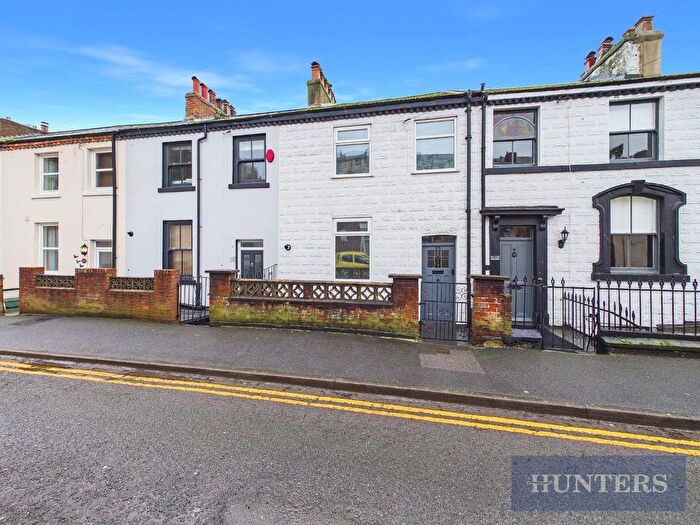
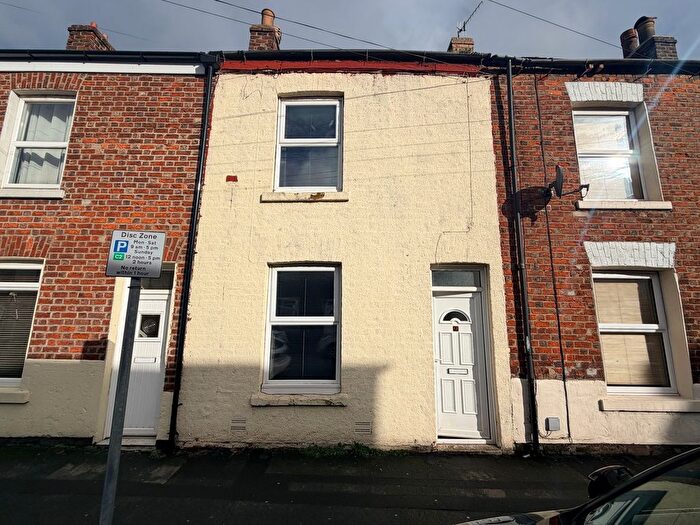
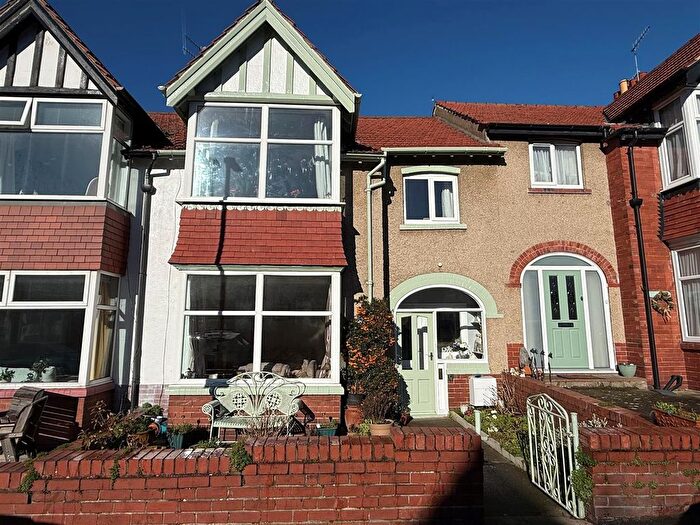
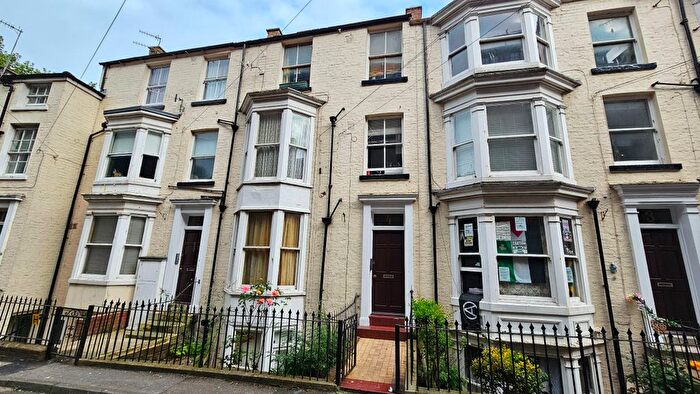
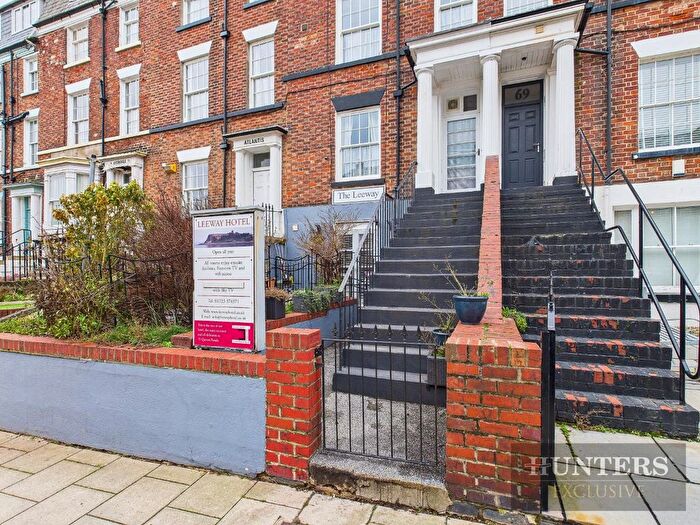
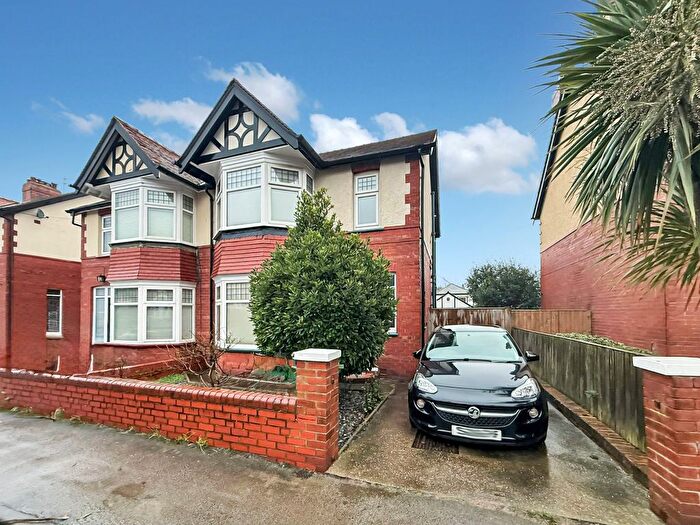
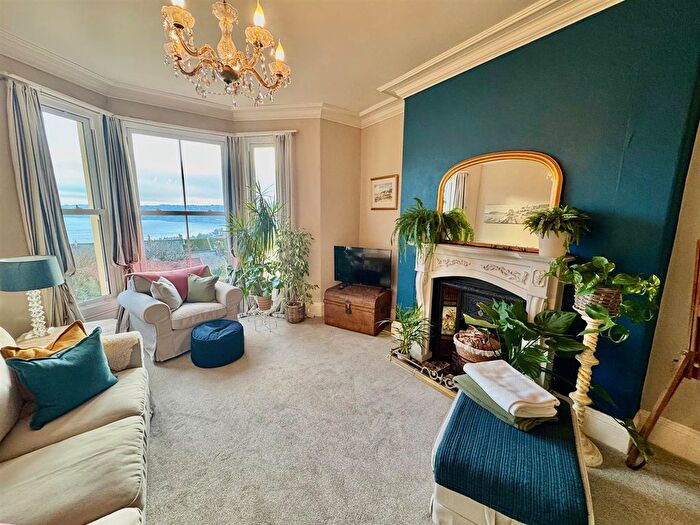
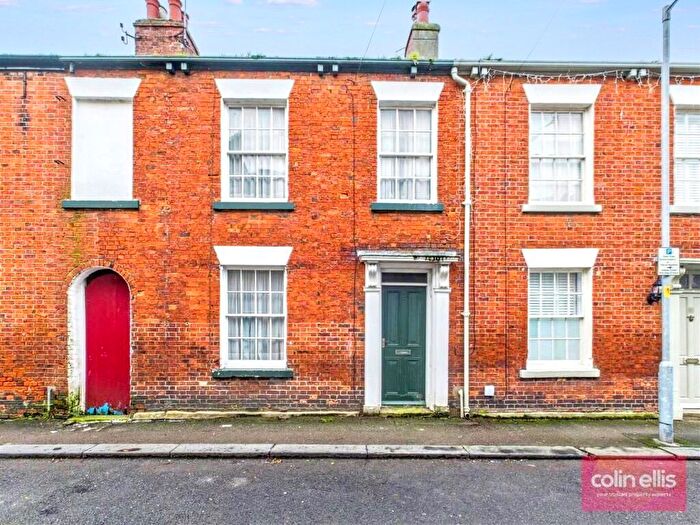
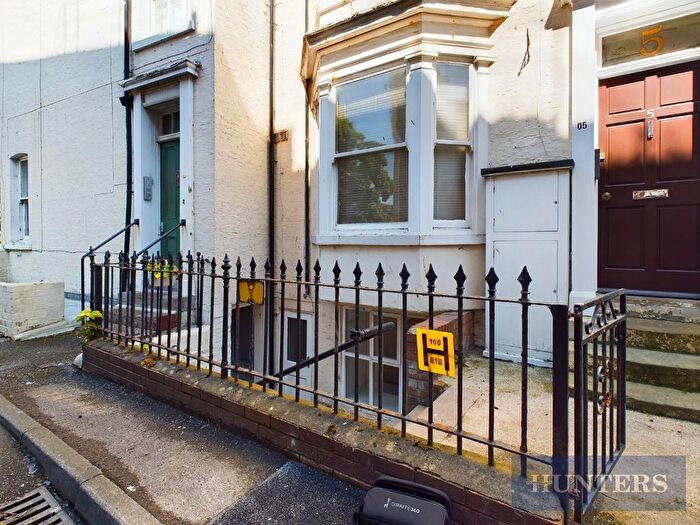
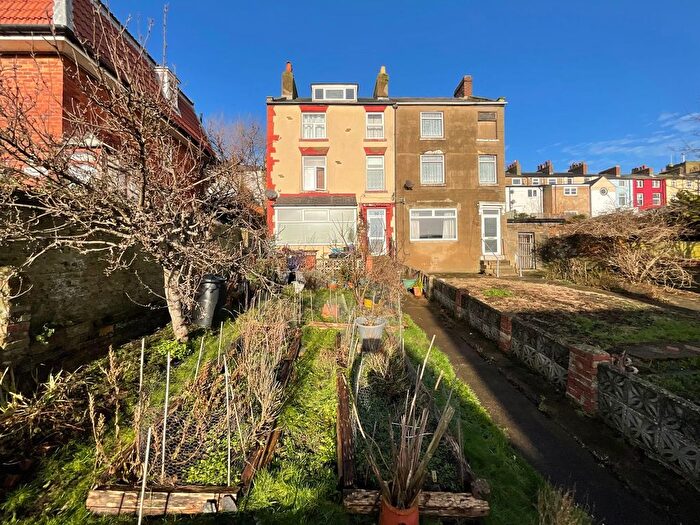
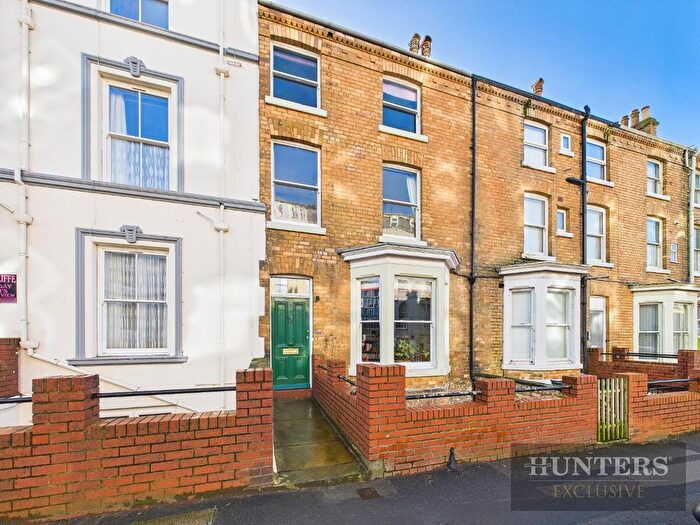
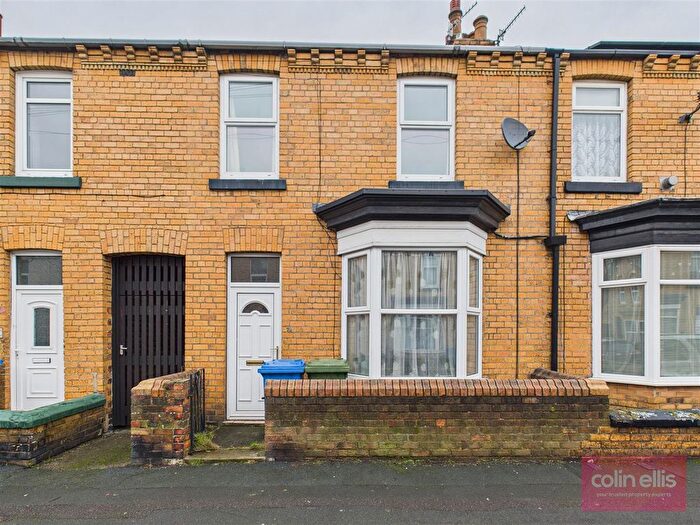
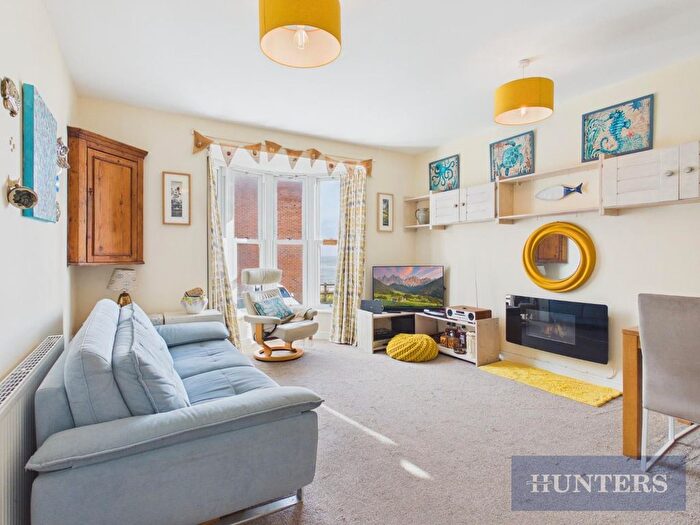
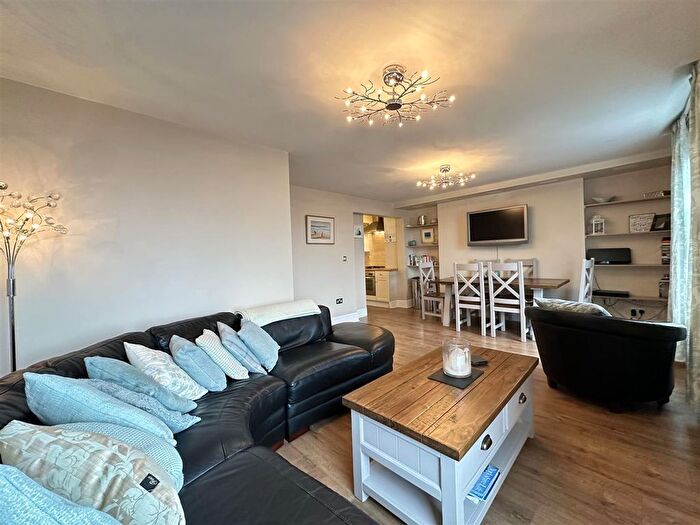
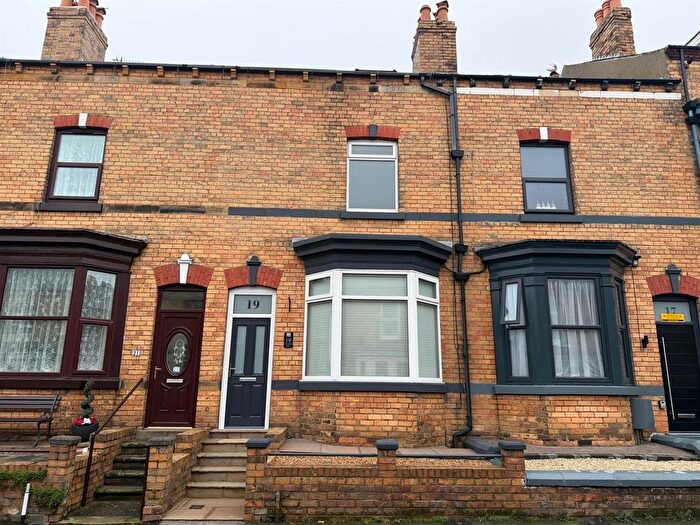
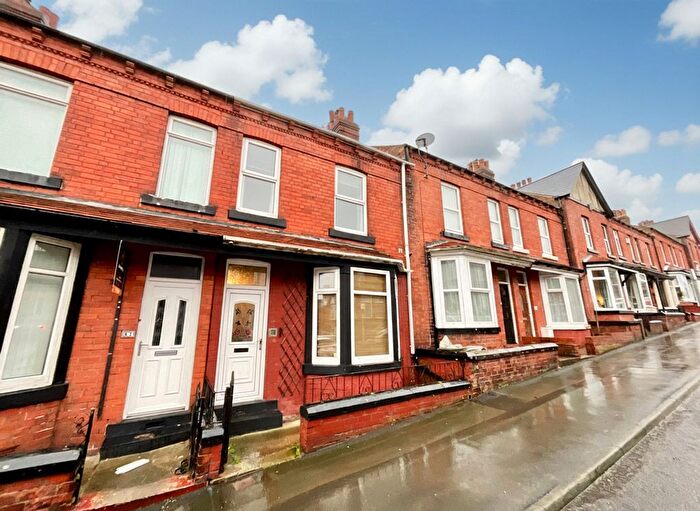
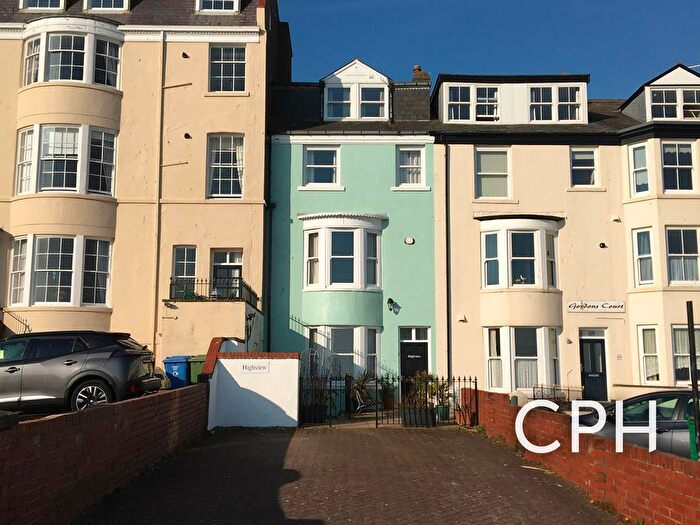
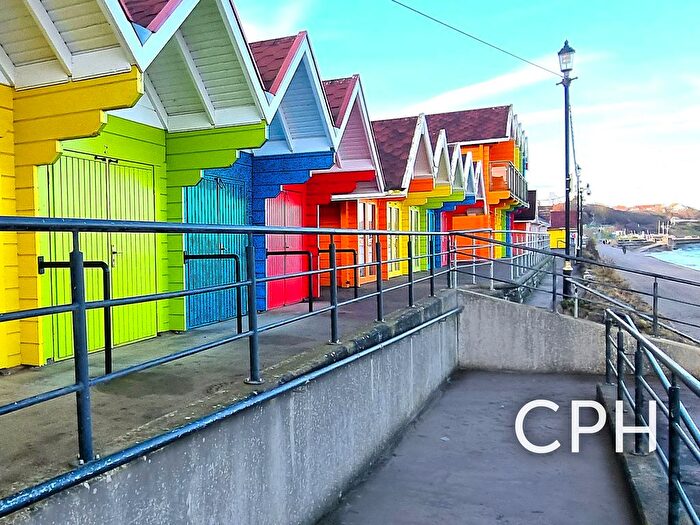
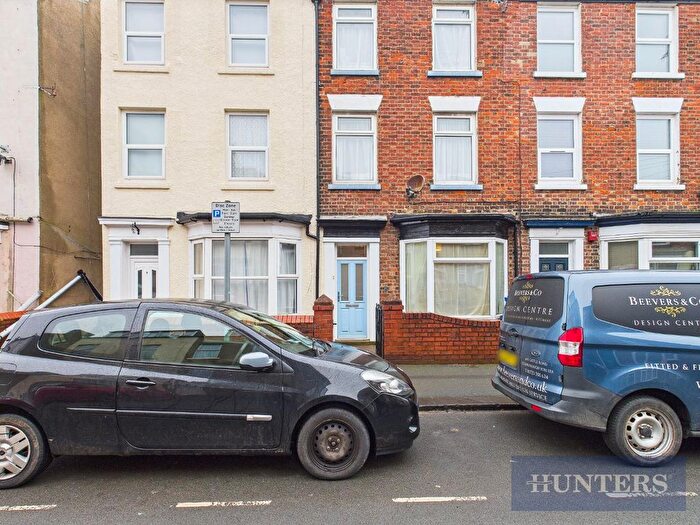
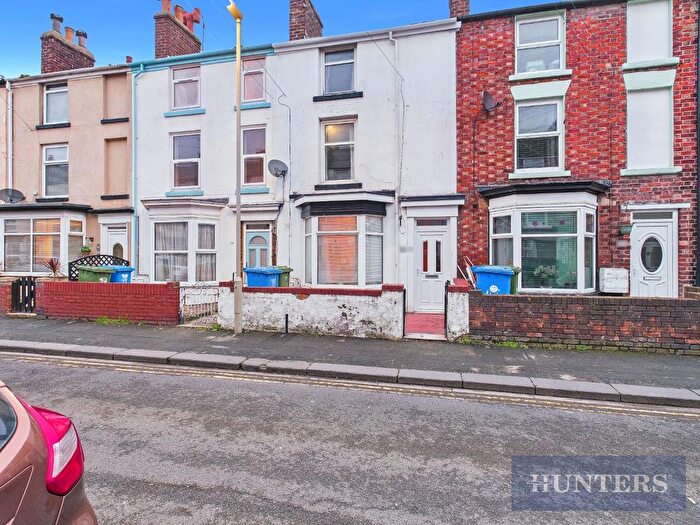
Houses for sale & to rent in North Bay, Scarborough
House Prices in North Bay
Properties in North Bay have an average house price of £168,702.00 and had 264 Property Transactions within the last 3 years¹.
North Bay is an area in Scarborough, North Yorkshire with 2,135 households², where the most expensive property was sold for £570,000.00.
Properties for sale in North Bay
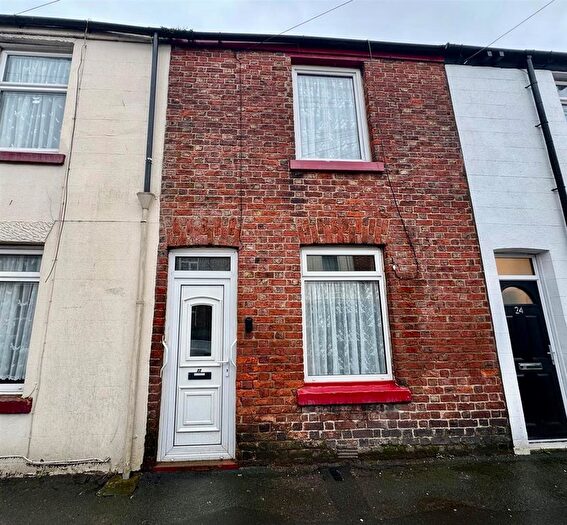
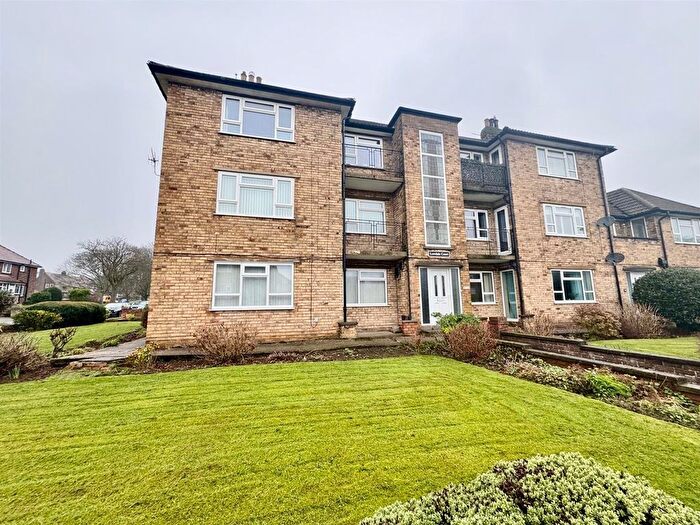
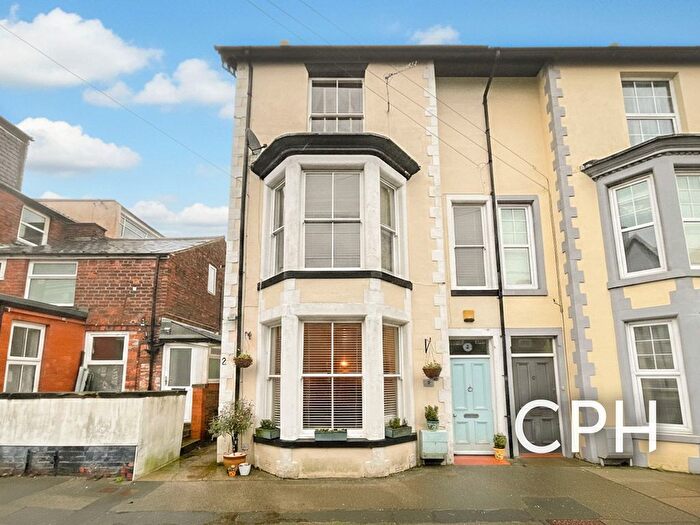
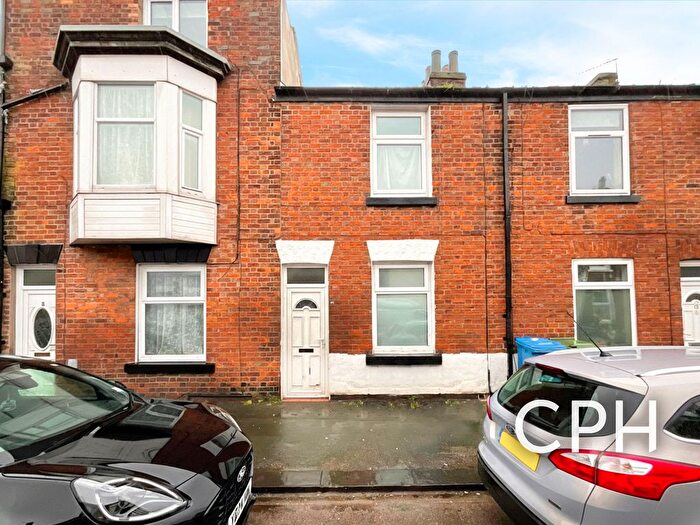
Previously listed properties in North Bay
Roads and Postcodes in North Bay
Navigate through our locations to find the location of your next house in North Bay, Scarborough for sale or to rent.
| Streets | Postcodes |
|---|---|
| Albert Street | YO12 7HW |
| Blenheim Street | YO12 7HB |
| Blenheim Terrace | YO12 7HD YO12 7HF |
| Castle Road | YO11 1TE |
| Cavalry Court | YO12 6QQ |
| Clark Street | YO12 7PS |
| Columbus Ravine | YO12 7QU YO12 7QZ |
| Dean Road | YO12 7QS YO12 7SN |
| Durham Place | YO12 7QA |
| Durham Street | YO12 7PT YO12 7PX |
| Fire Station Yard | YO11 1TL |
| Foresters Court | YO12 6QE |
| Green Howards Drive | YO12 6PD YO12 6PE |
| Grenadier Court | YO12 6QS |
| Guards Court | YO12 6QR |
| Hope Street | YO12 7PR |
| Howard Street | YO12 7QB |
| Hussars Court | YO12 6QF |
| James Street | YO12 7PH |
| Lancers Court | YO12 6QD |
| Langdale Road | YO12 7RA |
| Lower Clark Street | YO12 7PW |
| Marlborough Street | YO12 7GY YO12 7HG |
| Marlborough Terrace | YO12 7HQ |
| Moorland Road | YO12 7RB YO12 7RD |
| New Queen Street | YO12 7HJ YO12 7HL |
| North Cliff Avenue | YO12 6PW YO12 6PZ YO12 6QA YO12 6QB |
| North Cliff Gardens | YO12 6PR |
| North Marine Road | YO12 7BA YO12 7EY YO12 7HS YO12 7HT YO12 7HU YO12 7HZ YO12 7JA YO12 7JD YO12 7PD YO12 7PE |
| Oxford Street | YO12 7PJ |
| Peasholm Cottages | YO12 7TL |
| Peasholm Gap | YO12 7TN |
| Peasholm Road | YO12 7TT |
| Peel Terrace | YO12 7HP |
| Queens Parade | YO12 7HH YO12 7HY |
| Queens Terrace | YO12 7HR |
| Regent Street | YO12 7PG |
| Rutland Terrace | YO12 7JB |
| Rycroft Road | YO12 6RG |
| Sandringham Street | YO12 7QD |
| Scalby Mills Road | YO12 6RB YO12 6RP YO12 6RW |
| Scholes Park Avenue | YO12 6QZ |
| Scholes Park Cliff | YO12 6RF |
| Scholes Park Drive | YO12 6RD |
| Scholes Park Road | YO12 6QY YO12 6RA YO12 6RE YO12 6RR |
| Signals Court | YO12 6QG |
| Stanley Street | YO12 7QE |
| Sydney Street | YO12 7QF |
| Tennyson Avenue | YO12 7RE YO12 7RF |
| Trafalgar Road | YO12 7QP YO12 7QR |
| Trafalgar Square | YO12 7PQ YO12 7PY YO12 7PZ |
| Trafalgar Terrace | YO12 7QG |
| Victoria Park | YO12 7TS |
| Victoria Park Avenue | YO12 7TR |
| Vincent Street | YO12 7HN |
| Woodall Avenue | YO12 7TH |
Transport near North Bay
- FAQ
- Price Paid By Year
- Property Type Price
Frequently asked questions about North Bay
What is the average price for a property for sale in North Bay?
The average price for a property for sale in North Bay is £168,702. This amount is 18% lower than the average price in Scarborough. There are 1,321 property listings for sale in North Bay.
What streets have the most expensive properties for sale in North Bay?
The streets with the most expensive properties for sale in North Bay are Foresters Court at an average of £376,500, Peasholm Gap at an average of £325,250 and North Cliff Gardens at an average of £307,000.
What streets have the most affordable properties for sale in North Bay?
The streets with the most affordable properties for sale in North Bay are Lower Clark Street at an average of £70,000, Trafalgar Square at an average of £100,867 and Trafalgar Terrace at an average of £101,666.
Which train stations are available in or near North Bay?
Some of the train stations available in or near North Bay are Scarborough, Seamer and Filey.
Property Price Paid in North Bay by Year
The average sold property price by year was:
| Year | Average Sold Price | Price Change |
Sold Properties
|
|---|---|---|---|
| 2025 | £173,271 | -1% |
72 Properties |
| 2024 | £174,510 | 9% |
96 Properties |
| 2023 | £159,467 | -13% |
96 Properties |
| 2022 | £179,630 | 14% |
114 Properties |
| 2021 | £155,025 | 13% |
125 Properties |
| 2020 | £135,184 | -4% |
89 Properties |
| 2019 | £140,034 | -3% |
115 Properties |
| 2018 | £144,481 | 13% |
100 Properties |
| 2017 | £125,273 | 0,5% |
122 Properties |
| 2016 | £124,696 | -25% |
111 Properties |
| 2015 | £155,802 | 25% |
98 Properties |
| 2014 | £116,386 | -4% |
108 Properties |
| 2013 | £120,636 | -3% |
84 Properties |
| 2012 | £123,973 | 1% |
62 Properties |
| 2011 | £123,301 | -7% |
77 Properties |
| 2010 | £131,915 | -3% |
89 Properties |
| 2009 | £135,495 | -31% |
121 Properties |
| 2008 | £177,476 | 20% |
146 Properties |
| 2007 | £142,205 | 7% |
161 Properties |
| 2006 | £132,850 | 6% |
137 Properties |
| 2005 | £125,452 | 5% |
116 Properties |
| 2004 | £118,592 | 23% |
144 Properties |
| 2003 | £91,020 | 23% |
215 Properties |
| 2002 | £69,886 | 22% |
189 Properties |
| 2001 | £54,779 | 7% |
148 Properties |
| 2000 | £50,949 | 5% |
150 Properties |
| 1999 | £48,222 | -5% |
137 Properties |
| 1998 | £50,605 | -2% |
142 Properties |
| 1997 | £51,789 | -2% |
125 Properties |
| 1996 | £52,929 | -1% |
142 Properties |
| 1995 | £53,542 | - |
148 Properties |
Property Price per Property Type in North Bay
Here you can find historic sold price data in order to help with your property search.
The average Property Paid Price for specific property types in the last three years are:
| Property Type | Average Sold Price | Sold Properties |
|---|---|---|
| Semi Detached House | £226,698.00 | 35 Semi Detached Houses |
| Detached House | £335,090.00 | 11 Detached Houses |
| Terraced House | £156,069.00 | 113 Terraced Houses |
| Flat | £145,535.00 | 105 Flats |

