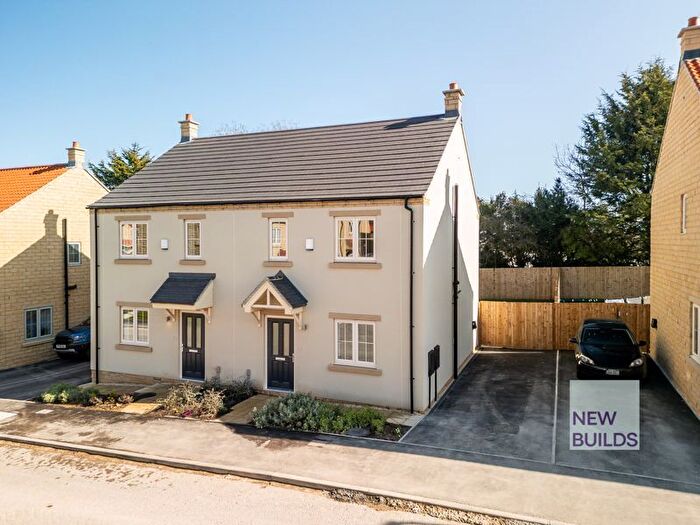
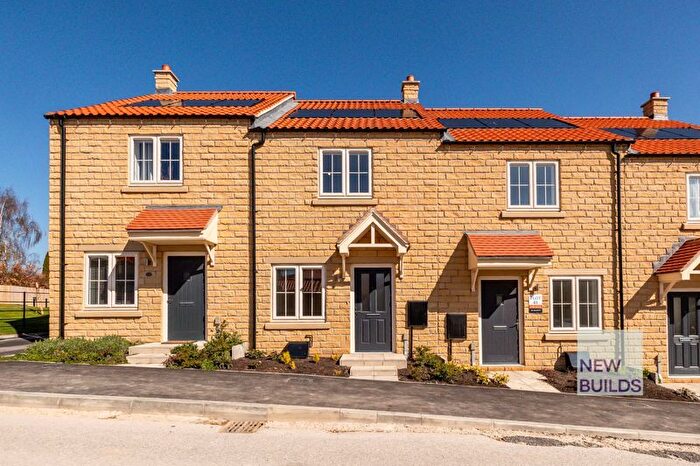
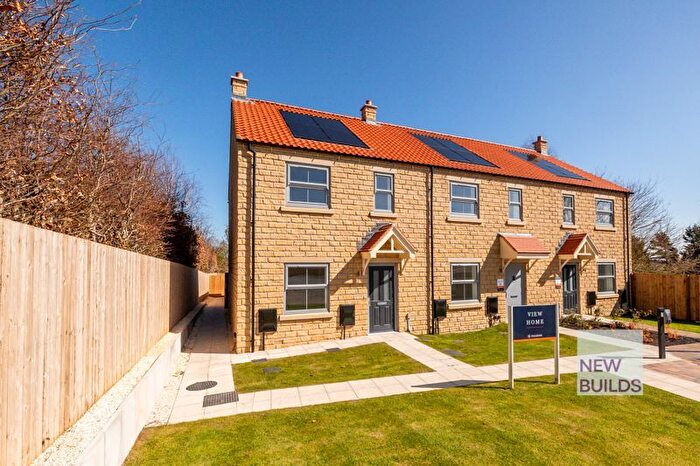
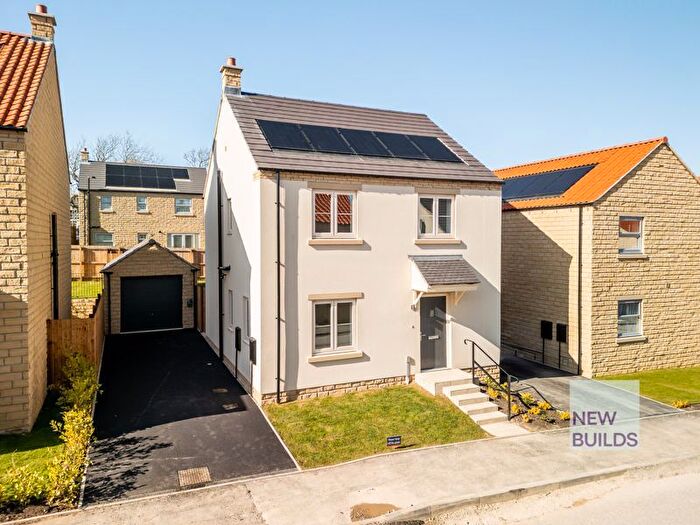
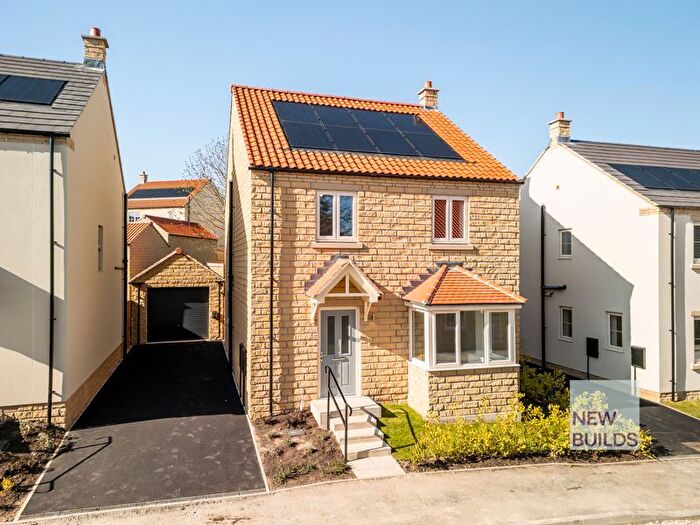
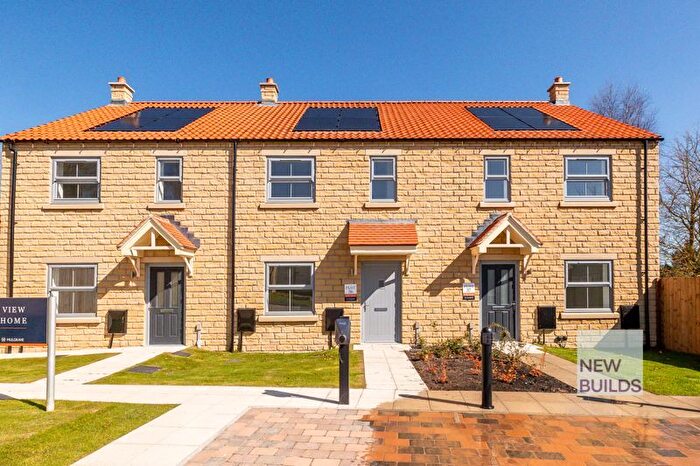
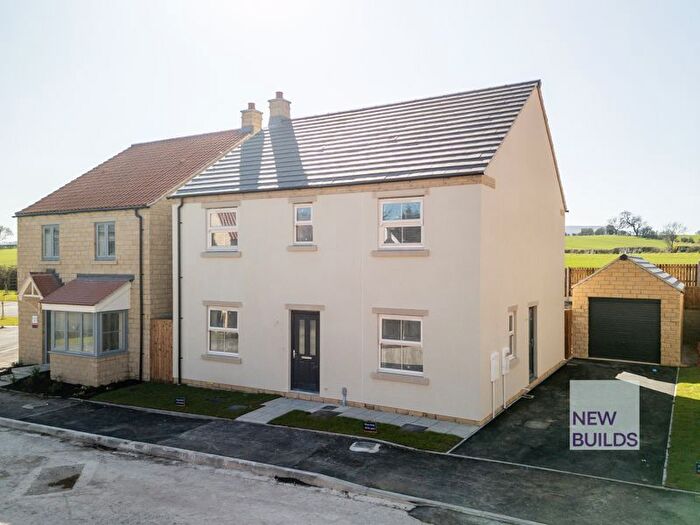
Houses for sale & to rent in Lindhead, Scarborough
House Prices in Lindhead
Properties in Lindhead have an average house price of £303,356.00 and had 86 Property Transactions within the last 3 years¹.
Lindhead is an area in Scarborough, North Yorkshire with 950 households², where the most expensive property was sold for £785,000.00.
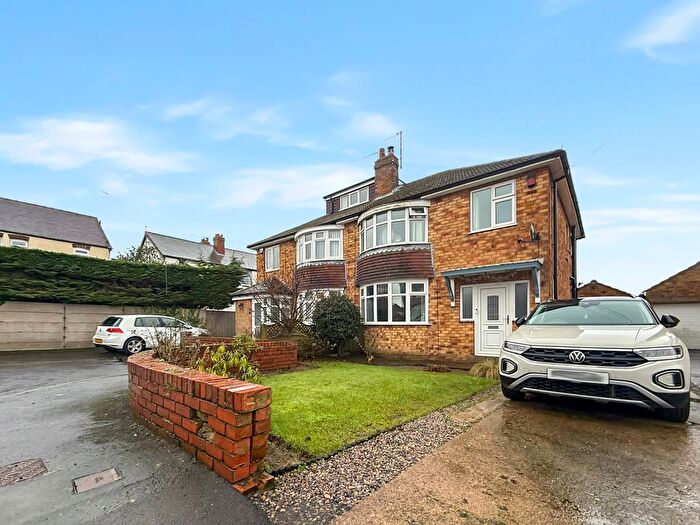
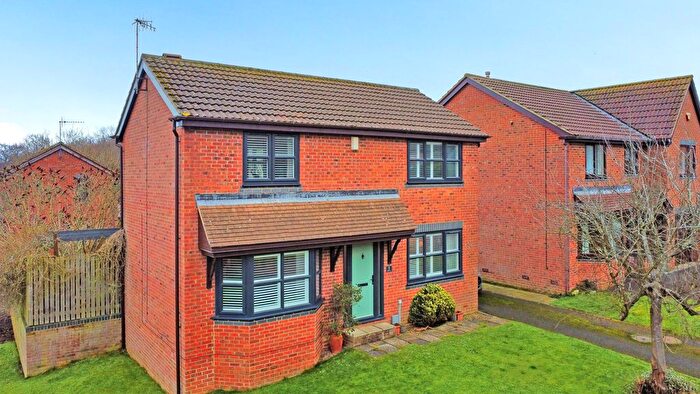
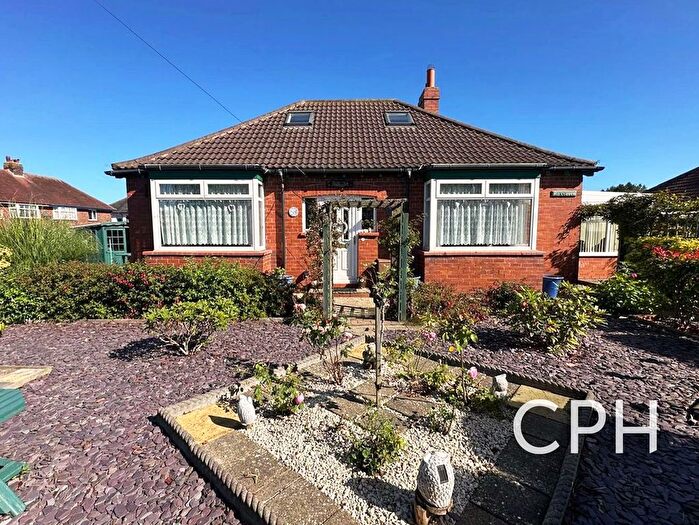
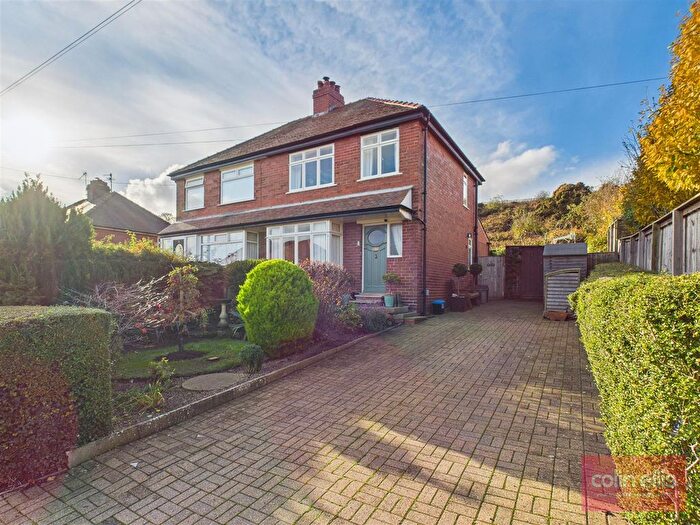
Properties for sale in Lindhead
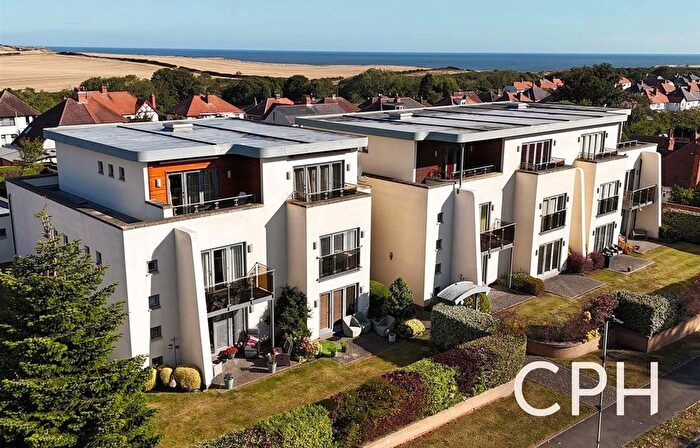
Previously listed properties in Lindhead
Roads and Postcodes in Lindhead
Navigate through our locations to find the location of your next house in Lindhead, Scarborough for sale or to rent.
| Streets | Postcodes |
|---|---|
| Ashdown Rise | YO13 0EF |
| Beck Lane | YO13 0AQ |
| Bridge Close | YO13 0HS |
| Burniston Gardens | YO13 0HW |
| Church Beck Cottages | YO13 0AG |
| Coastal Road | YO13 0HR |
| Court Green Close | YO13 0AP |
| Cross Lane | YO13 0HU |
| Dale Avenue | YO13 0EQ |
| Dale Close | YO13 0ED |
| Dale Rise | YO13 0EG |
| Gowland Lane | YO13 0DU |
| Hawthorne Close | YO13 0JJ |
| Hay Lane Terrace | YO13 0AJ |
| Hayburn Wyke | YO13 0AU |
| High Street | YO13 0AE YO13 0HH YO13 0HJ |
| Hood Lane | YO13 0AT |
| Laurel Close | YO13 0JQ |
| Limestone Grove | YO13 0DH |
| Limestone Road | YO13 0DG |
| Limestone Way | YO13 0DQ |
| Linton Close | YO13 0BA |
| Littlemoor Close | YO13 0AN |
| Lockwood Chase | YO13 0BD |
| Low Toft Court | YO13 0TA |
| Mill Lane | YO13 0AB YO13 0JE |
| Moor Lane | YO13 0AH |
| Newlands Lane | YO13 0BB |
| Newlands Road | YO13 0AR |
| Overgreen Close | YO13 0JA |
| Overgreen Lane | YO13 0HY |
| Overgreen View | YO13 0HZ |
| Quarry Bank | YO13 0JF |
| Quarry Road | YO13 0DJ |
| River Meadows | YO13 0BE |
| Rocks Lane | YO13 0HX |
| Rocks Lane Close | YO13 0HT |
| Scalby Road | YO13 0HN YO13 0NL |
| South End | YO13 0HP |
| South End Close | YO13 0JL |
| South View | YO13 0HL |
| Springfield | YO13 0AS |
| Staintondale Road | YO13 0AX |
| Station Lane | YO13 0AD |
| Stone Quarry Road | YO13 0DF |
| The Green | YO13 0HF |
| The Limes | YO13 0EE |
| The Orchard | YO13 0JG |
| Wandales Drive | YO13 0HD |
| West Lane | YO13 0AL |
| Whitby Road | YO13 0AW |
| Woods Close | YO13 0JB |
| Woods Grove | YO13 0JD |
Transport near Lindhead
-
Scarborough Station
-
Seamer Station
-
Filey Station
-
Hunmanby Station
-
Ruswarp Station
-
Sleights Station
-
Whitby Station
-
Grosmont Station
-
Egton Station
- FAQ
- Price Paid By Year
- Property Type Price
Frequently asked questions about Lindhead
What is the average price for a property for sale in Lindhead?
The average price for a property for sale in Lindhead is £303,356. This amount is 47% higher than the average price in Scarborough. There are 852 property listings for sale in Lindhead.
What streets have the most expensive properties for sale in Lindhead?
The streets with the most expensive properties for sale in Lindhead are Gowland Lane at an average of £785,000, Whitby Road at an average of £595,000 and Mill Lane at an average of £472,500.
What streets have the most affordable properties for sale in Lindhead?
The streets with the most affordable properties for sale in Lindhead are Overgreen View at an average of £201,666, High Street at an average of £210,727 and The Orchard at an average of £215,000.
Which train stations are available in or near Lindhead?
Some of the train stations available in or near Lindhead are Scarborough, Seamer and Filey.
Property Price Paid in Lindhead by Year
The average sold property price by year was:
| Year | Average Sold Price | Price Change |
Sold Properties
|
|---|---|---|---|
| 2025 | £251,868 | -28% |
19 Properties |
| 2024 | £321,227 | 2% |
33 Properties |
| 2023 | £314,785 | 17% |
34 Properties |
| 2022 | £261,654 | -3% |
41 Properties |
| 2021 | £269,972 | 15% |
36 Properties |
| 2020 | £230,113 | -5% |
33 Properties |
| 2019 | £240,606 | 8% |
33 Properties |
| 2018 | £221,591 | 4% |
40 Properties |
| 2017 | £213,135 | 4% |
41 Properties |
| 2016 | £204,838 | -5% |
44 Properties |
| 2015 | £214,885 | 2% |
42 Properties |
| 2014 | £211,457 | 6% |
54 Properties |
| 2013 | £199,677 | 7% |
36 Properties |
| 2012 | £185,542 | -18% |
41 Properties |
| 2011 | £218,027 | 11% |
31 Properties |
| 2010 | £195,088 | 15% |
22 Properties |
| 2009 | £165,711 | -25% |
21 Properties |
| 2008 | £206,516 | -4% |
32 Properties |
| 2007 | £214,304 | 1% |
44 Properties |
| 2006 | £212,544 | 2% |
43 Properties |
| 2005 | £207,779 | 7% |
48 Properties |
| 2004 | £194,197 | 14% |
57 Properties |
| 2003 | £166,713 | 26% |
39 Properties |
| 2002 | £123,450 | 17% |
53 Properties |
| 2001 | £102,869 | 0,3% |
51 Properties |
| 2000 | £102,545 | 13% |
55 Properties |
| 1999 | £88,725 | -4% |
52 Properties |
| 1998 | £92,393 | 25% |
39 Properties |
| 1997 | £69,390 | -8% |
46 Properties |
| 1996 | £74,813 | 3% |
36 Properties |
| 1995 | £72,719 | - |
26 Properties |
Property Price per Property Type in Lindhead
Here you can find historic sold price data in order to help with your property search.
The average Property Paid Price for specific property types in the last three years are:
| Property Type | Average Sold Price | Sold Properties |
|---|---|---|
| Semi Detached House | £246,673.00 | 23 Semi Detached Houses |
| Detached House | £359,714.00 | 51 Detached Houses |
| Terraced House | £179,590.00 | 11 Terraced Houses |
| Flat | £94,250.00 | 1 Flat |

