
Houses for sale & to rent in Scalby, Scarborough
House Prices in Scalby
Properties in Scalby have an average house price of £241k and had 39 Property Transactions within the last 3 years¹.
Scalby is an area in Scarborough, North Yorkshire with 41 households², where the most expensive property was sold for £495k.
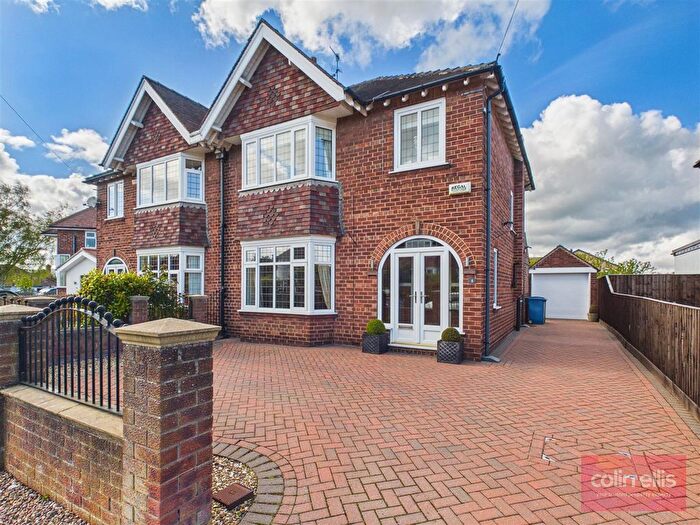
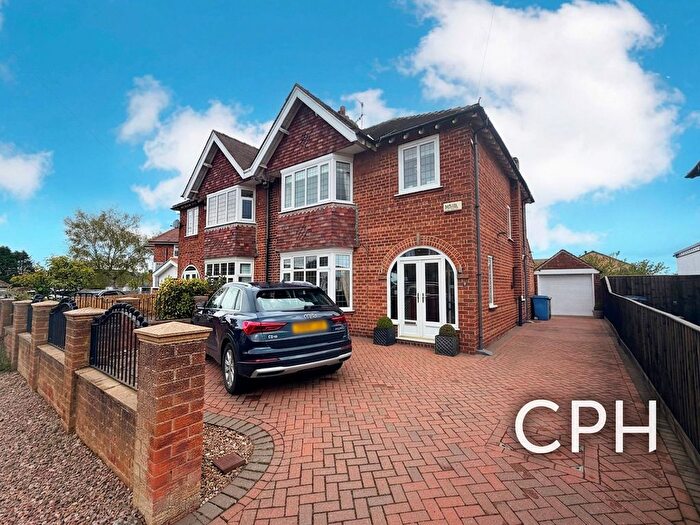
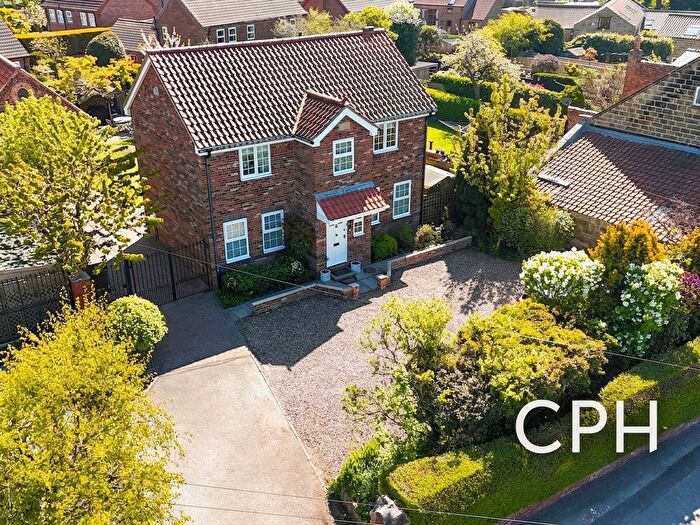
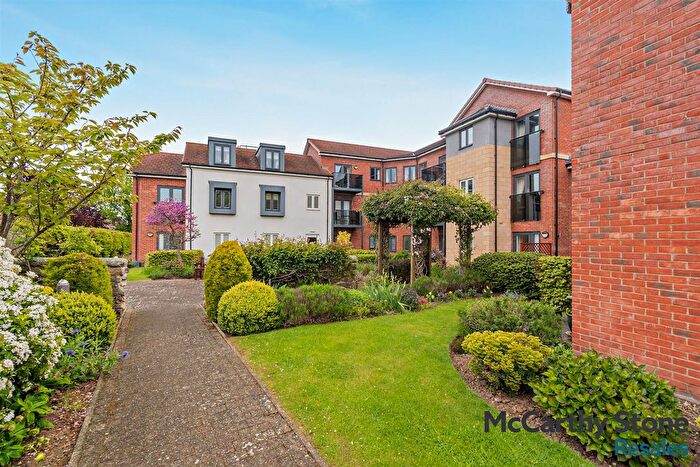
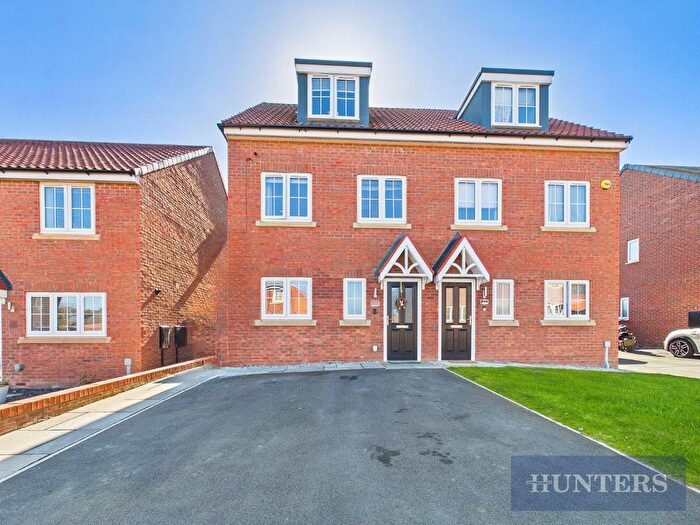
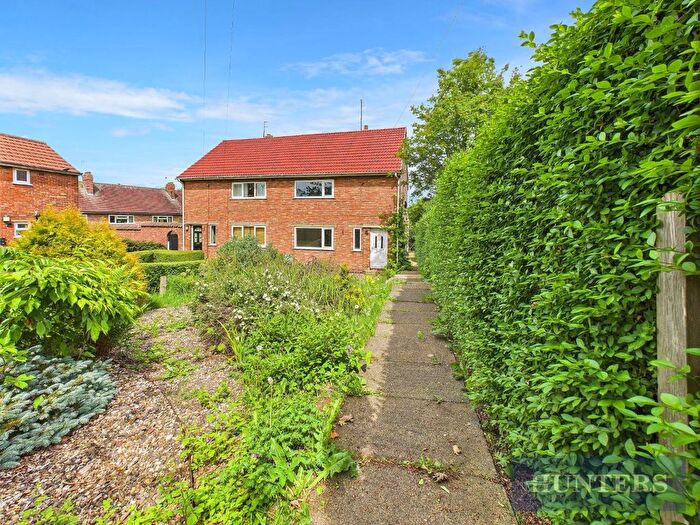
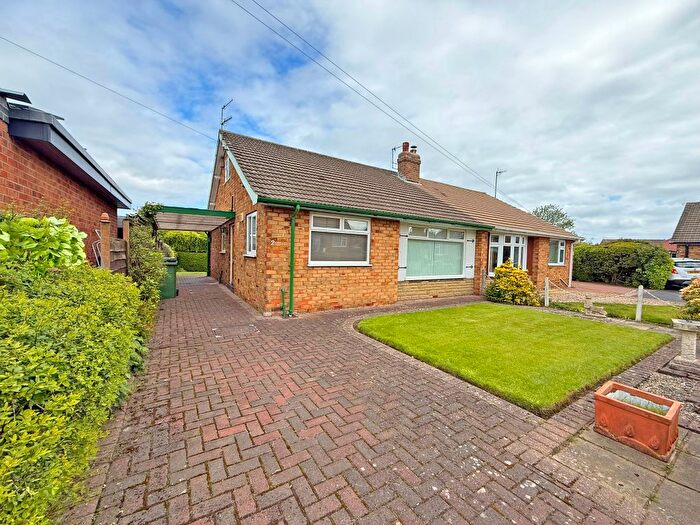
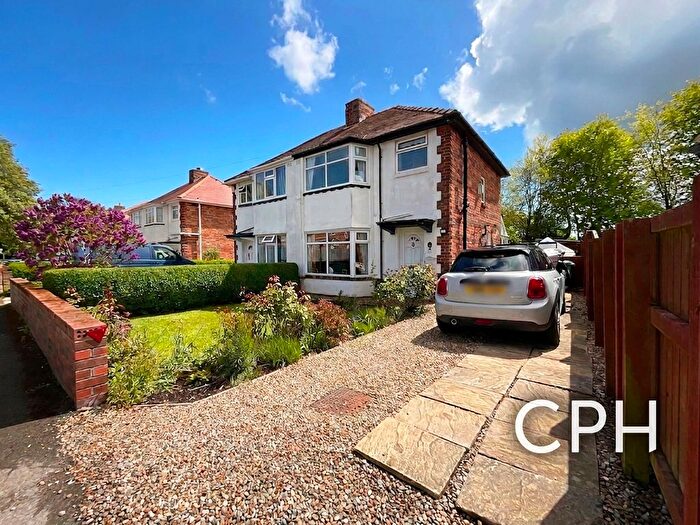
Properties for sale in Scalby
Previously listed properties in Scalby
![]()
If you are looking to sell your house, let it out, or receive a property valuation, an expert can help you.
Click the button below to get started.
Roads and Postcodes in Scalby
Navigate through our locations to find the location of your next house in Scalby, Scarborough for sale or to rent.
| Streets | Postcodes |
|---|---|
| Barmoor | YO13 0PF |
| Beacon Brow Road | YO13 0RB |
| Bramble Way | YO13 0BQ YO13 0BU |
| Butterbur Lane | YO13 0BX |
| Chichester Close | YO13 0QN |
| Cowslip Close | YO13 0BF |
| Elderflower Road | YO13 0BY |
| Fell Close | YO12 6ST |
| Foxglove Way | YO13 0FA |
| Hackness Road | YO13 0SD YO13 0SJ |
| Low Street | YO13 0QW |
| Mill Way | YO13 0AF YO13 0BG |
| Newby Farm Road | YO12 6WA |
| Old Rugby Way | YO12 6FA |
| Scalby Road | YO12 6UB |
| Snapdragon Lane | YO13 0BZ |
| Sunflower Drive | YO13 0FB |
Transport near Scalby

- FAQ
- Price Paid By Year
- Property Type Price
Frequently asked questions about Scalby
What is the average price for a property for sale in Scalby?
The average price for a property for sale in Scalby is £240,991. This amount is 17% higher than the average price in Scarborough. There are 1,304 property listings for sale in Scalby.
What streets have the most expensive properties for sale in Scalby?
The streets with the most expensive properties for sale in Scalby are Mill Way at an average of £340,415, Bramble Way at an average of £330,000 and Foxglove Way at an average of £259,879.
What streets have the most affordable properties for sale in Scalby?
The streets with the most affordable properties for sale in Scalby are Butterbur Lane at an average of £59,500, Snapdragon Lane at an average of £116,875 and Elderflower Road at an average of £211,500.
Which train stations are available in or near Scalby?
Some of the train stations available in or near Scalby are Scarborough, Seamer and Filey.
Property Price Paid in Scalby by Year
The average sold property price by year was:
| Year | Average Sold Price | Price Change |
Sold Properties
|
|---|---|---|---|
| 2026 | £182,500 | -34% |
1 Property |
| 2025 | £245,333 | -1% |
9 Properties |
| 2024 | £247,188 | 5% |
17 Properties |
| 2023 | £233,832 | -12% |
12 Properties |
| 2022 | £261,037 | -14% |
26 Properties |
| 2021 | £296,527 | 13% |
15 Properties |
| 2020 | £256,600 | 27% |
5 Properties |
| 2019 | £187,512 | -44% |
12 Properties |
| 2018 | £269,749 | 17% |
26 Properties |
| 2017 | £222,745 | -2% |
76 Properties |
| 2016 | £226,233 | -23% |
34 Properties |
| 2015 | £279,259 | 36% |
18 Properties |
| 2014 | £180,000 | -83% |
1 Property |
| 2009 | £330,000 | 2% |
1 Property |
| 2004 | £325,000 | - |
1 Property |
Property Price per Property Type in Scalby
Here you can find historic sold price data in order to help with your property search.
The average Property Paid Price for specific property types in the last three years are:
| Property Type | Average Sold Price | Sold Properties |
|---|---|---|
| Semi Detached House | £222,062.00 | 15 Semi Detached Houses |
| Terraced House | £140,750.00 | 2 Terraced Houses |
| Flat | £188,166.00 | 12 Flats |
| Detached House | £352,824.00 | 10 Detached Houses |