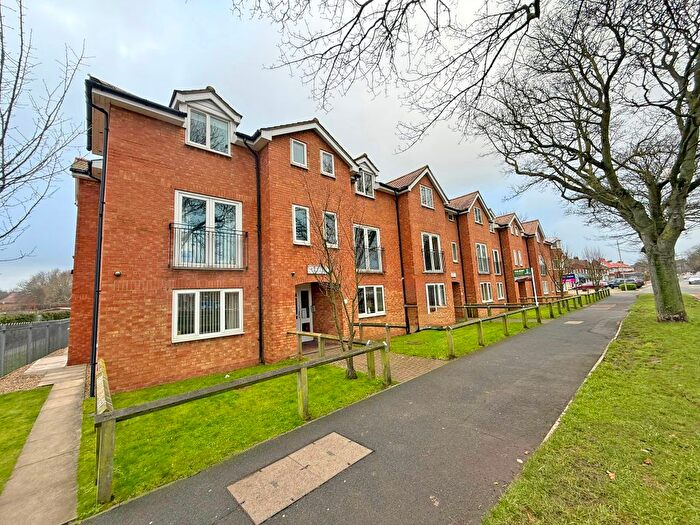
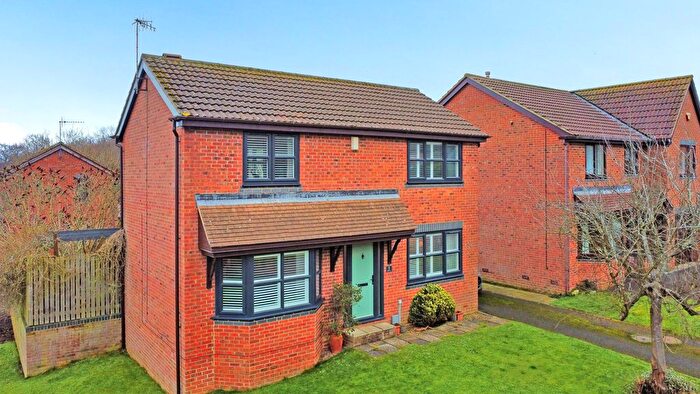
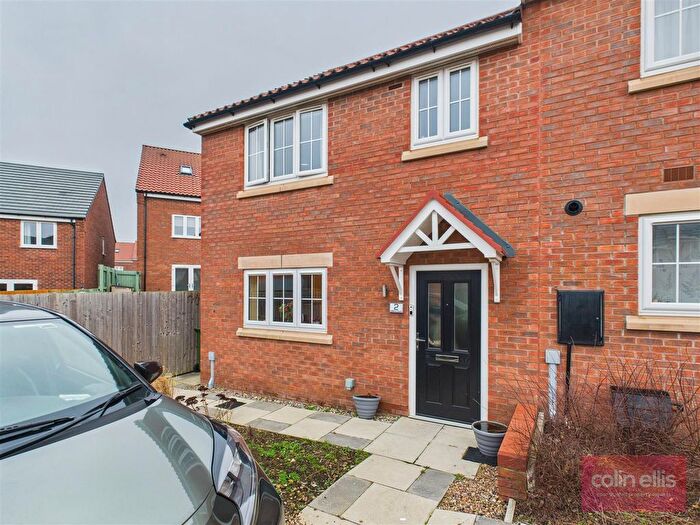
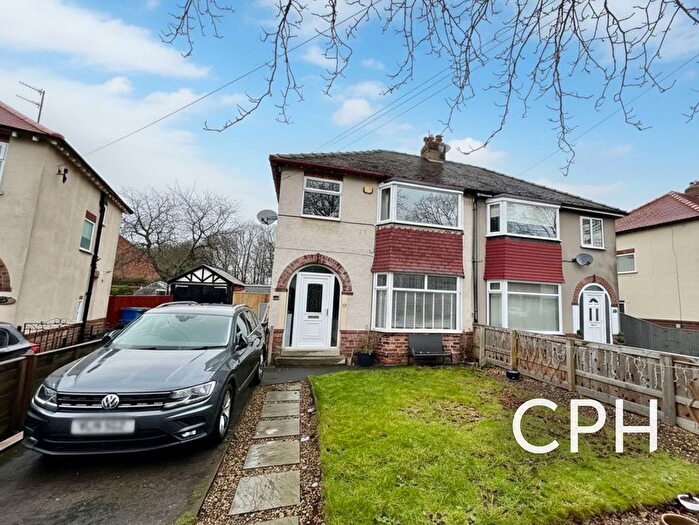
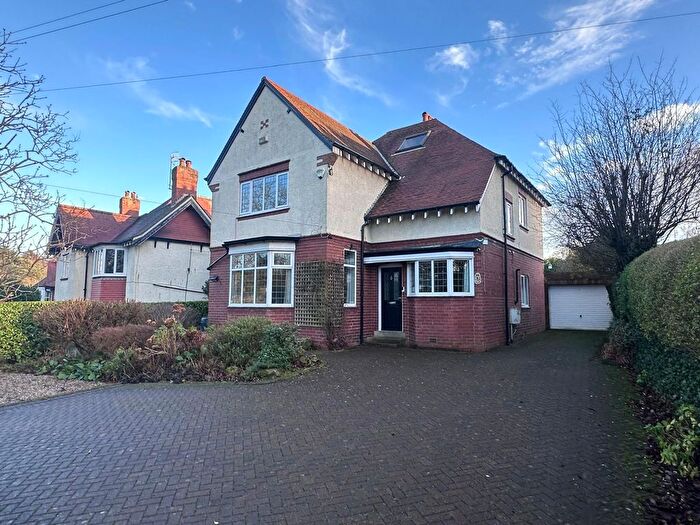
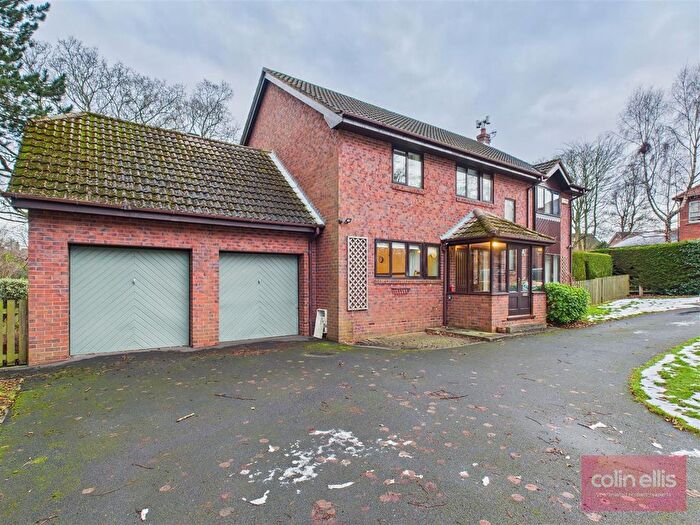
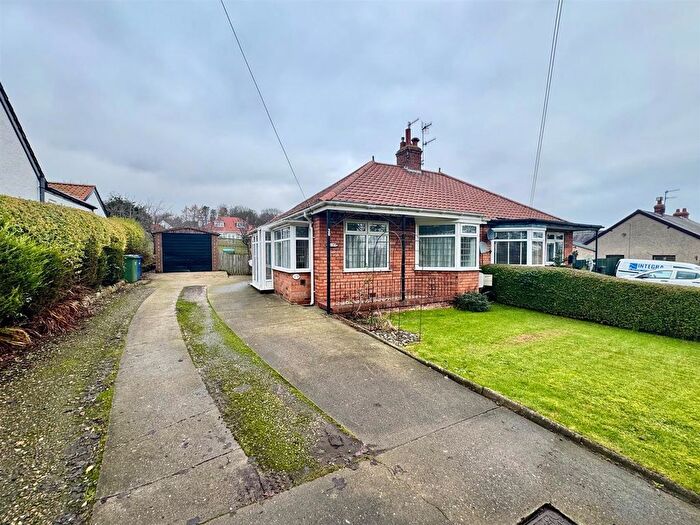
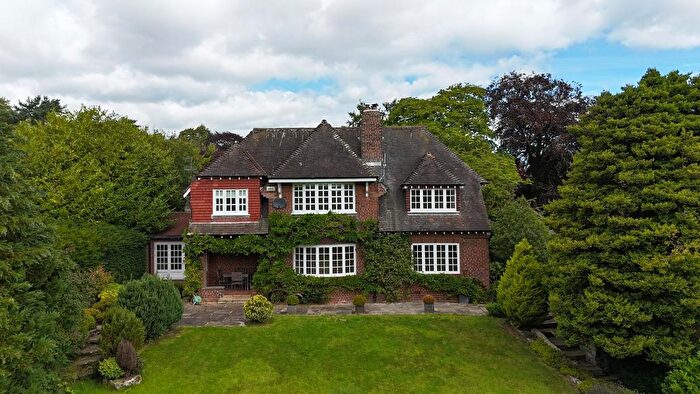
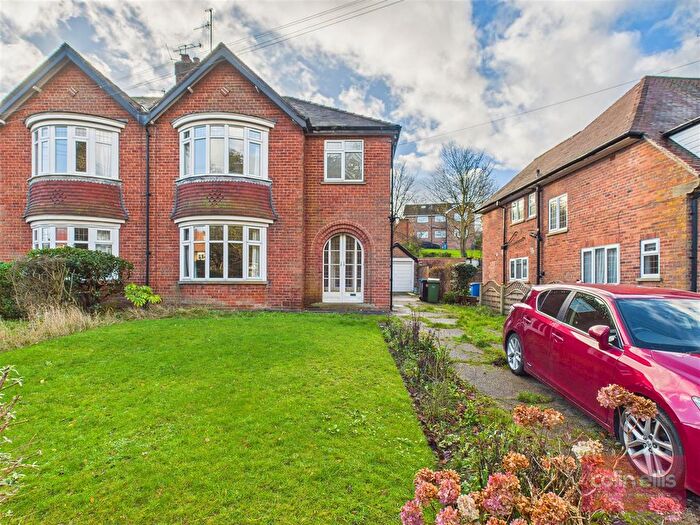
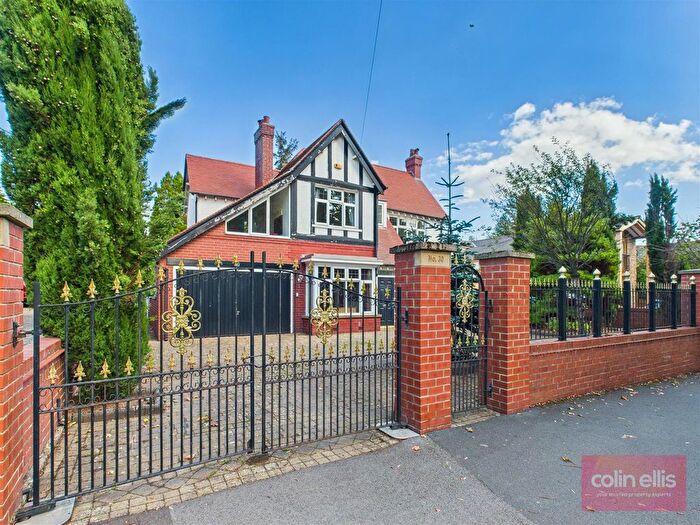
Houses for sale & to rent in Newby, Scarborough
House Prices in Newby
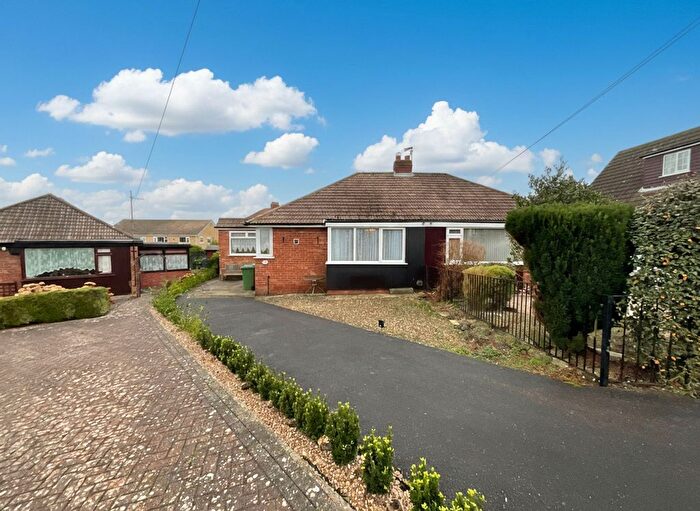
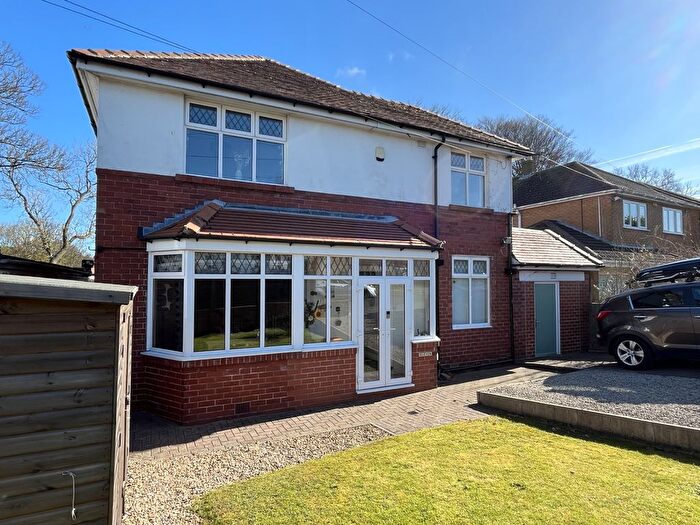
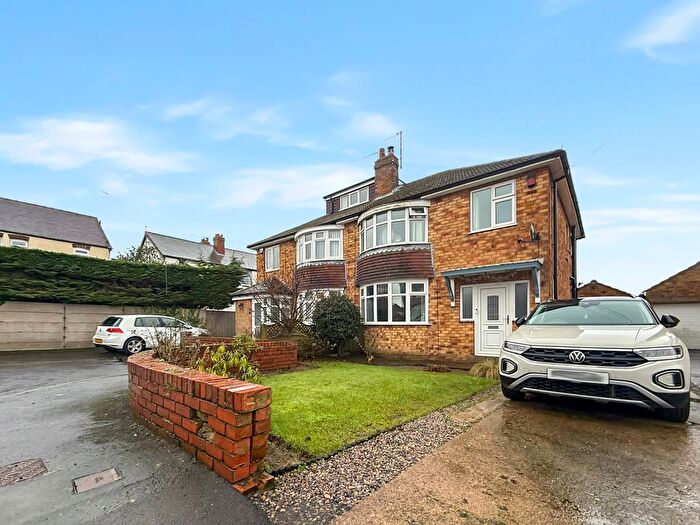
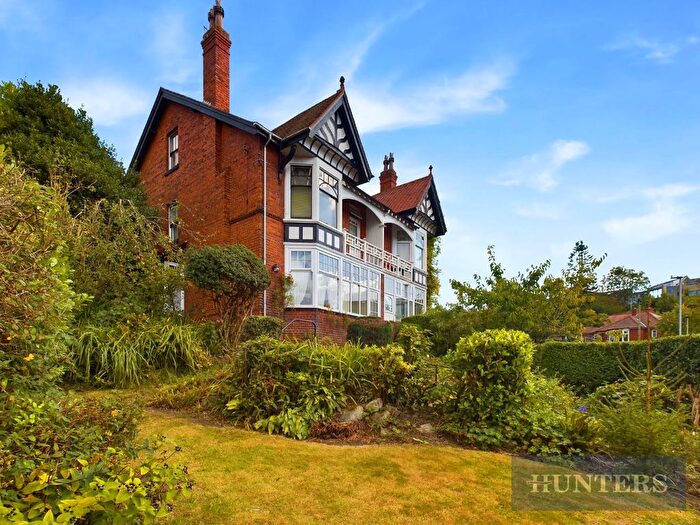
Properties in Newby have an average house price of £241,928.00 and had 266 Property Transactions within the last 3 years¹.
Newby is an area in Scarborough, North Yorkshire with 2,758 households², where the most expensive property was sold for £690,000.00.
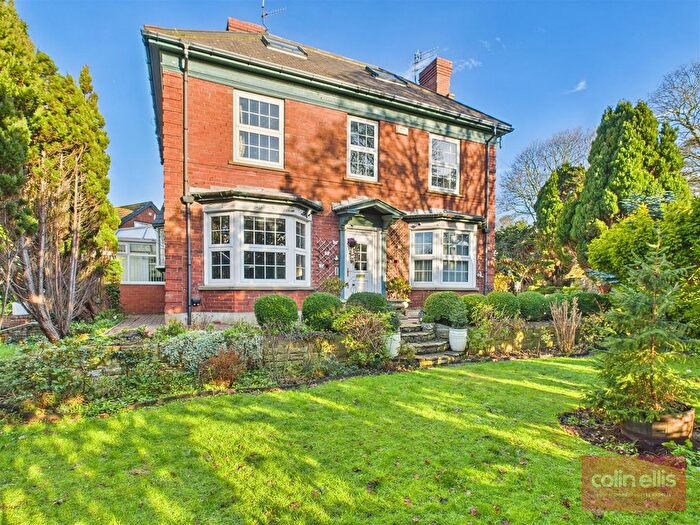
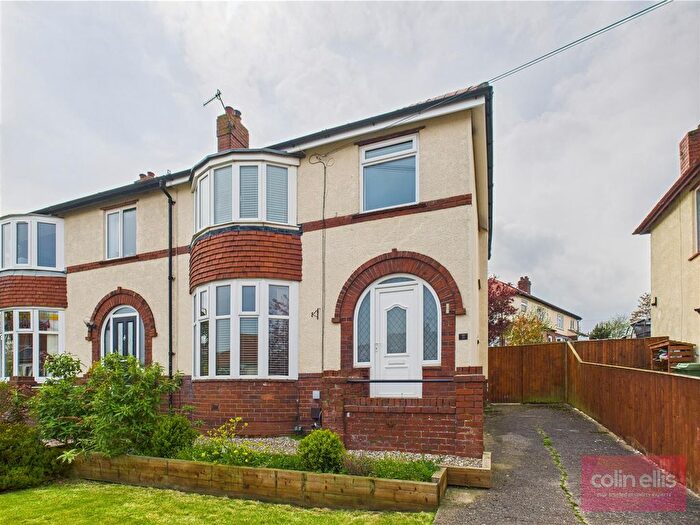
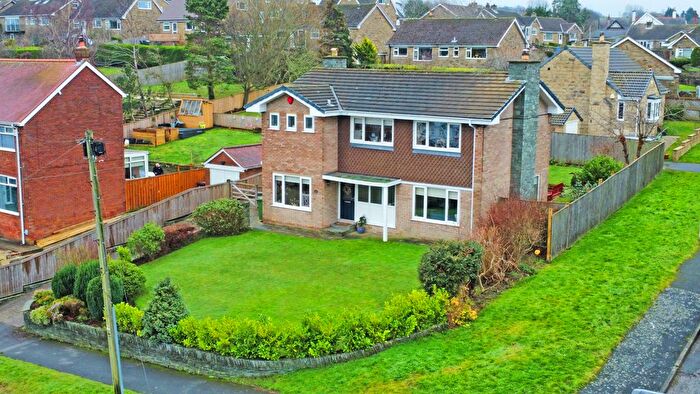
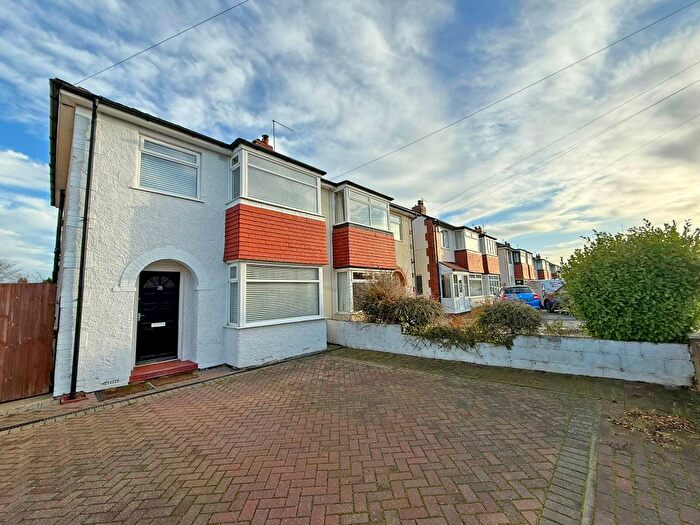
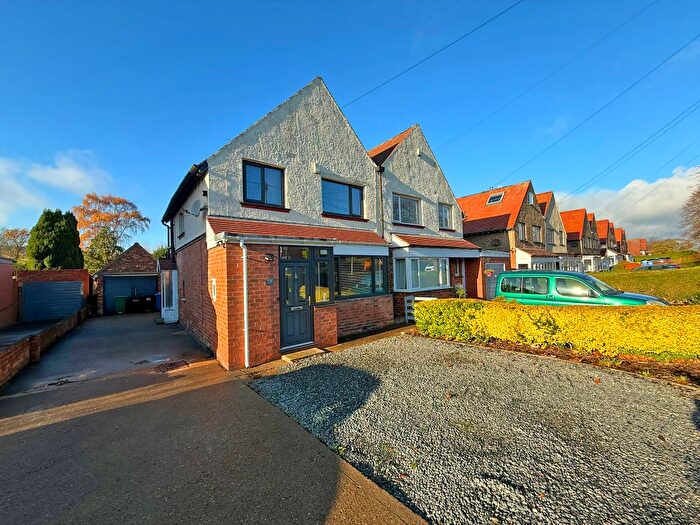
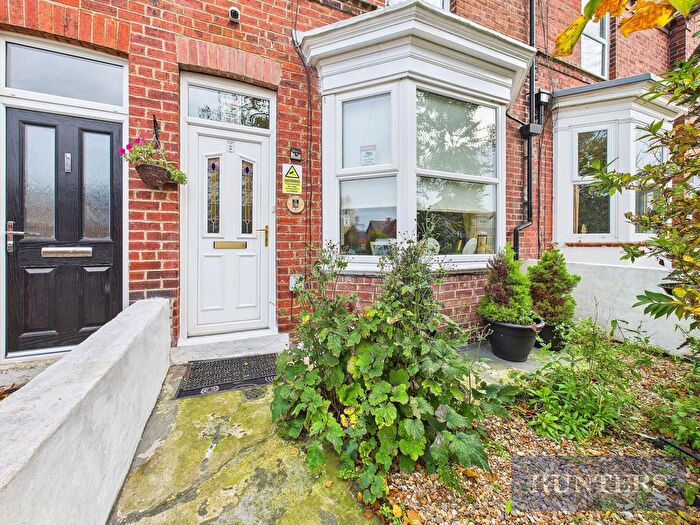
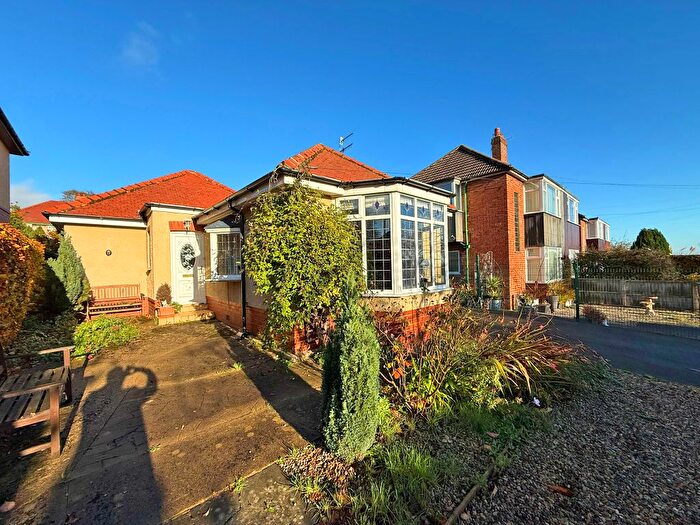
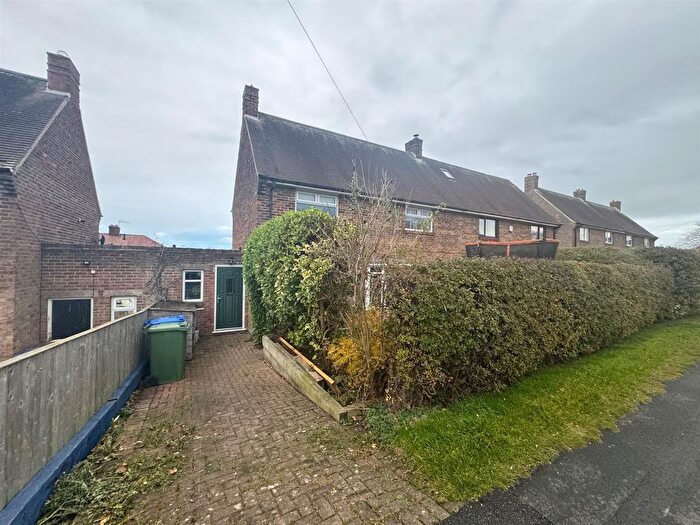
Properties for sale in Newby
Previously listed properties in Newby
Roads and Postcodes in Newby
Navigate through our locations to find the location of your next house in Newby, Scarborough for sale or to rent.
| Streets | Postcodes |
|---|---|
| Briardene Avenue | YO12 6PL |
| Burniston Road | YO12 6PH YO12 6QU YO12 6QX |
| Cleveland Avenue | YO12 6DA YO12 6DB |
| Coldyhill Lane | YO12 6SD YO12 6SE YO12 6SF |
| Cross Lane | YO12 6DE YO12 6DQ YO12 6DN |
| Dunwell Avenue | YO12 5HT |
| Endcliff Crescent | YO12 6HZ |
| Fairfield Crescent | YO12 6TL |
| Fairway | YO12 6RJ |
| Fieldstead Crescent | YO12 6TH |
| Gatesgarth Close | YO12 5PA |
| Goodwood Close | YO12 5PJ |
| Green Lane | YO12 6HL YO12 6HT |
| Greenstead Road | YO12 6HN |
| Greylands Park Avenue | YO12 6HR |
| Greylands Park Drive | YO12 6HU |
| Greylands Park Grove | YO12 6HY |
| Greylands Park Road | YO12 6HX |
| Harewood Avenue | YO12 6DH |
| Heathcliffe Gardens | YO12 6SN |
| High Mill Drive | YO12 6RN |
| High Moor Edge | YO12 5SS |
| Highdale Avenue | YO12 6DD |
| Hillcrest Avenue | YO12 6RQ |
| Hillcrest Grove | YO12 6RL |
| Hirstead Gardens | YO12 6TN |
| Hirstead Road | YO12 6TW |
| Kingston Grove | YO12 5PL |
| Kingsway | YO12 6SG |
| Lady Ediths Avenue | YO12 5RA YO12 5RB |
| Lady Ediths Crescent | YO12 5RD |
| Lady Ediths Park | YO12 5PB YO12 5PD |
| Linden Road | YO12 5SN |
| Ling Hill | YO12 5HS |
| Mayfield Avenue | YO12 6DF |
| Moor Lane | YO12 5SH YO12 5SL YO12 5SP YO12 5SW YO12 5ST |
| Moorside | YO12 5SJ |
| Nabs View | YO12 5SR |
| Newlands Avenue | YO12 6PS |
| Newlands Park Avenue | YO12 6PY |
| Newlands Park Crescent | YO12 6DR YO12 6DS |
| Newlands Park Drive | YO12 6DJ YO12 6DW |
| Newlands Park Grove | YO12 6PT YO12 6PU |
| Newlands Park Road | YO12 6PX |
| North Leas Avenue | YO12 6LY |
| Orchard Heights | YO12 6EH |
| Pegasus Close | YO12 5AP |
| Princess Close | YO12 6SL |
| Queensway | YO12 6SJ |
| Red Scar Drive | YO12 5RQ |
| Red Scar Lane | YO12 5RH |
| Rockingham Drive | YO12 5PG |
| Roman Close | YO12 5RG |
| Roman Way | YO12 5RF |
| Rosedale Lane | YO12 5AN |
| Russet Grove | YO12 6HS |
| Sandhurst Gardens | YO12 5PE |
| Scalby Avenue | YO12 6HP YO12 6HW |
| Scalby Road | YO12 6EA YO12 6ED YO12 6TF YO12 6TG YO12 6TQ |
| Sea View Avenue | YO12 6RH |
| Southlands Grove | YO12 5PH YO12 5PQ |
| St Josephs Close | YO12 6SS |
| St Marks Close | YO12 6SQ |
| Sycamore Park | YO12 6TP |
| The Crescent | YO12 5HP |
| The Croft | YO12 5JD |
| The Green | YO12 5JA |
| The Meadows | YO12 5JE |
| The Orchard | YO12 6NL |
| The Parkway | YO12 5PF |
| The Uplands | YO12 5HU YO12 5HX |
| The Whins | YO12 5JB |
| Thornville Avenue | YO12 6PN |
| Throxenby Grove | YO12 5HR |
| Throxenby Lane | YO12 5HN YO12 5HW YO12 5RE |
| Vernon Grove | YO12 6DP |
| West Park Avenue | YO12 6HH |
| West Park Crescent | YO12 6HJ |
| Westfield Avenue | YO12 6DG |
| Weydale Avenue | YO12 6AP YO12 6AW |
| Willow Garth | YO12 5HY YO12 5HZ |
| Woodville Avenue | YO12 6DL |
| Wreyfield Drive | YO12 6NP YO12 6NW |
Transport near Newby
- FAQ
- Price Paid By Year
- Property Type Price
Frequently asked questions about Newby
What is the average price for a property for sale in Newby?
The average price for a property for sale in Newby is £241,928. This amount is 17% higher than the average price in Scarborough. There are 723 property listings for sale in Newby.
What streets have the most expensive properties for sale in Newby?
The streets with the most expensive properties for sale in Newby are Fairway at an average of £540,000, Sea View Avenue at an average of £465,000 and Burniston Road at an average of £457,750.
What streets have the most affordable properties for sale in Newby?
The streets with the most affordable properties for sale in Newby are North Leas Avenue at an average of £112,750, Endcliff Crescent at an average of £129,666 and Heathcliffe Gardens at an average of £130,000.
Which train stations are available in or near Newby?
Some of the train stations available in or near Newby are Scarborough, Seamer and Filey.
Property Price Paid in Newby by Year
The average sold property price by year was:
| Year | Average Sold Price | Price Change |
Sold Properties
|
|---|---|---|---|
| 2025 | £245,694 | - |
74 Properties |
| 2024 | £245,659 | 4% |
91 Properties |
| 2023 | £235,807 | -7% |
101 Properties |
| 2022 | £252,417 | 15% |
97 Properties |
| 2021 | £214,040 | 11% |
141 Properties |
| 2020 | £191,041 | 7% |
96 Properties |
| 2019 | £178,096 | 1% |
87 Properties |
| 2018 | £175,593 | -4% |
118 Properties |
| 2017 | £181,951 | 6% |
116 Properties |
| 2016 | £170,539 | 4% |
94 Properties |
| 2015 | £163,017 | 1% |
126 Properties |
| 2014 | £161,536 | 4% |
115 Properties |
| 2013 | £155,344 | 3% |
88 Properties |
| 2012 | £150,442 | -3% |
69 Properties |
| 2011 | £155,582 | -3% |
69 Properties |
| 2010 | £159,569 | 4% |
83 Properties |
| 2009 | £153,808 | -9% |
89 Properties |
| 2008 | £167,189 | -4% |
59 Properties |
| 2007 | £173,993 | 6% |
132 Properties |
| 2006 | £164,313 | -2% |
126 Properties |
| 2005 | £168,338 | 6% |
105 Properties |
| 2004 | £158,719 | 27% |
114 Properties |
| 2003 | £115,879 | 10% |
161 Properties |
| 2002 | £103,725 | 22% |
126 Properties |
| 2001 | £81,026 | 14% |
147 Properties |
| 2000 | £69,941 | 1% |
133 Properties |
| 1999 | £69,349 | 11% |
155 Properties |
| 1998 | £61,526 | 7% |
129 Properties |
| 1997 | £57,248 | 4% |
133 Properties |
| 1996 | £54,855 | -6% |
108 Properties |
| 1995 | £58,027 | - |
90 Properties |
Property Price per Property Type in Newby
Here you can find historic sold price data in order to help with your property search.
The average Property Paid Price for specific property types in the last three years are:
| Property Type | Average Sold Price | Sold Properties |
|---|---|---|
| Semi Detached House | £224,477.00 | 187 Semi Detached Houses |
| Detached House | £354,985.00 | 49 Detached Houses |
| Terraced House | £182,147.00 | 17 Terraced Houses |
| Flat | £145,000.00 | 13 Flats |

