
Houses for sale & to rent in OX17 3AJ, Skittle Alley, Little Brook, Banbury
House Prices in OX17 3AJ, Skittle Alley, Little Brook
Properties in OX17 3AJ have no sales history available within the last 3 years. OX17 3AJ is a postcode in Skittle Alley located in Little Brook, an area in Banbury, Northamptonshire, with 3 households².
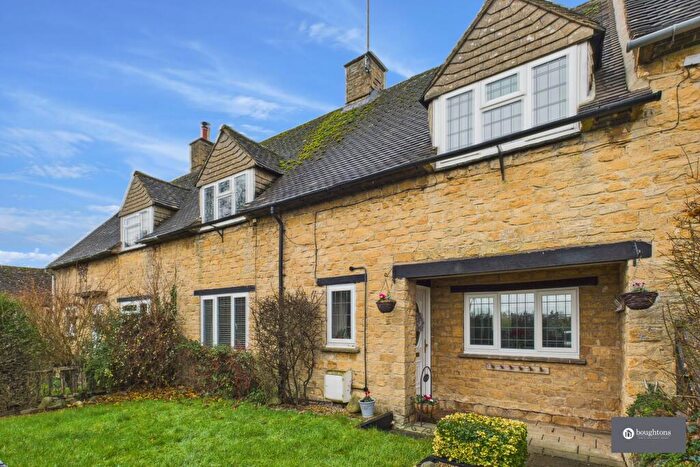
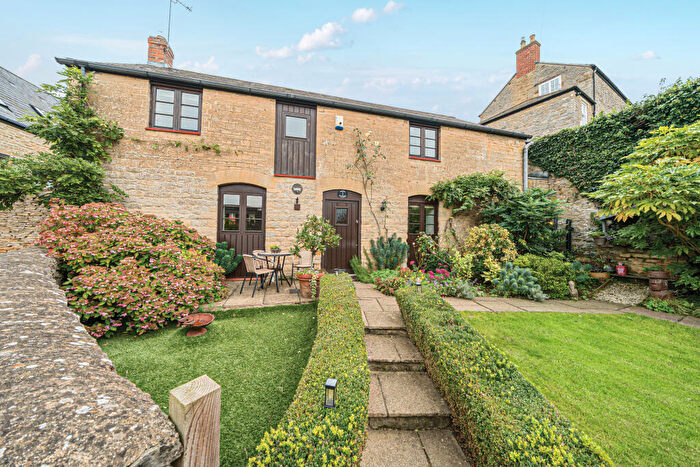
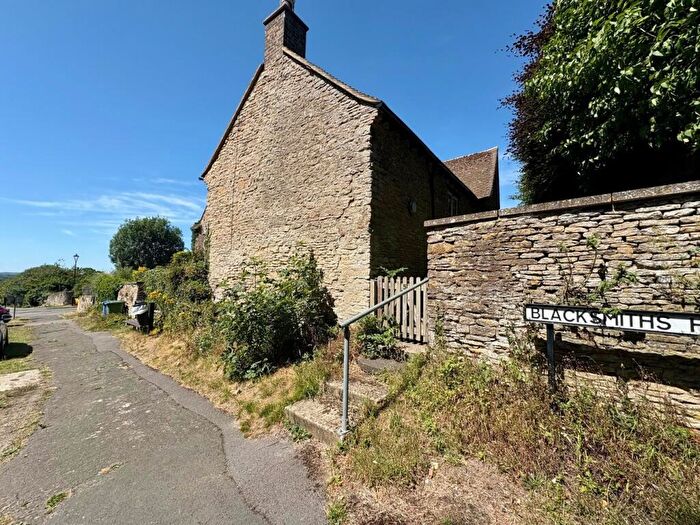
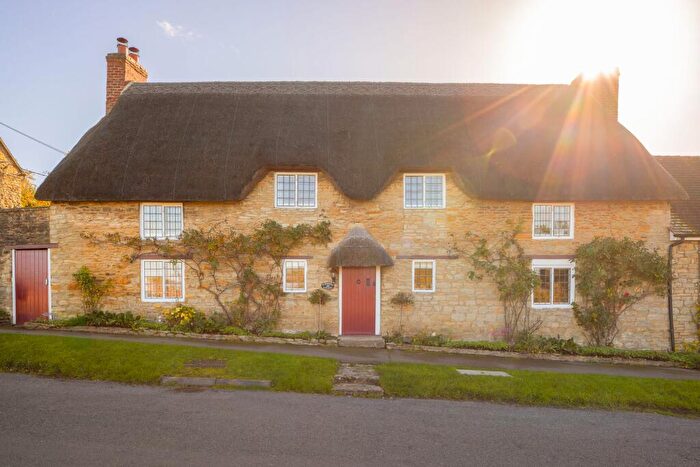
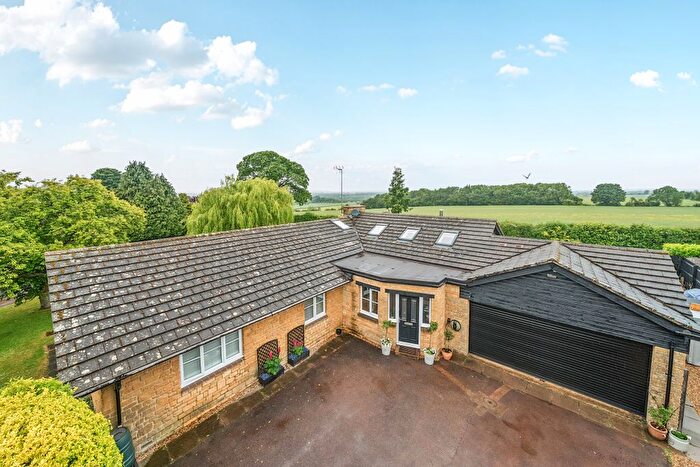
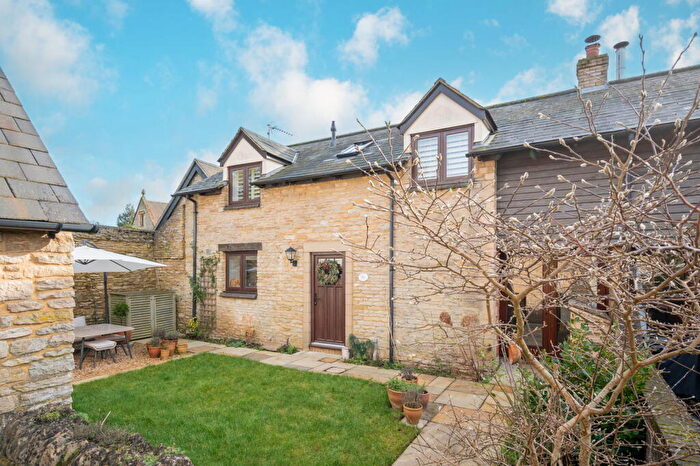
Properties for sale near OX17 3AJ, Skittle Alley


![]()
If you are looking to sell your house, let it out, or receive a property valuation, an expert can help you.
Click the button below to get started.
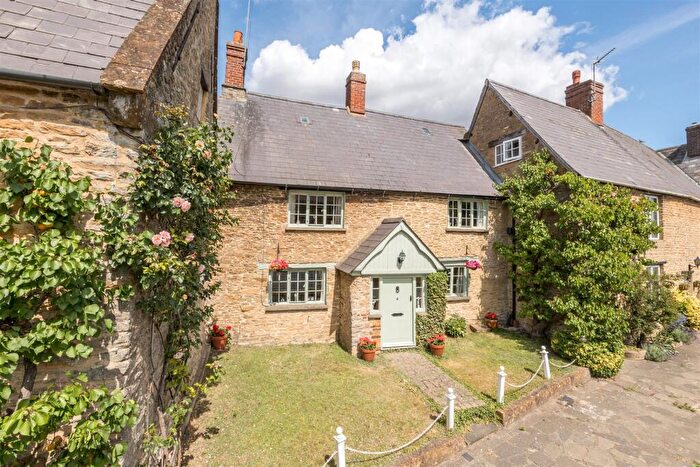
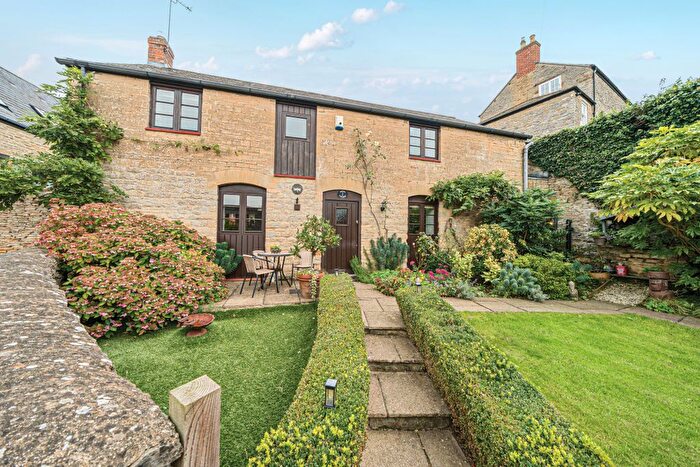
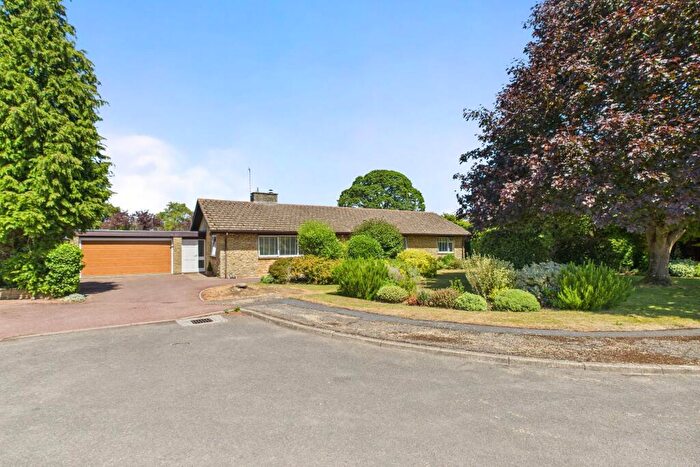
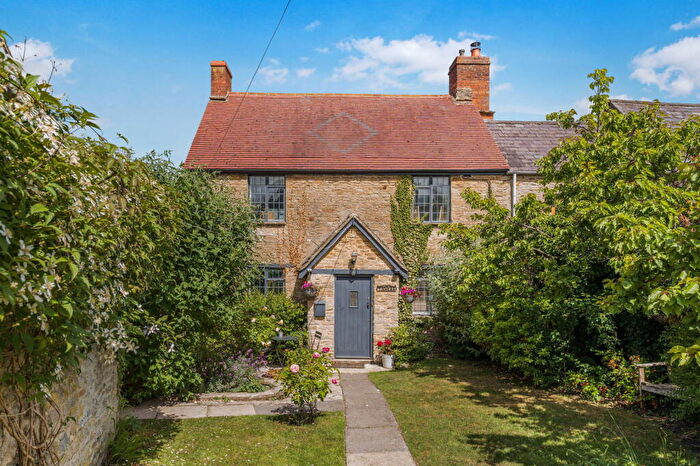
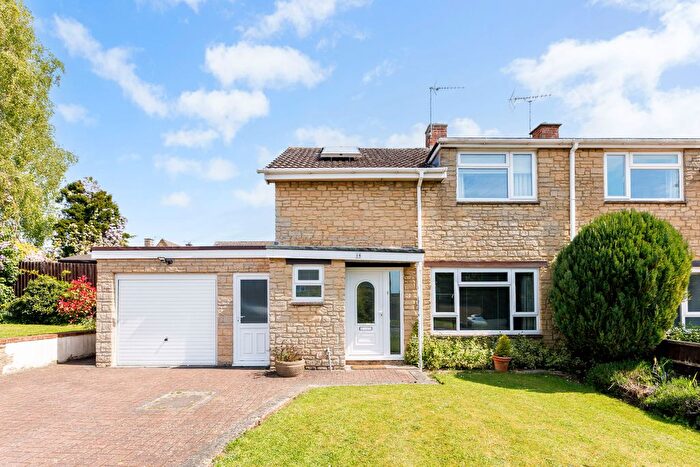
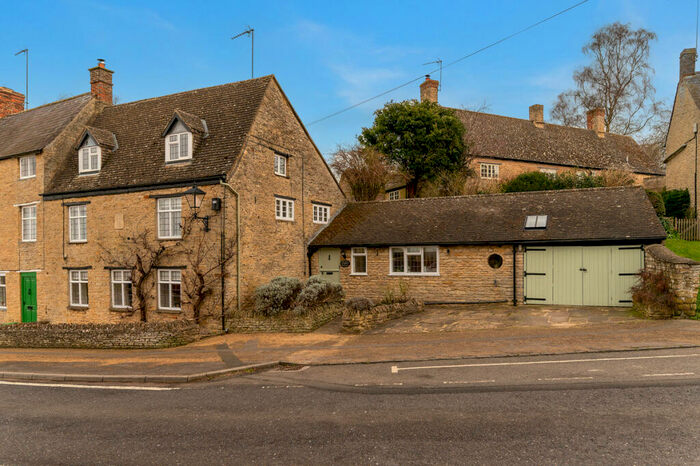
Previously listed properties near OX17 3AJ, Skittle Alley


![]()
If you are looking to sell your house, let it out, or receive a property valuation, an expert can help you.
Click the button below to get started.


Price Paid in Skittle Alley, OX17 3AJ, Little Brook
2 Skittle Alley, OX17 3AJ, Little Brook Banbury
Property 2 has been sold 4 times. The last time it was sold was in 20/08/2021 and the sold price was £355,000.00.
This semi detached house, sold as a freehold on 20/08/2021, is a 103 sqm semi-detached house with an EPC rating of F.
| Date | Price | Property Type | Tenure | Classification |
|---|---|---|---|---|
| 20/08/2021 | £355,000.00 | Semi Detached House | freehold | Established Building |
| 06/07/2015 | £299,000.00 | Semi Detached House | freehold | Established Building |
| 15/05/1998 | £120,000.00 | Semi Detached House | freehold | Established Building |
| 15/01/1996 | £75,000.00 | Semi Detached House | freehold | Established Building |
3 Skittle Alley, OX17 3AJ, Little Brook Banbury
Property 3 has been sold 2 times. The last time it was sold was in 30/07/2020 and the sold price was £685,000.00.
This is a Detached House which was sold as a freehold in 30/07/2020
| Date | Price | Property Type | Tenure | Classification |
|---|---|---|---|---|
| 30/07/2020 | £685,000.00 | Detached House | freehold | Established Building |
| 01/07/1996 | £279,999.00 | Detached House | freehold | Established Building |
Transport near OX17 3AJ, Skittle Alley
-
 King's Sutton Station
 -
Banbury Station
-
Heyford Station
-
Bicester North Station
-
Tackley Station
-
Bicester Village Station
House price paid reports for OX17 3AJ, Skittle Alley
Click on the buttons below to see price paid reports by year or property price:
- Price Paid By Year
Property Price Paid in OX17 3AJ, Skittle Alley by Year
The average sold property price by year was:
| Year | Average Sold Price | Price Change |
Sold Properties
|
|---|---|---|---|
| 2021 | £355,000 | -93% |
1 Property |
| 2020 | £685,000 | 56% |
1 Property |
| 2015 | £299,000 | 60% |
1 Property |
| 1998 | £120,000 | -48% |
1 Property |
| 1996 | £177,499 | - |
2 Properties |