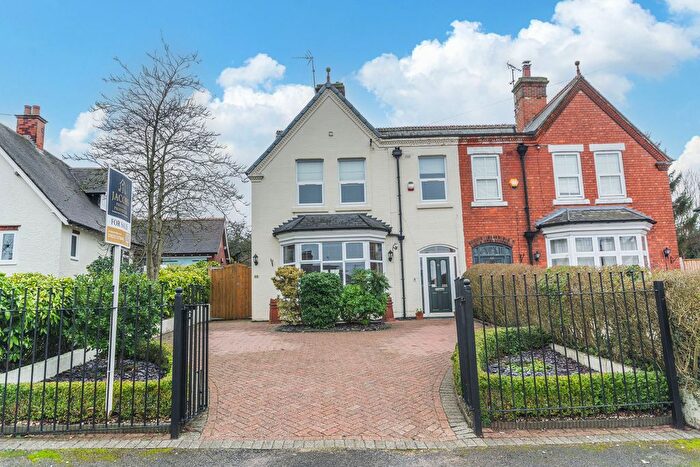
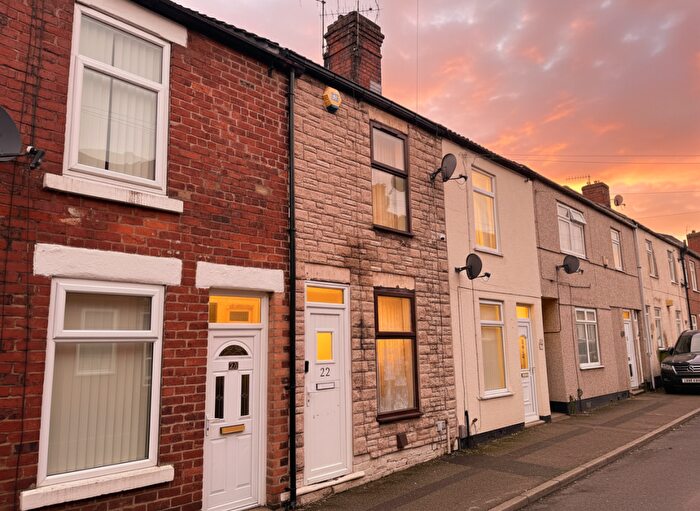
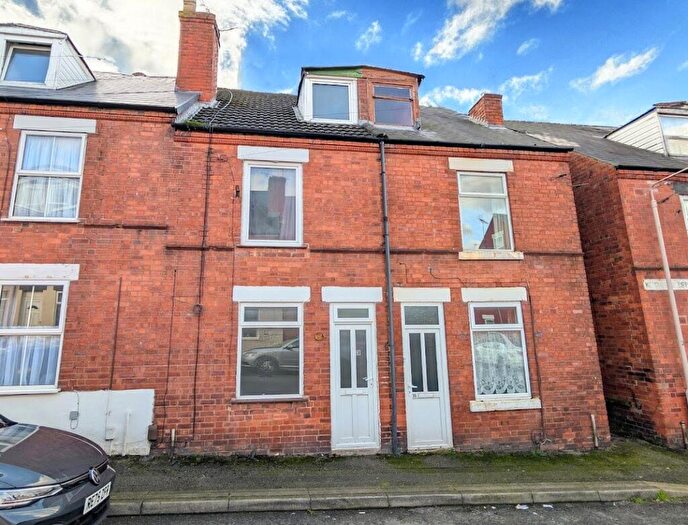
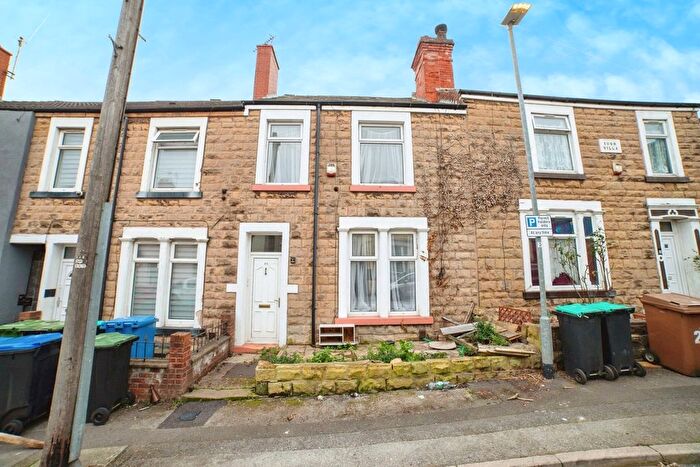
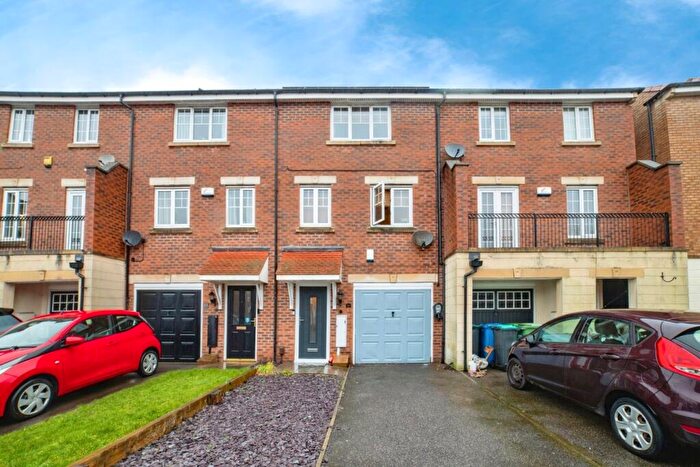
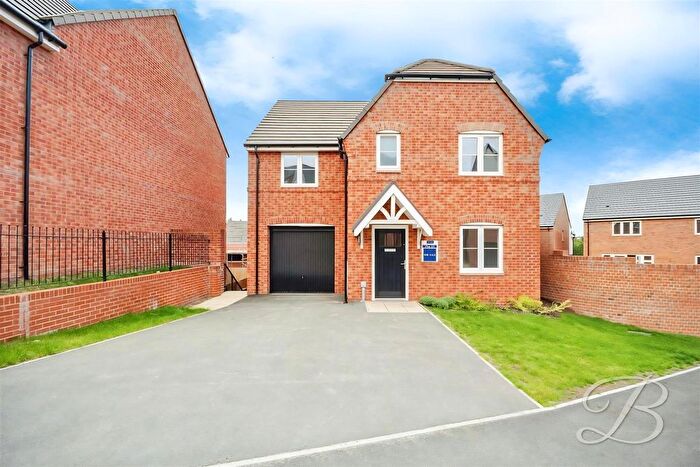
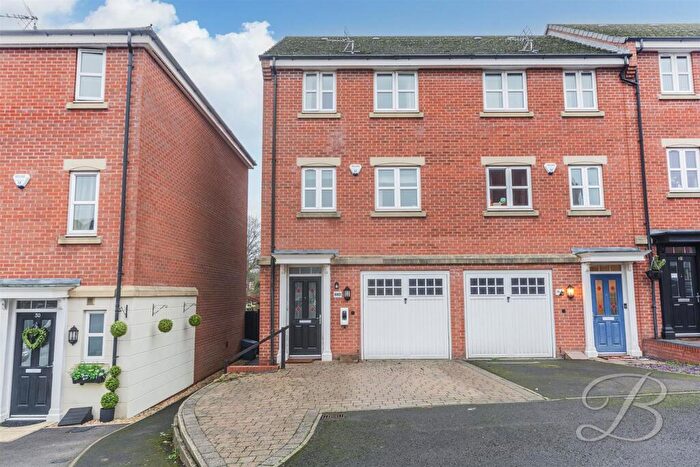
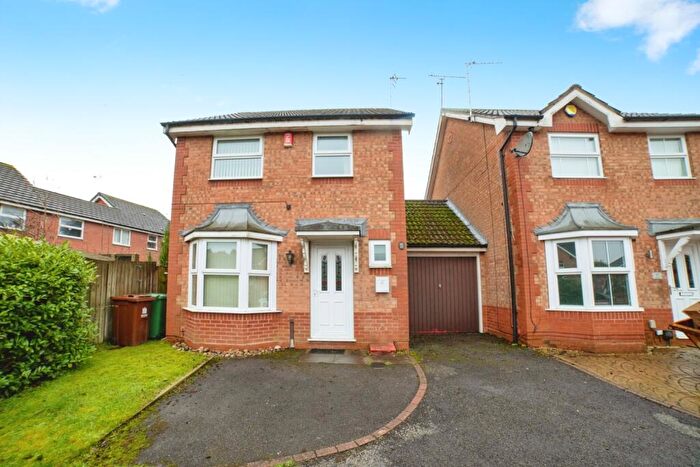
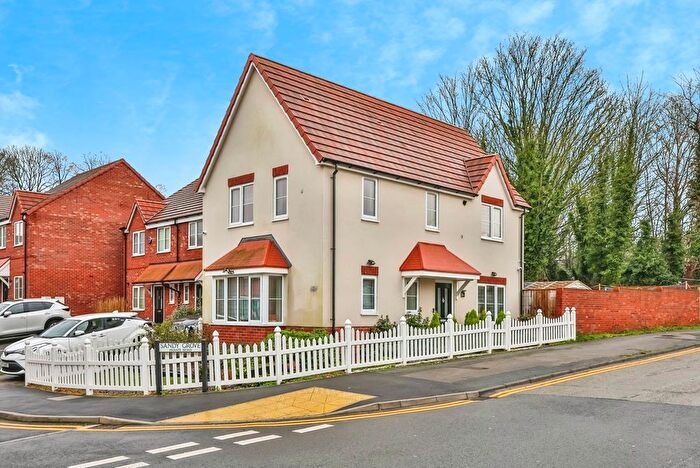
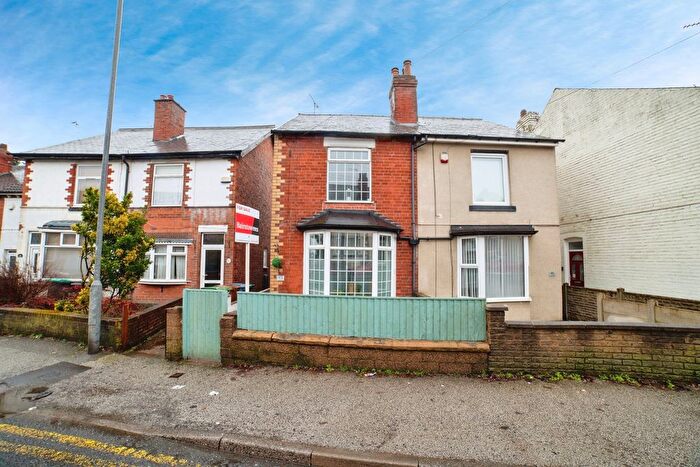
Houses for sale & to rent in Sandhurst, Mansfield
House Prices in Sandhurst
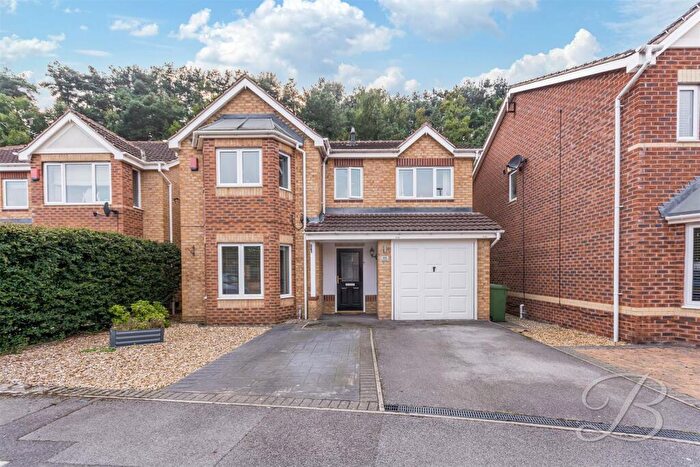
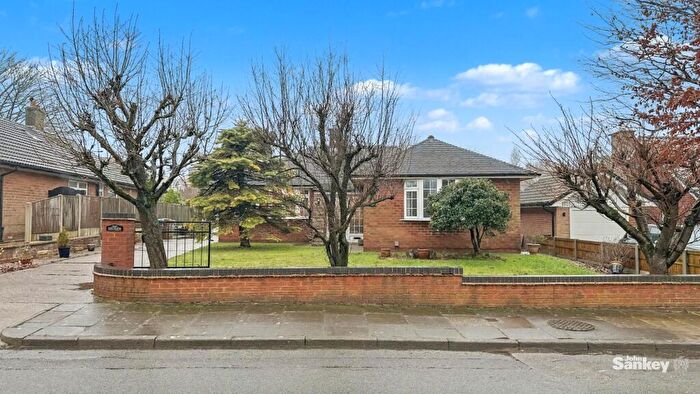
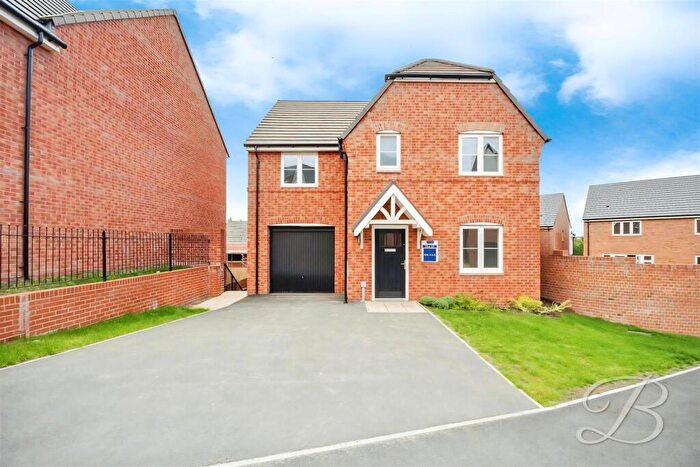
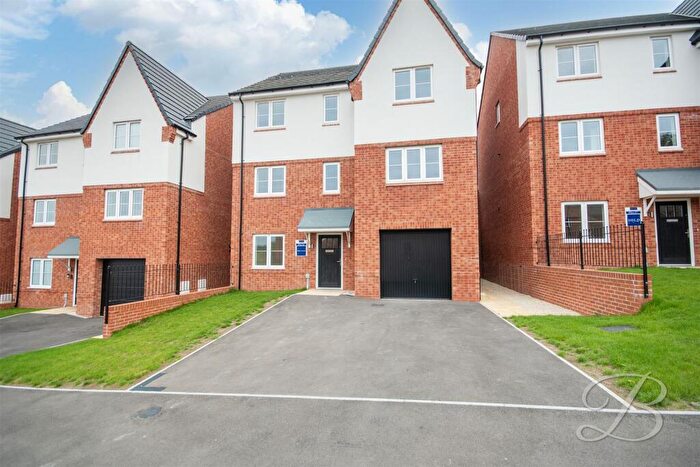
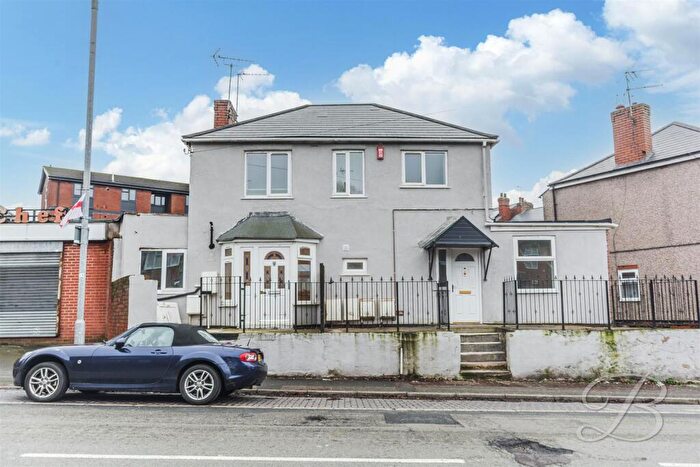
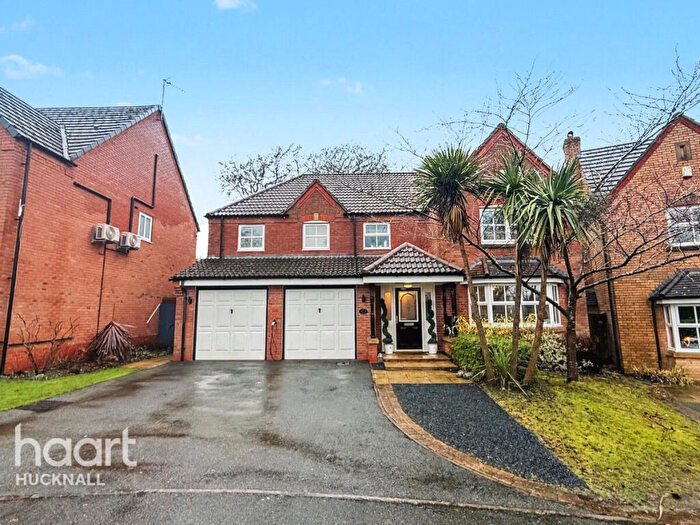
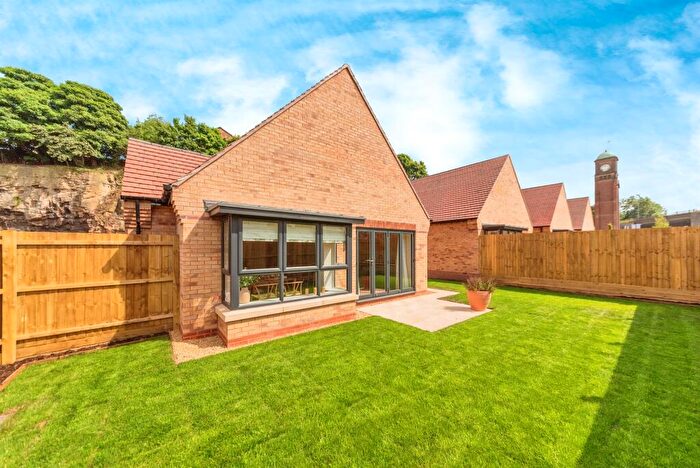
Properties in Sandhurst have an average house price of £153,618.00 and had 184 Property Transactions within the last 3 years¹.
Sandhurst is an area in Mansfield, Nottinghamshire with 1,255 households², where the most expensive property was sold for £520,000.00.
Properties for sale in Sandhurst
Roads and Postcodes in Sandhurst
Navigate through our locations to find the location of your next house in Sandhurst, Mansfield for sale or to rent.
| Streets | Postcodes |
|---|---|
| Anvil Court | NG18 4FX |
| Baums Lane | NG18 2RA |
| Berry Hill Lane | NG18 4BP |
| Berry Hill Road | NG18 4RX |
| Bessemer Drive | NG18 4FY |
| Blackthorn Drive | NG18 4BR |
| Blakeney Drive | NG18 4DN |
| Burnham Court | NG18 4DW |
| Cavendish Street | NG18 2RU |
| Cedar Street | NG18 2RZ |
| Central Avenue | NG18 2RD |
| Clifford Street | NG18 4AQ |
| Cromer Close | NG18 4DP |
| Cromwell Street | NG18 2SF NG18 2SG |
| Dean Close | NG18 4DB |
| Delamere Close | NG18 4DJ |
| Delamere Drive | NG18 4DD NG18 4DE NG18 4DF |
| Derby Street | NG18 2SD NG18 2SE |
| Ferndale | NG18 2RP |
| Fisher Lane | NG18 2SA NG18 2SB |
| Forest Avenue | NG18 4BX |
| Forest Road | NG18 4BT NG18 4BU NG18 4BY |
| Foster Street | NG18 2RX |
| Gedling Street | NG18 4AH |
| Honister Close | NG18 4DG |
| Honister Court | NG18 4DQ |
| Kitchener Drive | NG18 2JG |
| Laurel Avenue | NG18 2RY |
| Littleworth | NG18 2RT NG18 2SH NG18 2SQ |
| Meadow Avenue | NG18 2RB |
| Mount Milner | NG18 2JQ |
| Mulberry Close | NG18 4BF |
| Murray Street | NG18 4AR NG18 4AS |
| Newton Street | NG18 2RH NG18 2RQ |
| Nottingham Road | NG18 4AE NG18 4AJ |
| Park View Way | NG18 2RN |
| Ringwood Avenue | NG18 4DA |
| Roseberry Hill | NG18 2JH |
| Rutland Street | NG18 4AP NG18 4AW |
| Sheringham Drive | NG18 4DL |
| St Andrews Street | NG18 2RG |
| St Catherine Street | NG18 2RF |
| St Margaret Street | NG18 2RE |
| Stella Street | NG18 4AL NG18 4AN |
| Talbot Street | NG18 4AG |
| Tudor Drive | NG18 4DH |
| Woodford Cottages | NG18 2RS |
Transport near Sandhurst
- FAQ
- Price Paid By Year
- Property Type Price
Frequently asked questions about Sandhurst
What is the average price for a property for sale in Sandhurst?
The average price for a property for sale in Sandhurst is £153,618. This amount is 21% lower than the average price in Mansfield. There are 1,278 property listings for sale in Sandhurst.
What streets have the most expensive properties for sale in Sandhurst?
The streets with the most expensive properties for sale in Sandhurst are Berry Hill Lane at an average of £373,500, Delamere Close at an average of £295,000 and Dean Close at an average of £280,000.
What streets have the most affordable properties for sale in Sandhurst?
The streets with the most affordable properties for sale in Sandhurst are Clifford Street at an average of £82,250, Derby Street at an average of £85,642 and Newton Street at an average of £91,888.
Which train stations are available in or near Sandhurst?
Some of the train stations available in or near Sandhurst are Mansfield Town, Mansfield Woodhouse and Sutton Parkway.
Property Price Paid in Sandhurst by Year
The average sold property price by year was:
| Year | Average Sold Price | Price Change |
Sold Properties
|
|---|---|---|---|
| 2025 | £153,357 | 2% |
60 Properties |
| 2024 | £149,544 | -6% |
67 Properties |
| 2023 | £158,683 | -2% |
57 Properties |
| 2022 | £161,178 | 13% |
73 Properties |
| 2021 | £139,805 | 14% |
74 Properties |
| 2020 | £120,827 | -10% |
65 Properties |
| 2019 | £133,136 | 2% |
47 Properties |
| 2018 | £129,957 | 7% |
63 Properties |
| 2017 | £120,736 | 1% |
63 Properties |
| 2016 | £120,050 | 12% |
67 Properties |
| 2015 | £105,913 | 6% |
80 Properties |
| 2014 | £99,119 | -7% |
59 Properties |
| 2013 | £106,054 | -0,2% |
44 Properties |
| 2012 | £106,245 | 2% |
40 Properties |
| 2011 | £103,850 | -0,3% |
61 Properties |
| 2010 | £104,183 | -5% |
53 Properties |
| 2009 | £108,957 | -0,1% |
48 Properties |
| 2008 | £109,027 | -15% |
66 Properties |
| 2007 | £124,906 | 25% |
97 Properties |
| 2006 | £93,118 | 9% |
100 Properties |
| 2005 | £84,594 | 4% |
85 Properties |
| 2004 | £81,343 | 31% |
93 Properties |
| 2003 | £56,098 | 23% |
114 Properties |
| 2002 | £43,349 | 7% |
109 Properties |
| 2001 | £40,364 | 10% |
78 Properties |
| 2000 | £36,337 | -8% |
76 Properties |
| 1999 | £39,081 | 14% |
56 Properties |
| 1998 | £33,581 | -6% |
64 Properties |
| 1997 | £35,729 | 8% |
47 Properties |
| 1996 | £33,026 | 9% |
53 Properties |
| 1995 | £30,152 | - |
52 Properties |
Property Price per Property Type in Sandhurst
Here you can find historic sold price data in order to help with your property search.
The average Property Paid Price for specific property types in the last three years are:
| Property Type | Average Sold Price | Sold Properties |
|---|---|---|
| Semi Detached House | £165,438.00 | 41 Semi Detached Houses |
| Detached House | £263,933.00 | 30 Detached Houses |
| Terraced House | £120,132.00 | 112 Terraced Houses |
| Flat | £110,000.00 | 1 Flat |

