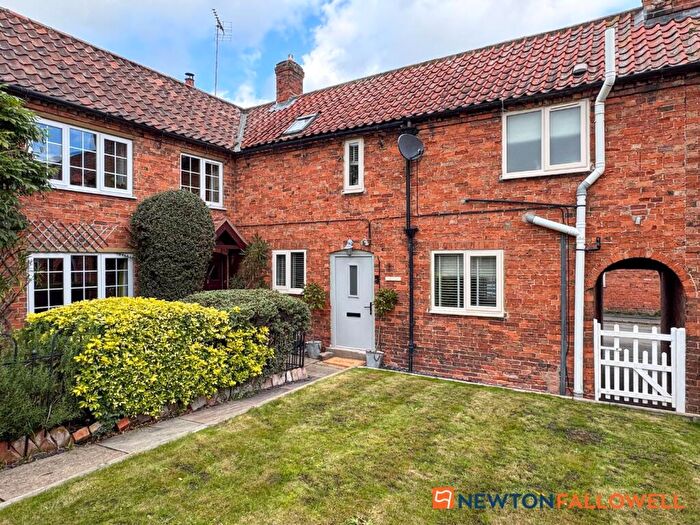
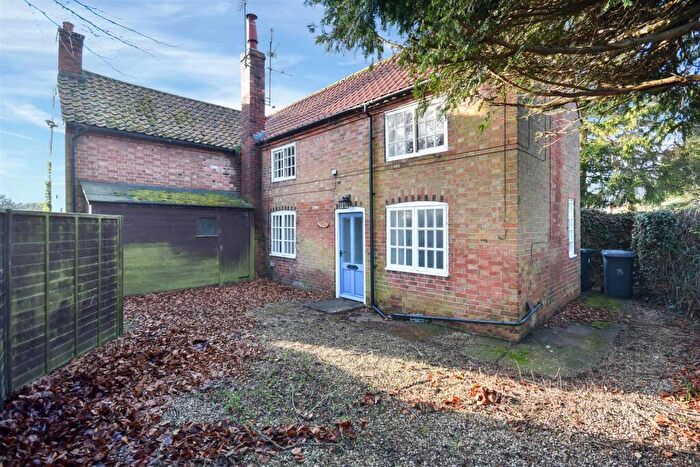
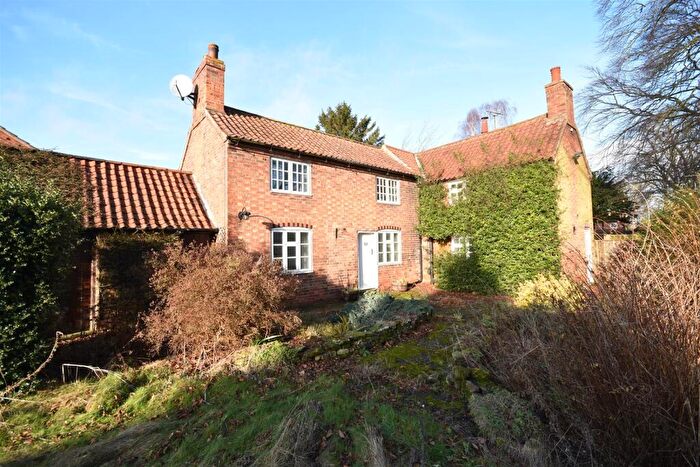
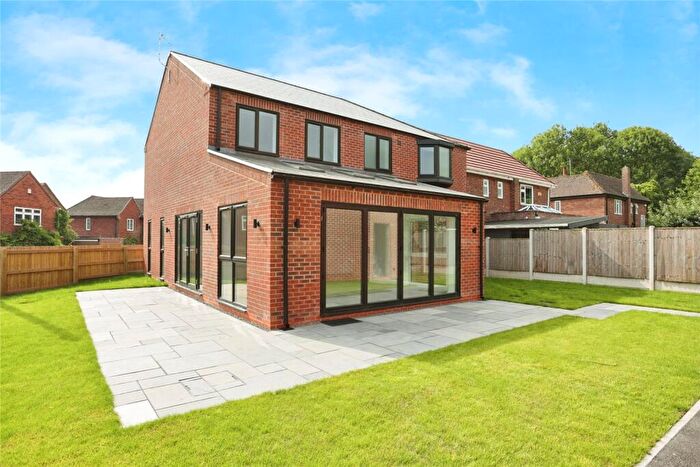
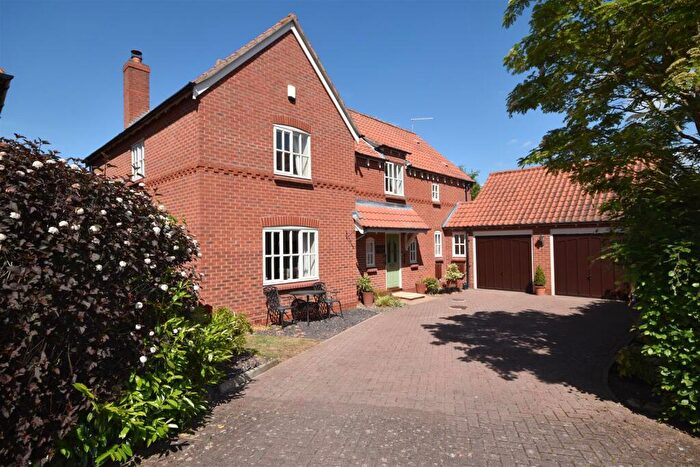
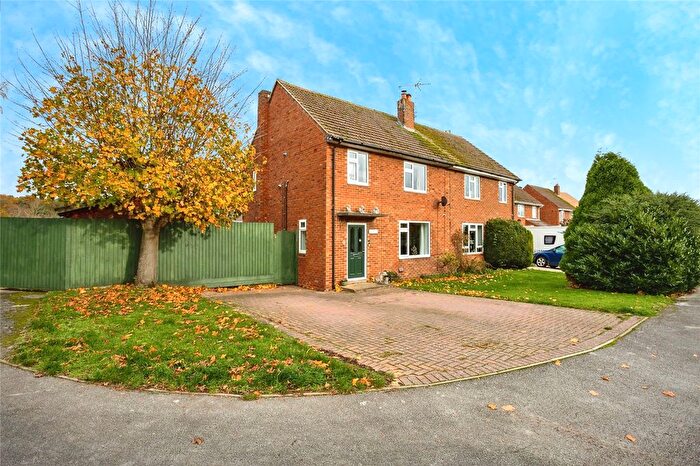
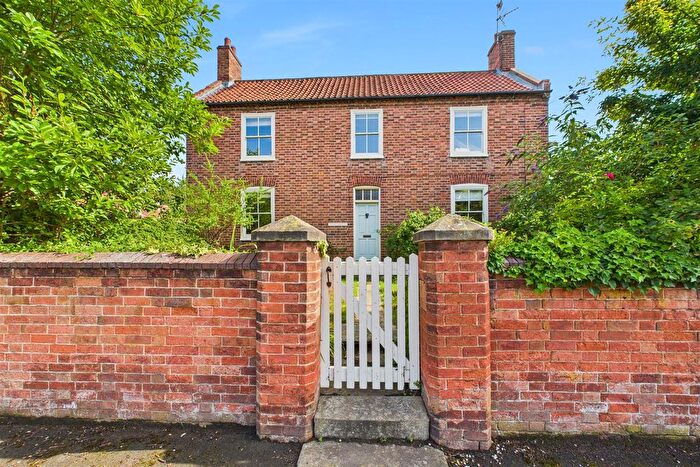
Houses for sale & to rent in Thoroton, Newark
House Prices in Thoroton
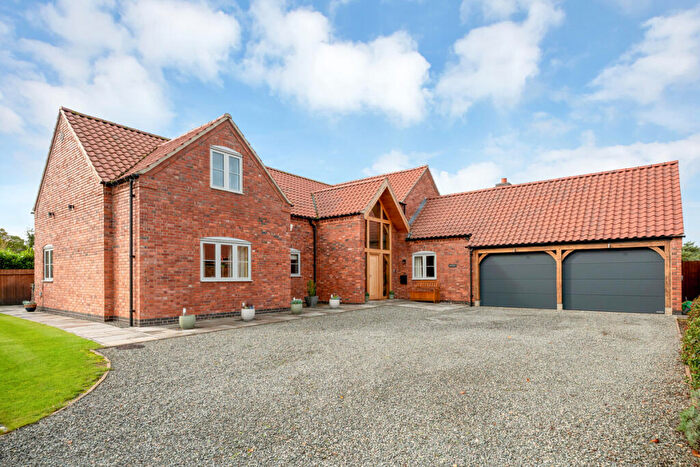
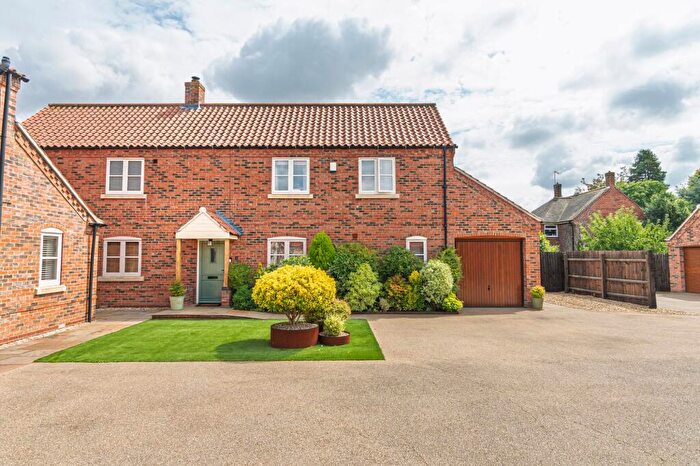
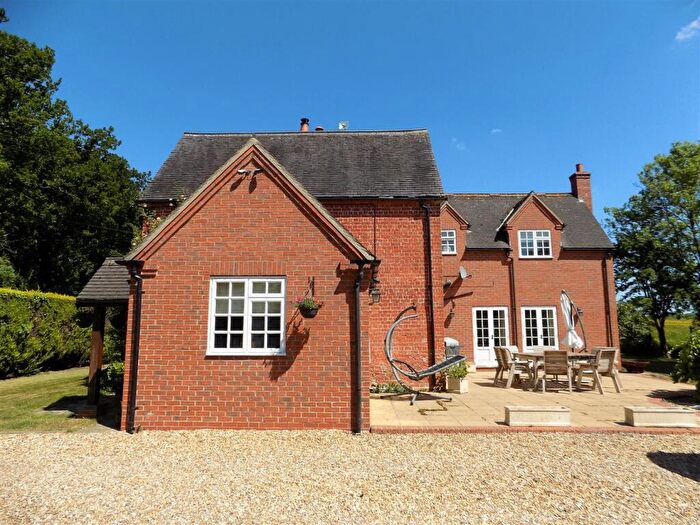
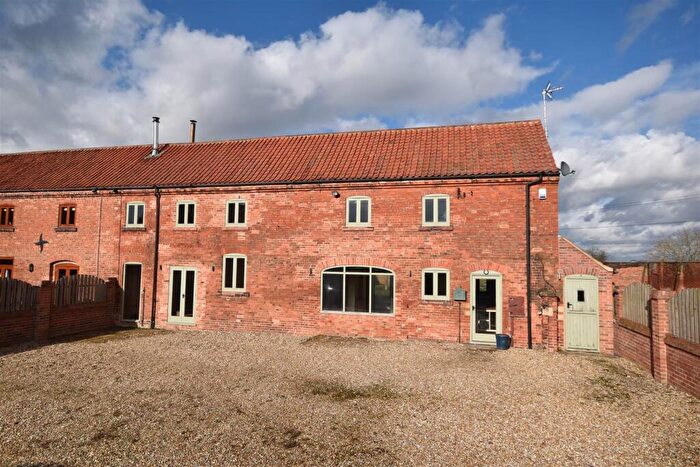
Properties in Thoroton have an average house price of £367,365.00 and had 23 Property Transactions within the last 3 years¹.
Thoroton is an area in Newark, Nottinghamshire with 344 households², where the most expensive property was sold for £750,000.00.
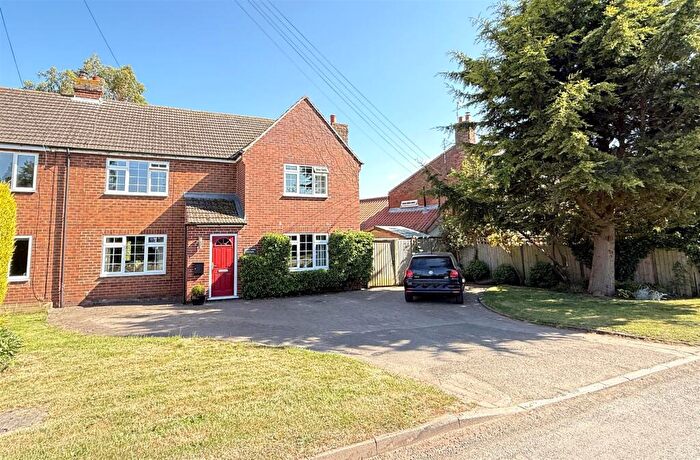
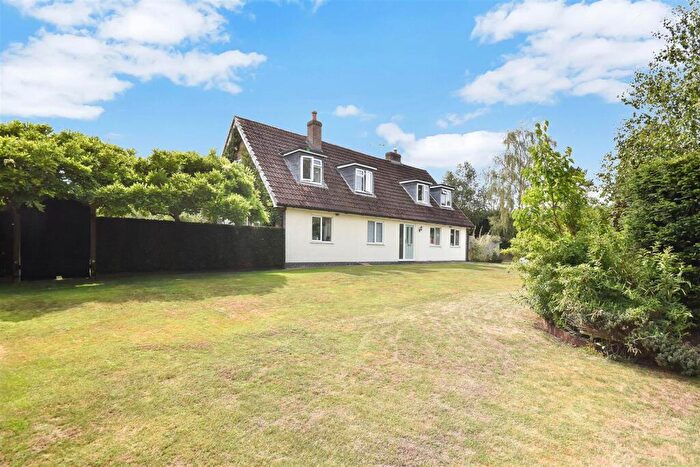
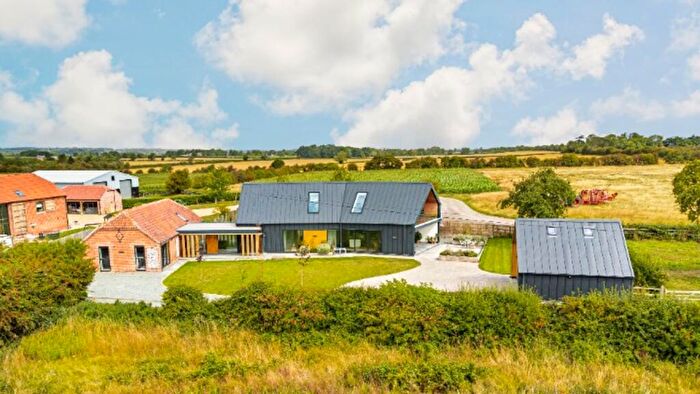
Properties for sale in Thoroton
Previously listed properties in Thoroton
Roads and Postcodes in Thoroton
Navigate through our locations to find the location of your next house in Thoroton, Newark for sale or to rent.
| Streets | Postcodes |
|---|---|
| Back Lane | NG23 5LS |
| Baxter Lane | NG23 5RW |
| Burnell Close | NG23 5PT |
| Coneygrey Spinney | NG23 5LN NG23 5LP NG23 5LW |
| Fosse Road | NG23 5LH NG23 5LL |
| Fosse Way | NG23 5LJ |
| Inholms Gardens | NG23 5LQ |
| Inholms Road | NG23 5LF NG23 5LG |
| Main Street | NG23 5JG NG23 5LA |
| Oakwood | NG23 5LZ |
| Spring Lane | NG23 5LB |
| St Anns Way | NG23 5JH |
| Town End Lane | NG23 5LT |
| Woodland Spinney | NG23 5LY |
| Woods Lane | NG23 5LR |
| NG23 5JL NG23 5JQ NG23 5PN NG23 5JJ NG23 5LE NG23 5LU NG23 5NN |
Transport near Thoroton
-
Bleasby Station
-
Thurgarton Station
-
Aslockton Station
-
Elton and Orston Station
-
Fiskerton Station
-
Rolleston Station
-
Bingham Station
-
Lowdham Station
- FAQ
- Price Paid By Year
- Property Type Price
Frequently asked questions about Thoroton
What is the average price for a property for sale in Thoroton?
The average price for a property for sale in Thoroton is £367,365. This amount is 47% higher than the average price in Newark. There are 107 property listings for sale in Thoroton.
What streets have the most expensive properties for sale in Thoroton?
The streets with the most expensive properties for sale in Thoroton are Woods Lane at an average of £747,500, Burnell Close at an average of £595,000 and Inholms Road at an average of £585,000.
What streets have the most affordable properties for sale in Thoroton?
The streets with the most affordable properties for sale in Thoroton are Woodland Spinney at an average of £132,500, Coneygrey Spinney at an average of £225,375 and Inholms Gardens at an average of £319,800.
Which train stations are available in or near Thoroton?
Some of the train stations available in or near Thoroton are Bleasby, Thurgarton and Aslockton.
Property Price Paid in Thoroton by Year
The average sold property price by year was:
| Year | Average Sold Price | Price Change |
Sold Properties
|
|---|---|---|---|
| 2025 | £411,250 | -2% |
6 Properties |
| 2024 | £420,000 | 31% |
8 Properties |
| 2023 | £291,322 | -36% |
9 Properties |
| 2022 | £395,550 | 17% |
9 Properties |
| 2021 | £329,722 | -12% |
18 Properties |
| 2020 | £369,245 | 11% |
10 Properties |
| 2019 | £328,333 | 21% |
6 Properties |
| 2018 | £260,461 | -18% |
13 Properties |
| 2017 | £308,450 | 15% |
10 Properties |
| 2016 | £263,557 | 6% |
13 Properties |
| 2015 | £246,607 | -7% |
14 Properties |
| 2014 | £264,041 | 28% |
12 Properties |
| 2013 | £188,888 | 9% |
9 Properties |
| 2012 | £171,522 | -37% |
9 Properties |
| 2011 | £235,611 | -39% |
9 Properties |
| 2010 | £328,000 | 36% |
5 Properties |
| 2009 | £208,909 | -3% |
11 Properties |
| 2008 | £215,283 | -12% |
12 Properties |
| 2007 | £240,889 | 11% |
19 Properties |
| 2006 | £214,955 | 20% |
17 Properties |
| 2005 | £172,868 | -64% |
22 Properties |
| 2004 | £283,065 | 45% |
13 Properties |
| 2003 | £154,454 | -9% |
11 Properties |
| 2002 | £168,259 | 45% |
16 Properties |
| 2001 | £92,225 | 13% |
17 Properties |
| 2000 | £80,174 | -11% |
22 Properties |
| 1999 | £89,129 | 34% |
29 Properties |
| 1998 | £58,428 | 12% |
14 Properties |
| 1997 | £51,280 | -67% |
47 Properties |
| 1996 | £85,800 | 6% |
10 Properties |
| 1995 | £80,857 | - |
7 Properties |
Property Price per Property Type in Thoroton
Here you can find historic sold price data in order to help with your property search.
The average Property Paid Price for specific property types in the last three years are:
| Property Type | Average Sold Price | Sold Properties |
|---|---|---|
| Semi Detached House | £235,290.00 | 10 Semi Detached Houses |
| Terraced House | £132,500.00 | 1 Terraced House |
| Detached House | £497,000.00 | 12 Detached Houses |

