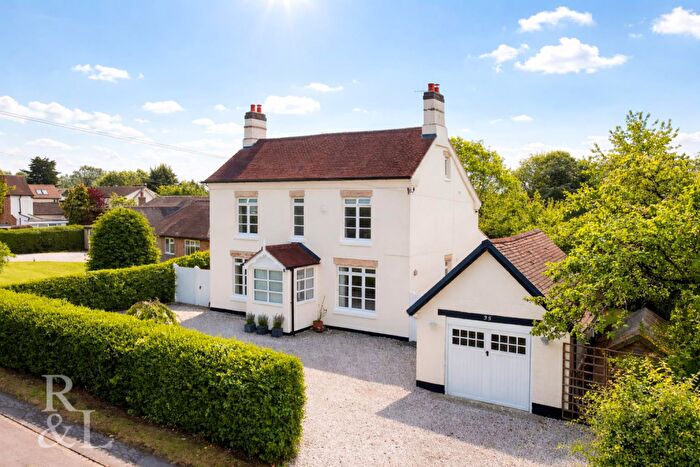
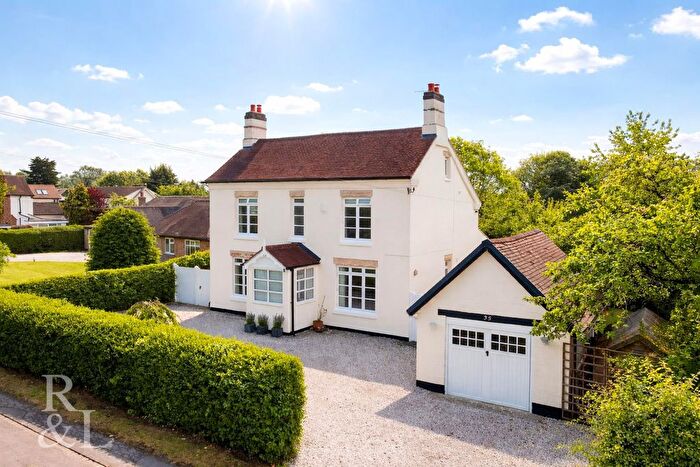
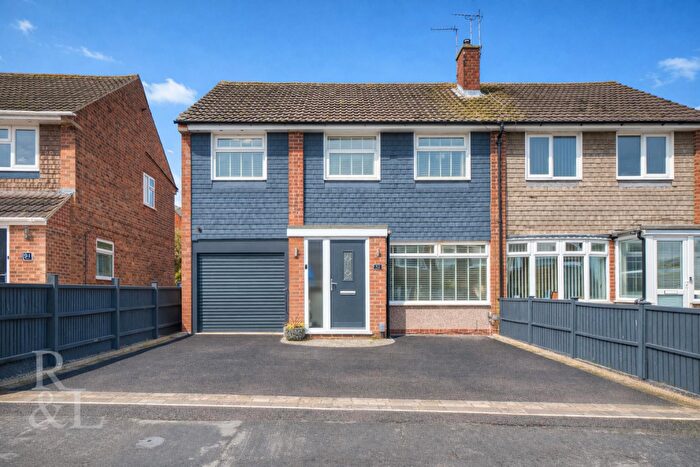
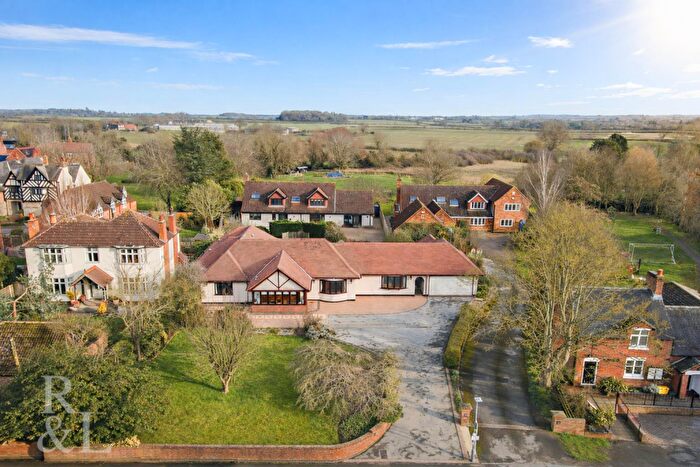
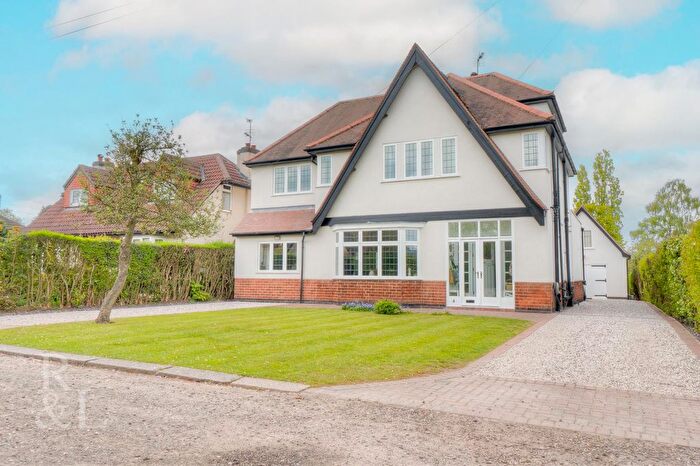
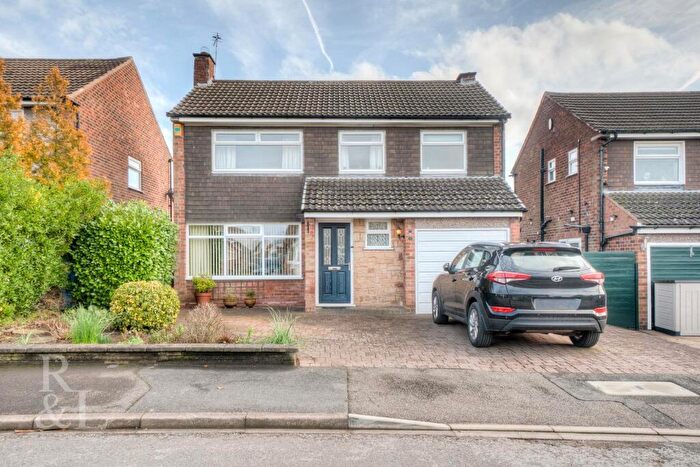
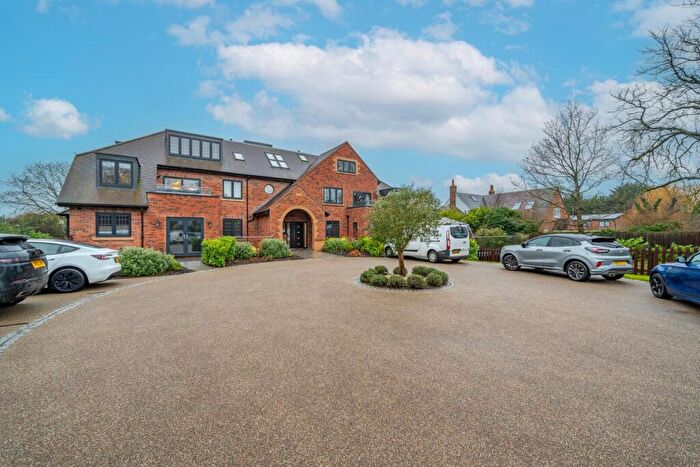
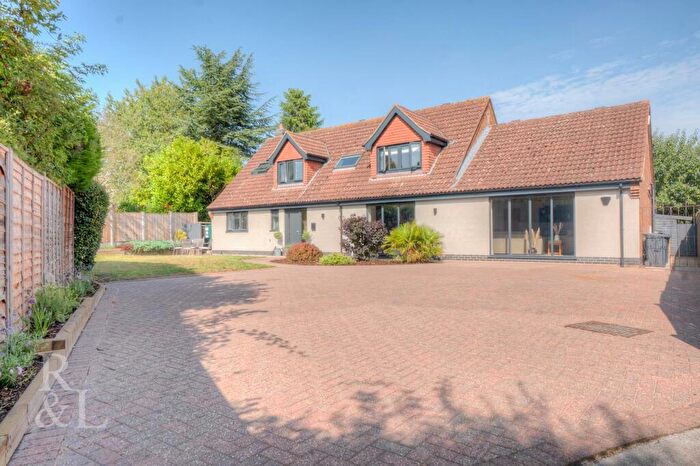
Houses for sale & to rent in Wolds, Nottingham
House Prices in Wolds
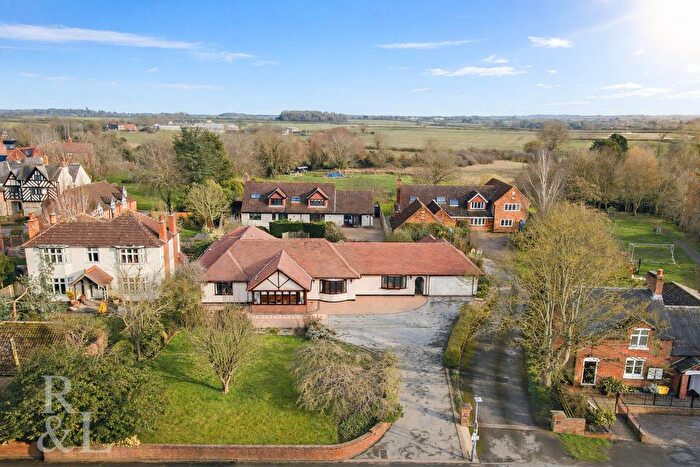
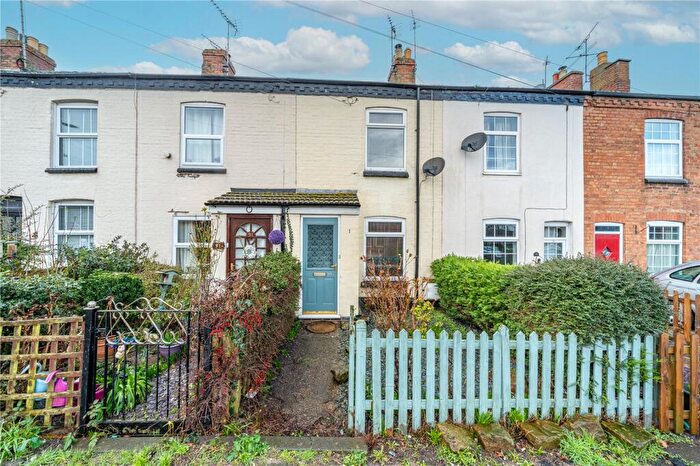
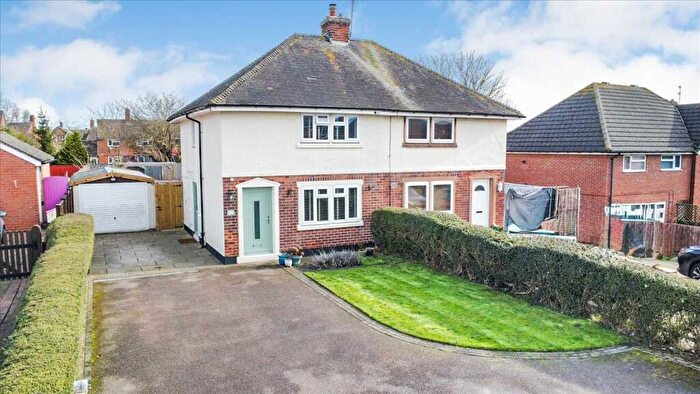
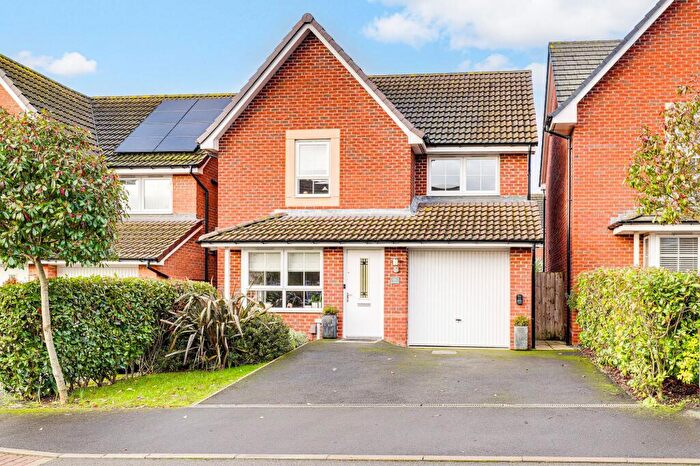
Properties in Wolds have an average house price of £676,852.00 and had 58 Property Transactions within the last 3 years¹.
Wolds is an area in Nottingham, Nottinghamshire with 611 households², where the most expensive property was sold for £2,500,000.00.
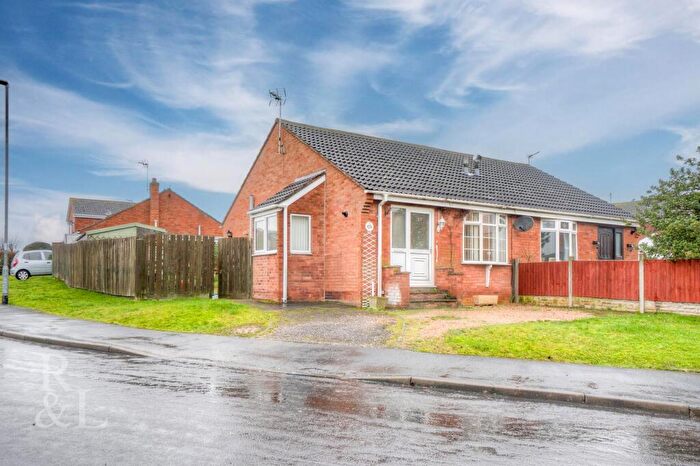
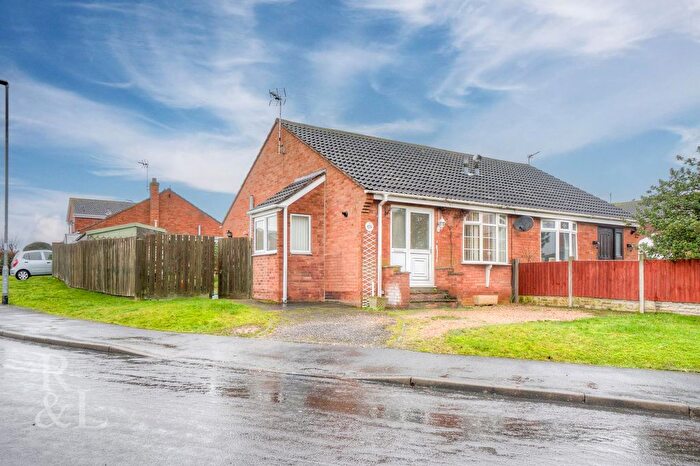
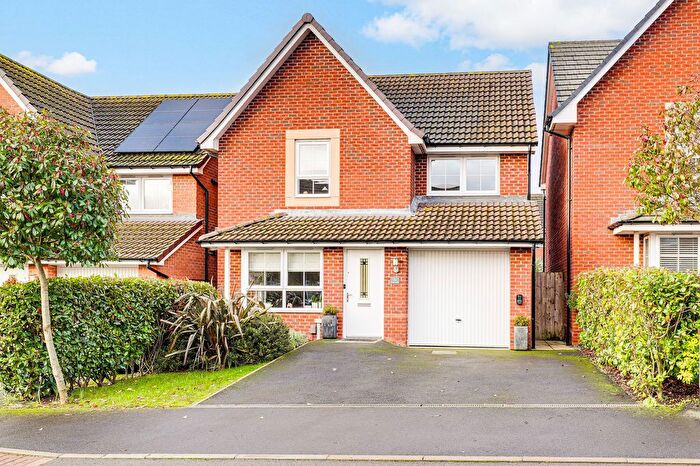
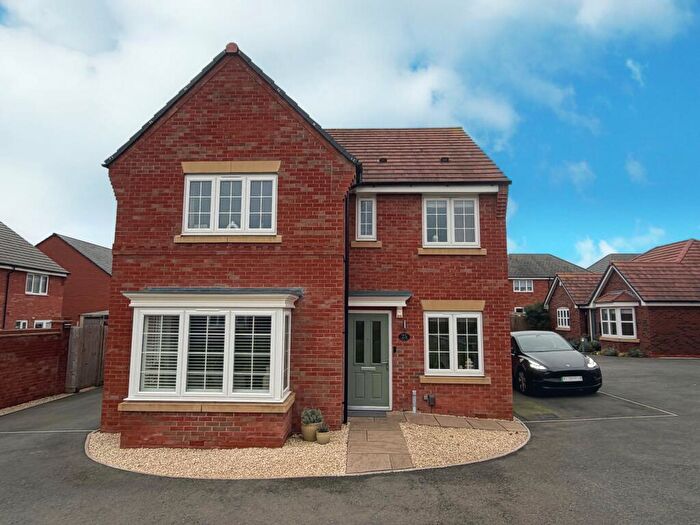
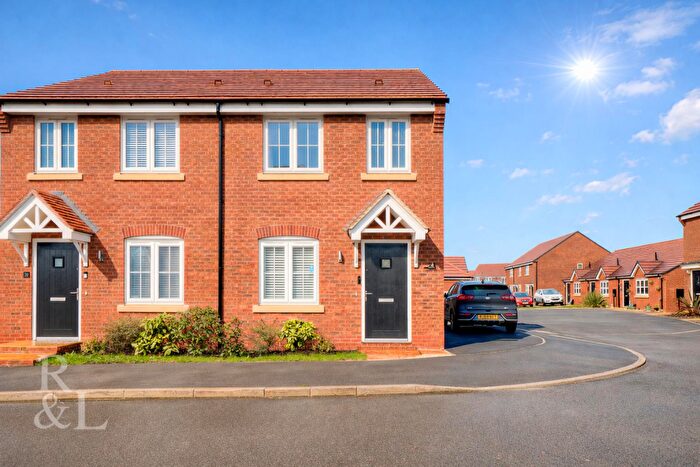
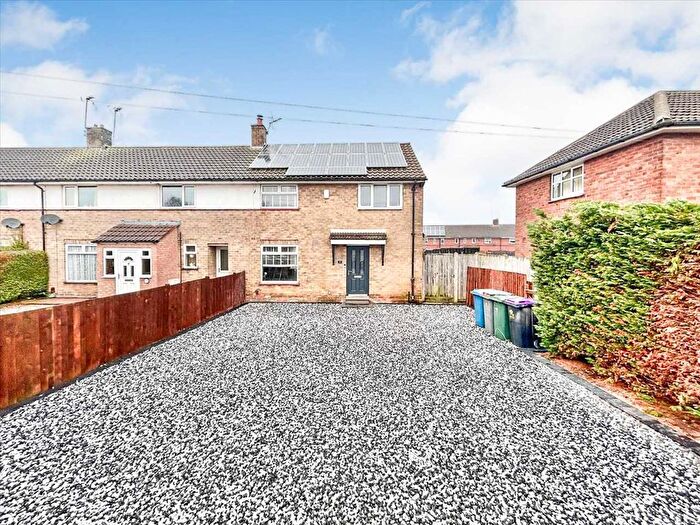
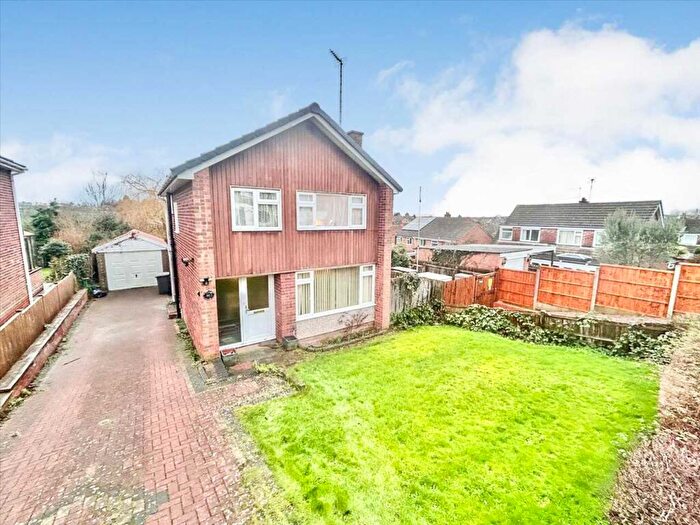
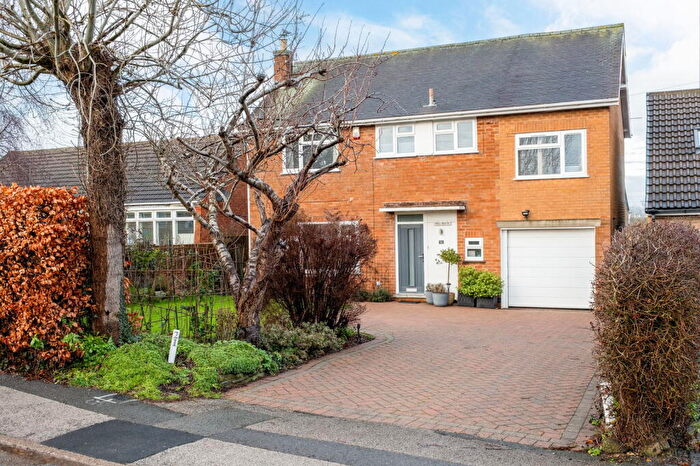
Properties for sale in Wolds
Roads and Postcodes in Wolds
Navigate through our locations to find the location of your next house in Wolds, Nottingham for sale or to rent.
| Streets | Postcodes |
|---|---|
| Back Lane | NG12 5NP |
| Bradleys Yard | NG12 5NR |
| Bradmore Lane | NG12 5EW |
| Bradmore Road | NG12 5QR |
| Brooklands | NG12 5PN |
| Browns Lane | NG12 5BL NG12 5BN |
| Chapel Side | NG12 5PL |
| Chapel Yard | NG12 5NJ |
| Church Hill | NG12 5ND |
| Church Lane | NG12 5NE NG12 5NQ NG12 5PW |
| Clipston Lane | NG12 5NW |
| Costock Road | NG12 5QT |
| Cotgrave Road | NG12 5NY |
| Fellows Yard | NG12 5NS |
| Field Lane | NG12 5QD |
| Golf Course Road | NG12 5BH |
| Keyworth Road | NG12 5QQ NG12 5SA |
| Laming Gap Lane | NG12 5PG |
| Laurel Close | NG12 5QP |
| Main Street | NG12 5PY NG12 5QS |
| Manor House Drive | NG12 5QN |
| Melton Road | NG12 5BP NG12 5BQ NG12 5PH NG12 5PJ NG12 5QJ |
| New Row | NG12 5NB |
| Old Hall Drive | NG12 5PZ |
| Old Melton Road | NG12 5NH NG12 5NL NG12 5NN NG12 5QH NG12 5QL |
| Pinfold Lane | NG12 5EZ |
| Saddlers Yard | NG12 5NT |
| Stanton Lane | NG12 5BD NG12 5BE NG12 5BG NG12 5BJ |
| Station Road | NG12 5NA |
| The Leys | NG12 5NU |
| The Poplars | NG12 5RH |
| Thorpe-in-the-glebe | NG12 5QX |
| Thurlby Lane | NG12 5BS |
| Town End Cottages | NG12 5LZ |
| Tuckwood Court | NG12 5PP |
| Widmerpool Lane | NG12 5BA |
| Widmerpool Park | NG12 5SB |
| Widmerpool Road | NG12 5QW |
| Wymeswold Road | NG12 5QU |
| Wysall Lane | NG12 5PT |
Transport near Wolds
-
Radcliffe (Nottinghamshire) Station
-
Nottingham Station
-
Netherfield Station
-
Beeston Station
-
Carlton Station
-
Attenborough Station
-
East Midlands Parkway Station
-
Loughborough Station
-
Bingham Station
-
Burton Joyce Station
- FAQ
- Price Paid By Year
- Property Type Price
Frequently asked questions about Wolds
What is the average price for a property for sale in Wolds?
The average price for a property for sale in Wolds is £676,852. This amount is 140% higher than the average price in Nottingham. There are 1,063 property listings for sale in Wolds.
What streets have the most expensive properties for sale in Wolds?
The streets with the most expensive properties for sale in Wolds are Stanton Lane at an average of £1,264,158, Church Hill at an average of £1,085,000 and The Leys at an average of £825,000.
What streets have the most affordable properties for sale in Wolds?
The streets with the most affordable properties for sale in Wolds are Wymeswold Road at an average of £320,000, New Row at an average of £323,510 and Manor House Drive at an average of £370,000.
Which train stations are available in or near Wolds?
Some of the train stations available in or near Wolds are Radcliffe (Nottinghamshire), Nottingham and Netherfield.
Property Price Paid in Wolds by Year
The average sold property price by year was:
| Year | Average Sold Price | Price Change |
Sold Properties
|
|---|---|---|---|
| 2025 | £552,833 | -11% |
18 Properties |
| 2024 | £614,050 | -39% |
20 Properties |
| 2023 | £851,272 | -12% |
20 Properties |
| 2022 | £952,583 | 36% |
12 Properties |
| 2021 | £608,313 | 10% |
43 Properties |
| 2020 | £546,200 | 6% |
29 Properties |
| 2019 | £514,936 | 5% |
24 Properties |
| 2018 | £488,608 | -7% |
23 Properties |
| 2017 | £524,568 | 12% |
22 Properties |
| 2016 | £459,026 | 13% |
19 Properties |
| 2015 | £401,255 | -12% |
28 Properties |
| 2014 | £450,558 | 26% |
24 Properties |
| 2013 | £334,872 | -17% |
18 Properties |
| 2012 | £392,810 | 0,4% |
24 Properties |
| 2011 | £391,202 | 2% |
24 Properties |
| 2010 | £384,858 | 1% |
25 Properties |
| 2009 | £381,645 | -2% |
20 Properties |
| 2008 | £390,859 | -5% |
11 Properties |
| 2007 | £409,770 | 2% |
32 Properties |
| 2006 | £401,282 | -4% |
37 Properties |
| 2005 | £415,508 | -10% |
24 Properties |
| 2004 | £458,086 | 5% |
25 Properties |
| 2003 | £435,776 | 42% |
28 Properties |
| 2002 | £251,910 | -5% |
38 Properties |
| 2001 | £264,982 | 9% |
26 Properties |
| 2000 | £240,816 | 33% |
27 Properties |
| 1999 | £161,968 | -12% |
41 Properties |
| 1998 | £180,670 | 21% |
31 Properties |
| 1997 | £142,563 | 4% |
30 Properties |
| 1996 | £137,437 | 5% |
16 Properties |
| 1995 | £130,053 | - |
14 Properties |
Property Price per Property Type in Wolds
Here you can find historic sold price data in order to help with your property search.
The average Property Paid Price for specific property types in the last three years are:
| Property Type | Average Sold Price | Sold Properties |
|---|---|---|
| Semi Detached House | £398,055.00 | 9 Semi Detached Houses |
| Detached House | £785,022.00 | 42 Detached Houses |
| Terraced House | £386,285.00 | 7 Terraced Houses |

