
Houses for sale & to rent in NG9 7BA, St James Street, Stapleford South West, Nottingham
House Prices in NG9 7BA, St James Street, Stapleford South West
Properties in NG9 7BA have no sales history available within the last 3 years. NG9 7BA is a postcode in St James Street located in Stapleford South West, an area in Nottingham, Nottinghamshire, with 2 households².
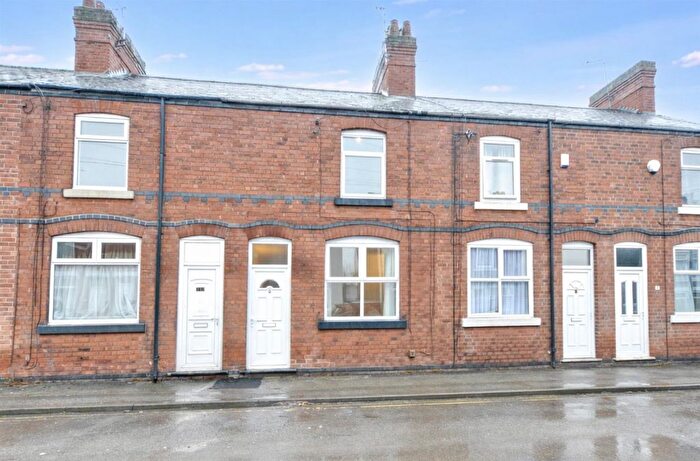
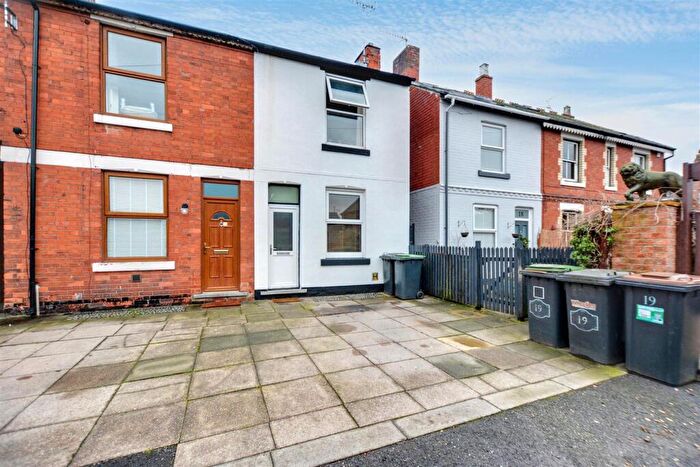
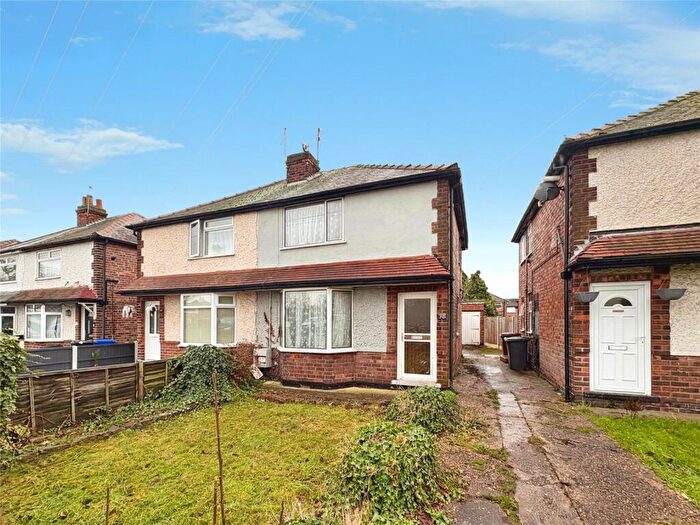
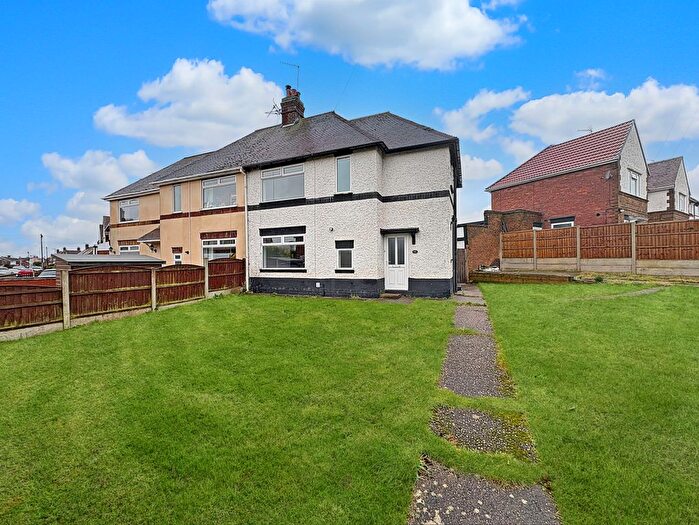
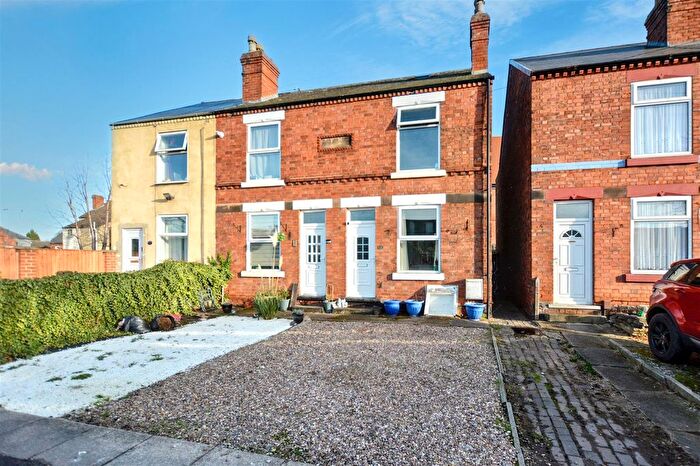
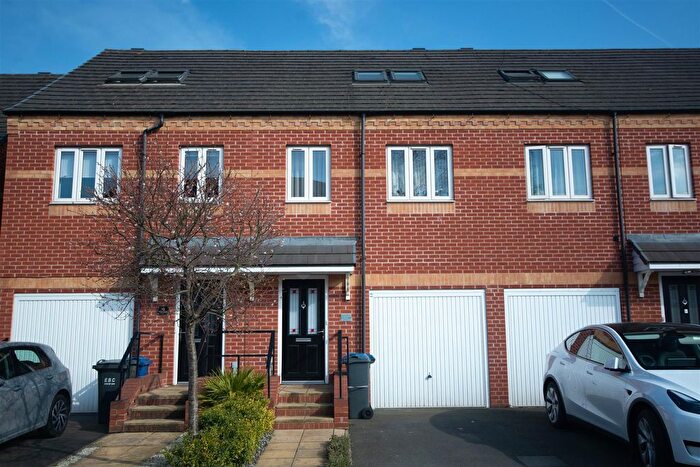
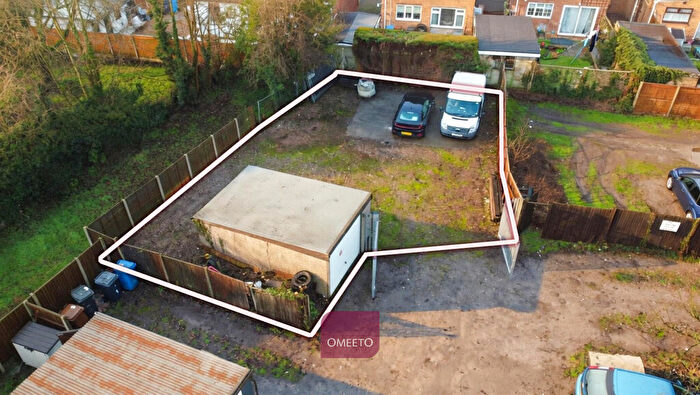
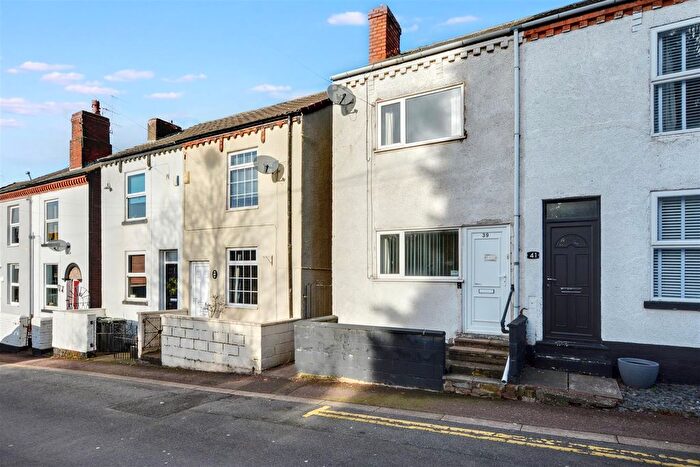
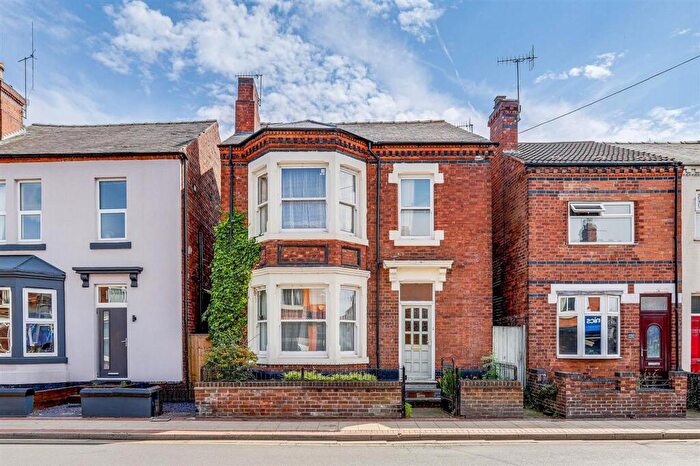
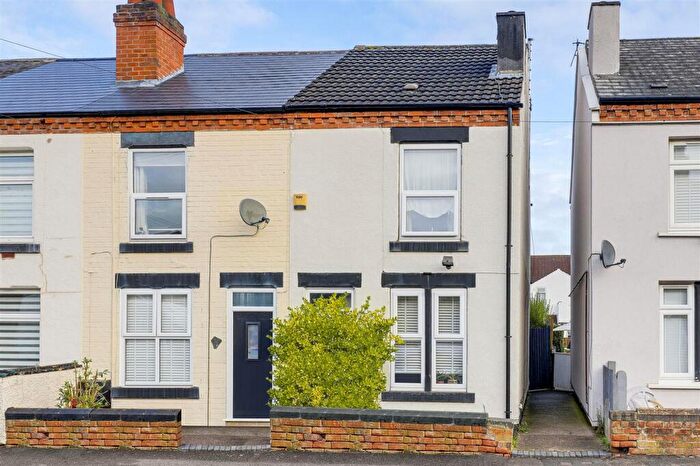
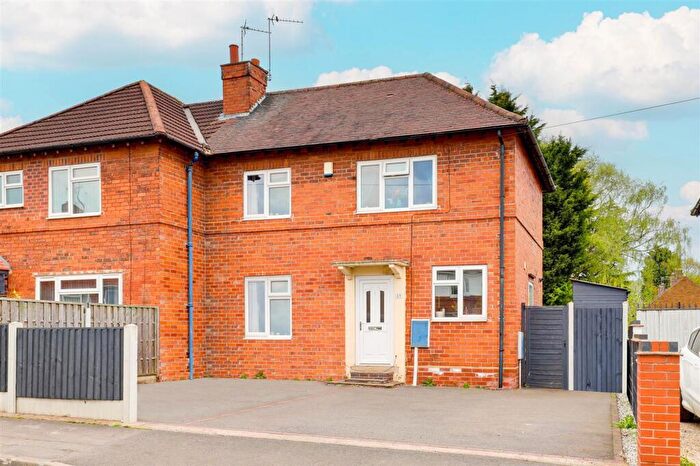
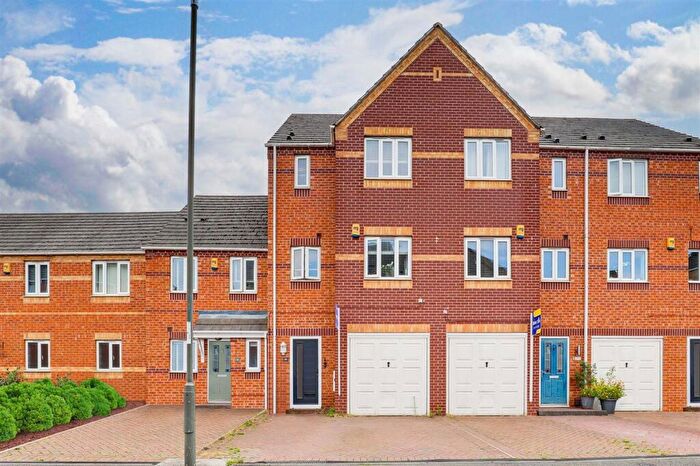
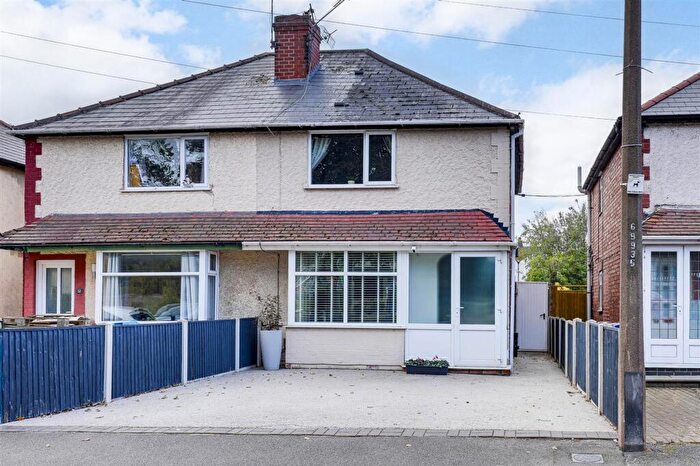
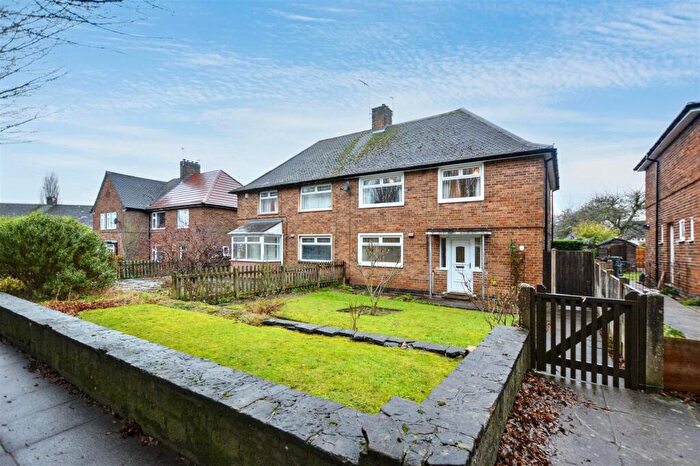
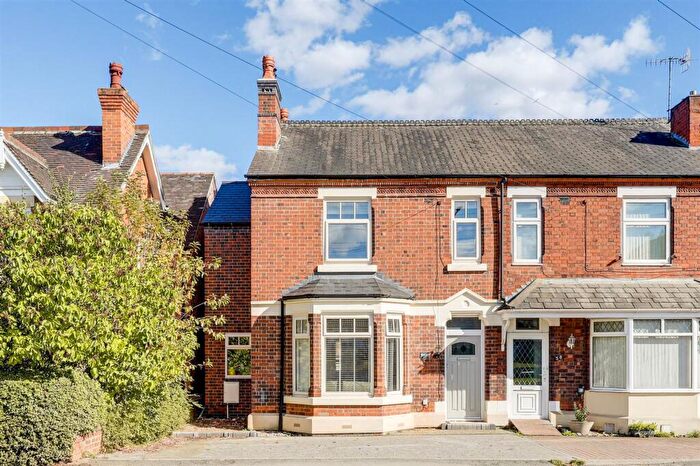
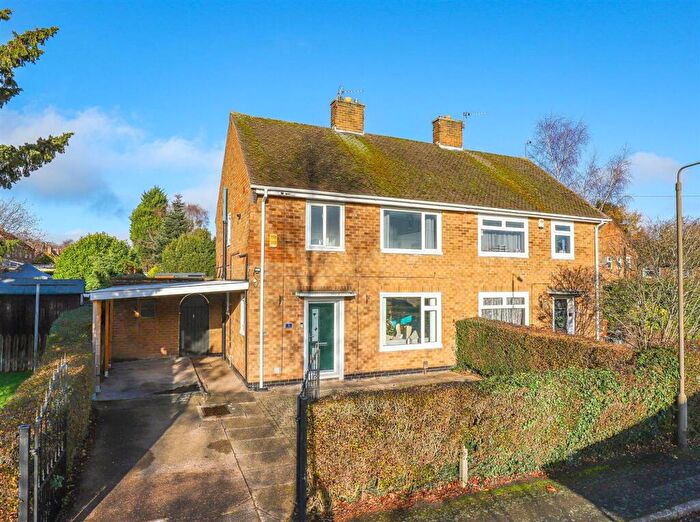
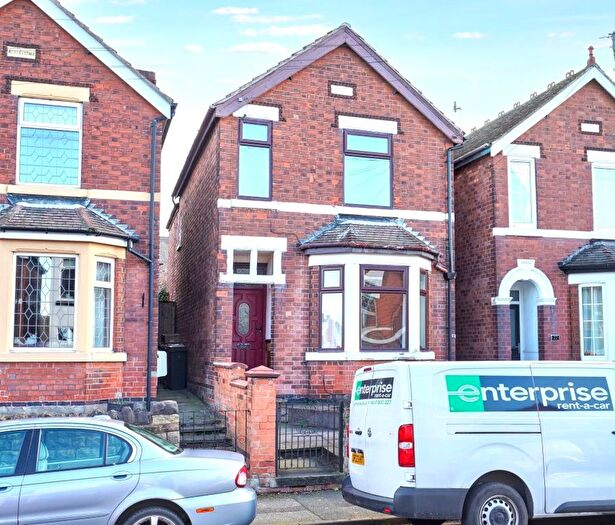
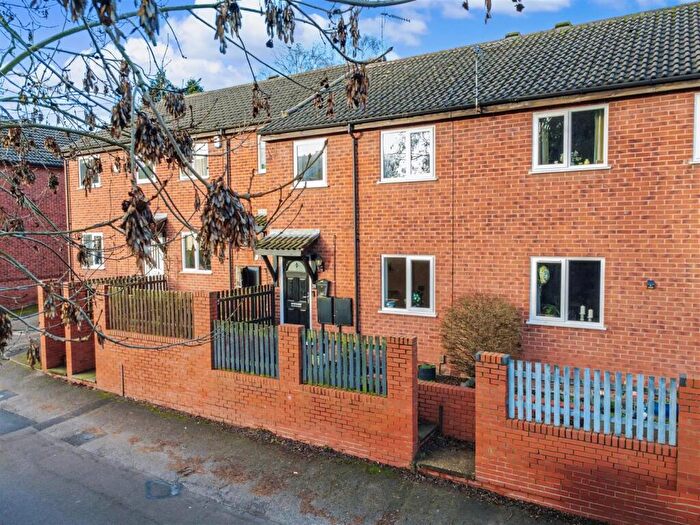
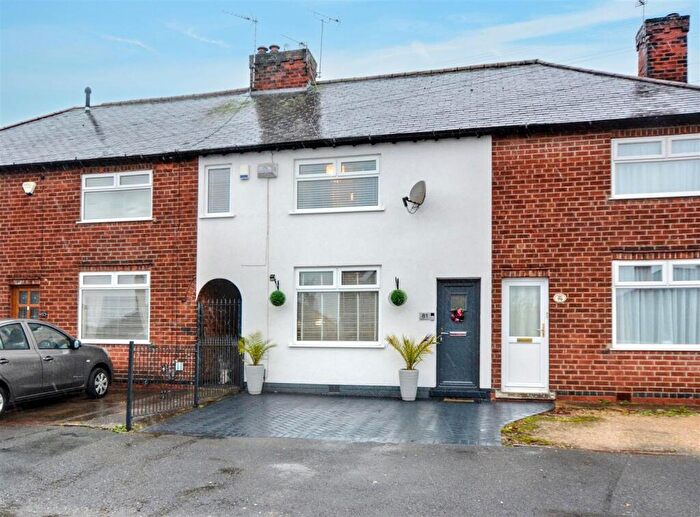
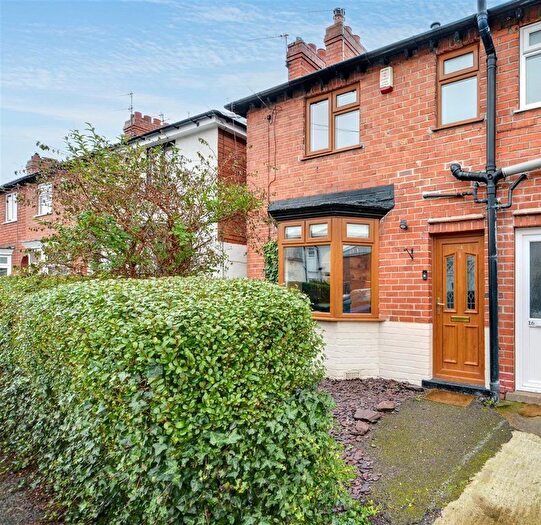
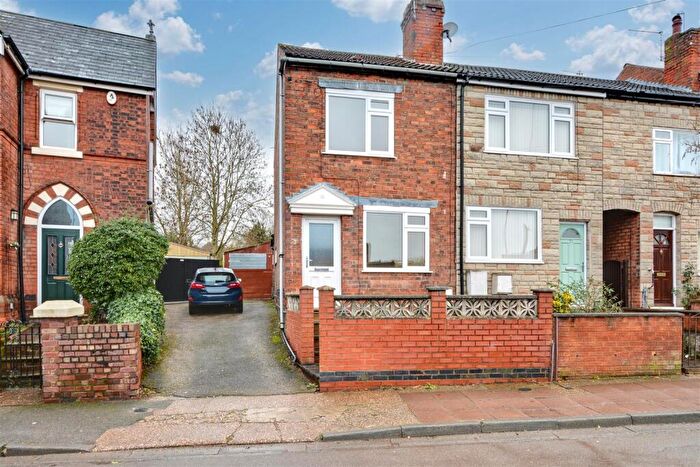
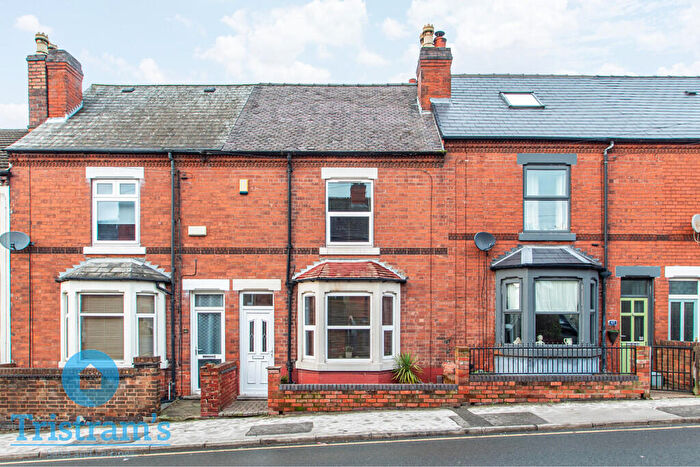
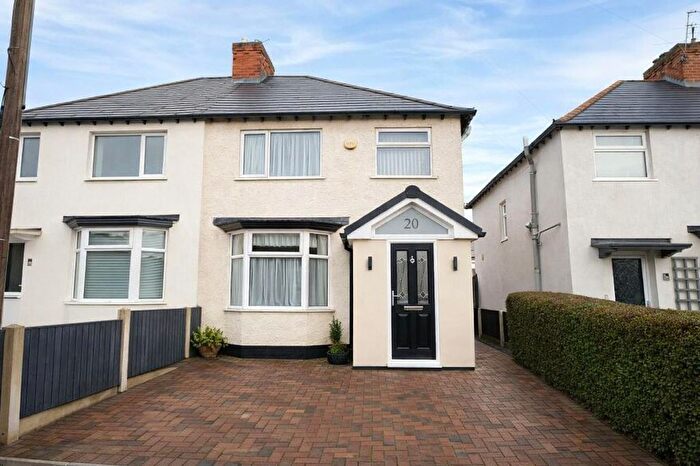
Properties for sale near NG9 7BA, St James Street

![]()
If you are looking to sell your house, let it out, or receive a property valuation, an expert can help you.
Click the button below to get started.
Price Paid in St James Street, NG9 7BA, Stapleford South West
1 St James Street, NG9 7BA, Stapleford South West Nottingham
Property 1 has been sold 3 times. The last time it was sold was in 01/12/2021 and the sold price was £165,000.00.
This detached house, sold as a freehold on 01/12/2021, is a 98 sqm detached house with an EPC rating of D.
| Date | Price | Property Type | Tenure | Classification |
|---|---|---|---|---|
| 01/12/2021 | £165,000.00 | Detached House | freehold | Established Building |
| 09/10/1998 | £40,000.00 | Detached House | freehold | Established Building |
| 14/06/1996 | £35,000.00 | Detached House | freehold | Established Building |
2 St James Street, NG9 7BA, Stapleford South West Nottingham
Property 2 has been sold 3 times. The last time it was sold was in 30/08/2019 and the sold price was £205,000.00.
This detached house, sold as a freehold on 30/08/2019, is a 112 sqm detached house with an EPC rating of F.
| Date | Price | Property Type | Tenure | Classification |
|---|---|---|---|---|
| 30/08/2019 | £205,000.00 | Detached House | freehold | Established Building |
| 14/09/2018 | £178,000.00 | Detached House | freehold | Established Building |
| 13/12/2013 | £137,500.00 | Detached House | freehold | Established Building |
Transport near NG9 7BA, St James Street
-
 Attenborough Station
 -
Long Eaton Station
-
Beeston Station
-
Ilkeston Station
-
East Midlands Parkway Station
House price paid reports for NG9 7BA, St James Street
Click on the buttons below to see price paid reports by year or property price:
- Price Paid By Year
Property Price Paid in NG9 7BA, St James Street by Year
The average sold property price by year was:
| Year | Average Sold Price | Price Change |
Sold Properties
|
|---|---|---|---|
| 2021 | £165,000 | -24% |
1 Property |
| 2019 | £205,000 | 13% |
1 Property |
| 2018 | £178,000 | 23% |
1 Property |
| 2013 | £137,500 | 71% |
1 Property |
| 1998 | £40,000 | 13% |
1 Property |
| 1996 | £35,000 | - |
1 Property |