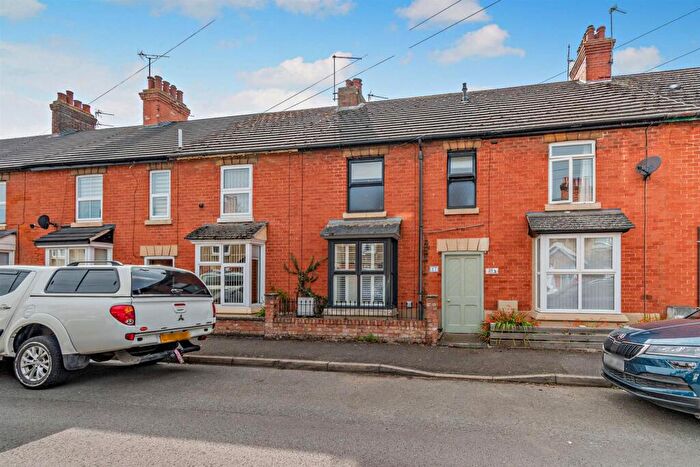
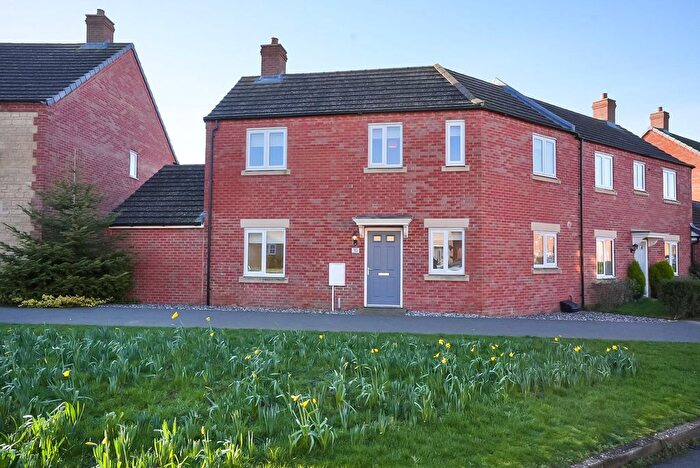
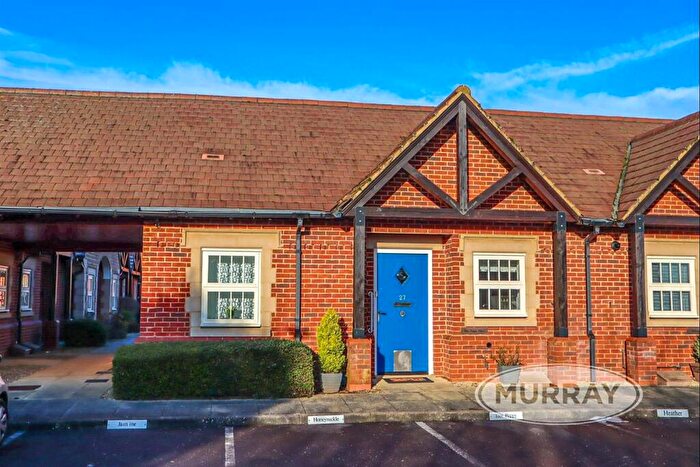
Houses for sale & to rent in Exton, Oakham
House Prices in Exton
Properties in Exton have an average house price of £802,967.00 and had 49 Property Transactions within the last 3 years¹.
Exton is an area in Oakham, Rutland with 599 households², where the most expensive property was sold for £2,500,000.00.
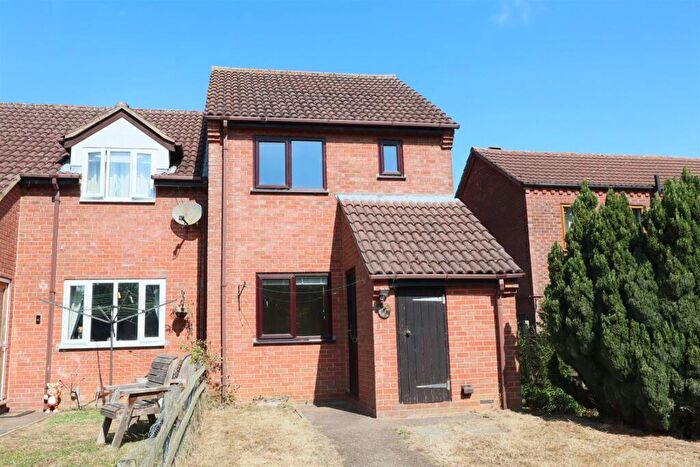
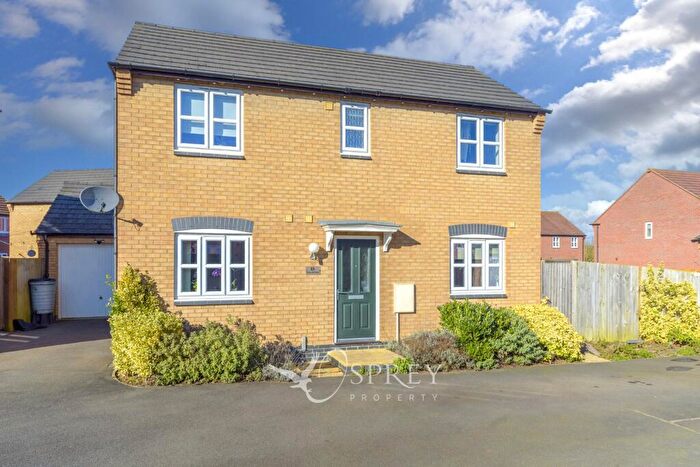
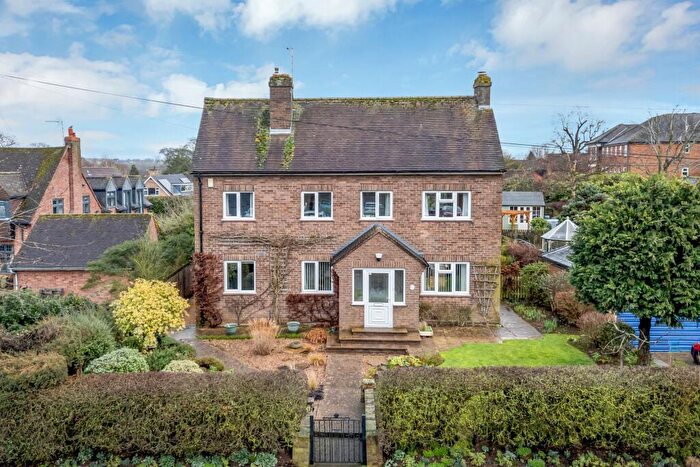
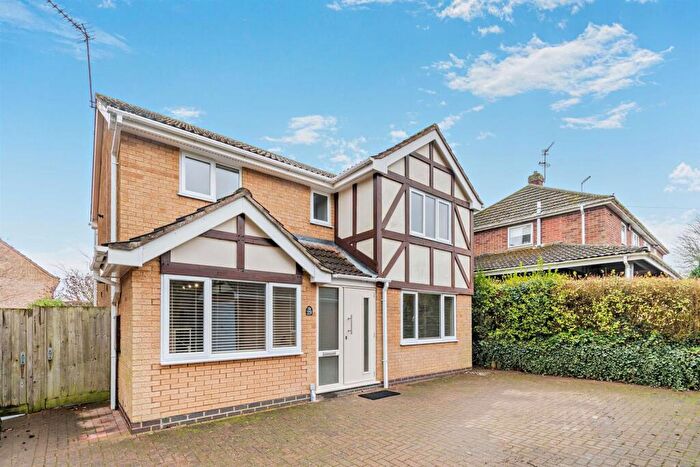
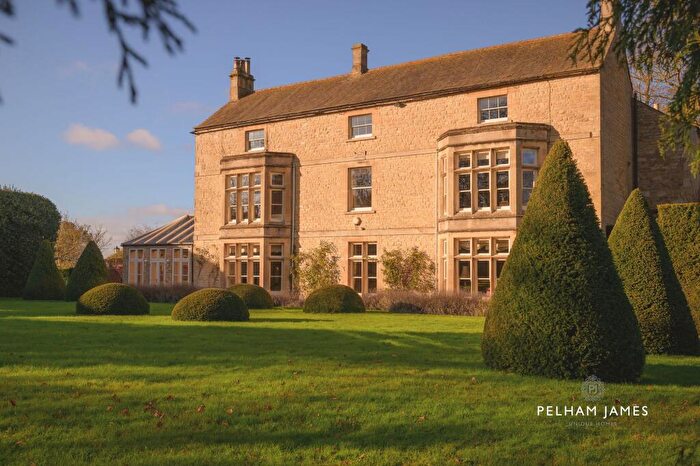
Properties for sale in Exton
Roads and Postcodes in Exton
Navigate through our locations to find the location of your next house in Exton, Oakham for sale or to rent.
| Streets | Postcodes |
|---|---|
| Ashwell Hall Lane | LE15 7SR |
| Ashwell Hall Stables | LE15 7LH |
| Barnsdale Avenue | LE15 8AH |
| Blacksmiths Lane | LE15 8AJ |
| Brookdene | LE15 7LQ |
| Bull Brigg Lane | LE15 8BL |
| Burley Crescent | LE15 7LG |
| Campden Close | LE15 8AL |
| Church Close | LE15 7LP |
| Church Farm Close | LE15 8BZ |
| Church Lane | LE15 8BJ |
| Church Road | LE15 7SU LE15 8AD |
| Cottesmore Road | LE15 7LJ LE15 7SX LE15 7AB LE15 7SY LE15 8AN |
| Cour D Honneur | LE15 7FH |
| Croft Lane | LE15 7LL |
| East Lodge Road | LE15 7FJ |
| Empingham Road | LE15 8AW |
| Exton Lane | LE15 7TA |
| Exton Road | LE15 8BN |
| Garden Road | LE15 8AY |
| Great North Road | LE15 7QU |
| Hambleton Road | LE15 8AE |
| Harrington Crescent | LE15 8AR |
| High Street | LE15 8AS |
| Home Farm Close | LE15 7ST |
| Ketton Road | LE15 8TH |
| Langham Road | LE15 7LN LE15 7TB |
| Lyndon Road | LE15 8BG LE15 8TJ LE15 8RN |
| Main Road | LE15 8BW |
| Main Street | LE15 8AF |
| Malting Yard | LE15 8AT |
| Meadow Way | LE15 8BP |
| New Field Road | LE15 8AU |
| New Row | LE15 7SZ |
| Oakham Enterprise Park | LE15 7TU LE15 7TY |
| Oakham Road | LE15 7LW LE15 8AX LE15 8TL |
| Old Dairy Yard | LE15 8BY |
| Old Station Yard | LE15 7SP |
| Old Wood Road | LE15 7FL |
| Orchard Close | LE15 8AG |
| Pudding Bag Lane | LE15 8BH |
| Stamford End | LE15 8BQ |
| Stamford Road | LE15 8AB LE15 8AZ |
| Swallows Dene | LE15 7PZ |
| Teigh Road | LE15 7LR |
| The Brooks | LE15 8BS |
| The Green | LE15 8AP |
| Tickencote Road | LE15 8BA |
| Top Street | LE15 8BB |
| Upper Brooks | LE15 8GA |
| Water Lane | LE15 7LS |
| West End | LE15 8BD |
| West Road | LE15 7FP |
| Whissendine Road | LE15 7LT LE15 7LU |
| Wilderness Road | LE15 7FQ |
| Woodside | LE15 7LX |
| LE15 8BT |
Transport near Exton
- FAQ
- Price Paid By Year
- Property Type Price
Frequently asked questions about Exton
What is the average price for a property for sale in Exton?
The average price for a property for sale in Exton is £802,967. This amount is 95% higher than the average price in Oakham. There are 1,624 property listings for sale in Exton.
What streets have the most expensive properties for sale in Exton?
The streets with the most expensive properties for sale in Exton are Home Farm Close at an average of £1,787,500, Cottesmore Road at an average of £1,600,000 and Ketton Road at an average of £1,600,000.
What streets have the most affordable properties for sale in Exton?
The streets with the most affordable properties for sale in Exton are Burley Crescent at an average of £205,000, Empingham Road at an average of £276,500 and Langham Road at an average of £280,000.
Which train stations are available in or near Exton?
Some of the train stations available in or near Exton are Oakham, Stamford and Melton Mowbray.
Property Price Paid in Exton by Year
The average sold property price by year was:
| Year | Average Sold Price | Price Change |
Sold Properties
|
|---|---|---|---|
| 2025 | £779,464 | -3% |
14 Properties |
| 2024 | £800,066 | -4% |
21 Properties |
| 2023 | £830,821 | 25% |
14 Properties |
| 2022 | £624,508 | -4% |
23 Properties |
| 2021 | £646,421 | -24% |
26 Properties |
| 2020 | £801,346 | 42% |
13 Properties |
| 2019 | £466,028 | -28% |
16 Properties |
| 2018 | £595,733 | 29% |
15 Properties |
| 2017 | £422,928 | -48% |
14 Properties |
| 2016 | £625,739 | 19% |
23 Properties |
| 2015 | £503,823 | -18% |
17 Properties |
| 2014 | £594,003 | 30% |
26 Properties |
| 2013 | £413,289 | 21% |
24 Properties |
| 2012 | £328,339 | -5% |
14 Properties |
| 2011 | £344,333 | -44% |
12 Properties |
| 2010 | £494,870 | 29% |
20 Properties |
| 2009 | £350,696 | -32% |
14 Properties |
| 2008 | £462,000 | -4% |
13 Properties |
| 2007 | £480,617 | 35% |
35 Properties |
| 2006 | £314,070 | -7% |
24 Properties |
| 2005 | £336,471 | 17% |
19 Properties |
| 2004 | £278,286 | -13% |
19 Properties |
| 2003 | £315,619 | 1% |
17 Properties |
| 2002 | £312,496 | 44% |
30 Properties |
| 2001 | £176,493 | -57% |
22 Properties |
| 2000 | £277,089 | 38% |
30 Properties |
| 1999 | £172,116 | -3% |
32 Properties |
| 1998 | £178,056 | 19% |
24 Properties |
| 1997 | £143,984 | 17% |
33 Properties |
| 1996 | £119,605 | -52% |
25 Properties |
| 1995 | £181,441 | - |
17 Properties |
Property Price per Property Type in Exton
Here you can find historic sold price data in order to help with your property search.
The average Property Paid Price for specific property types in the last three years are:
| Property Type | Average Sold Price | Sold Properties |
|---|---|---|
| Semi Detached House | £306,055.00 | 9 Semi Detached Houses |
| Detached House | £935,075.00 | 32 Detached Houses |
| Terraced House | £849,785.00 | 7 Terraced Houses |
| Flat | £720,000.00 | 1 Flat |

