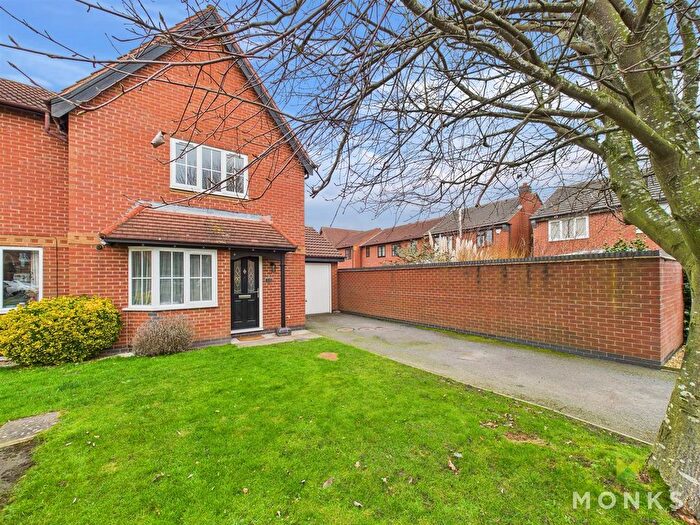
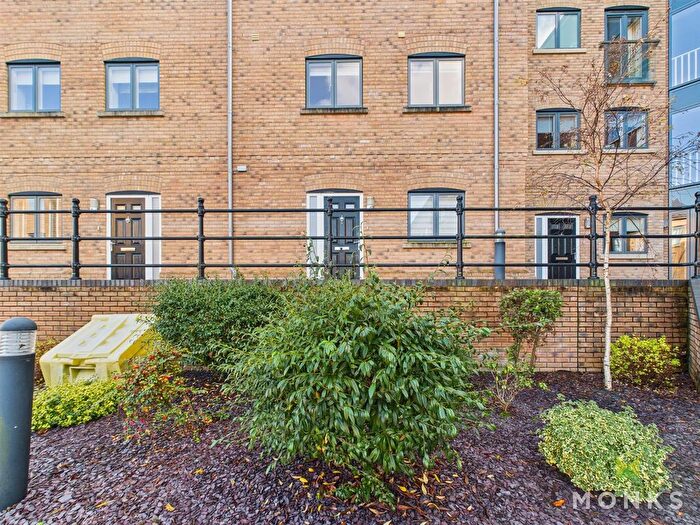
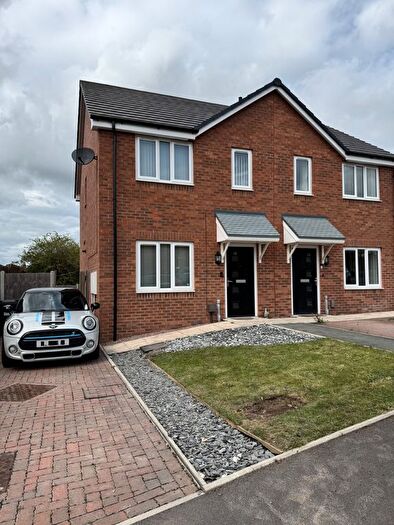
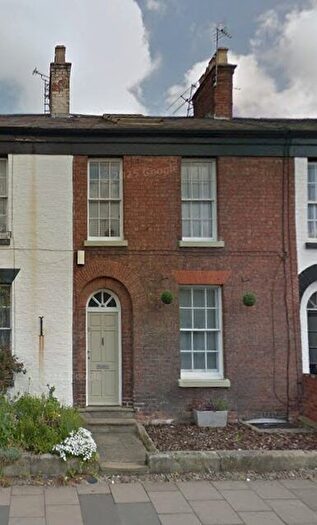
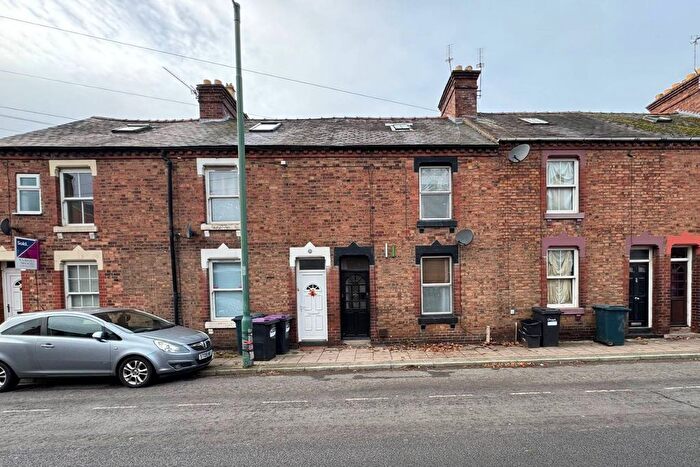
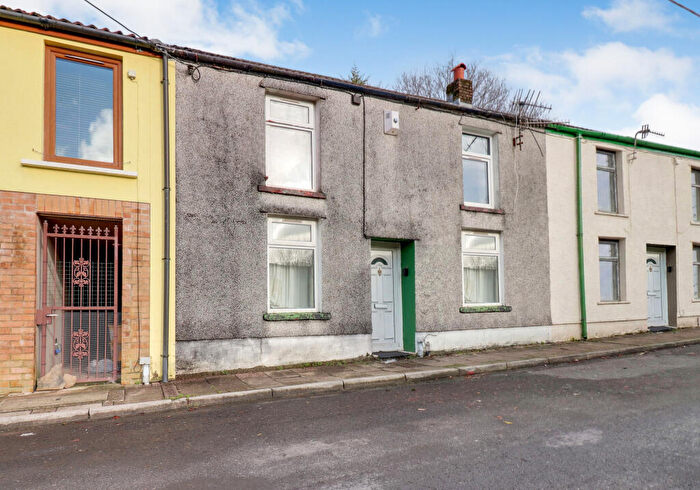
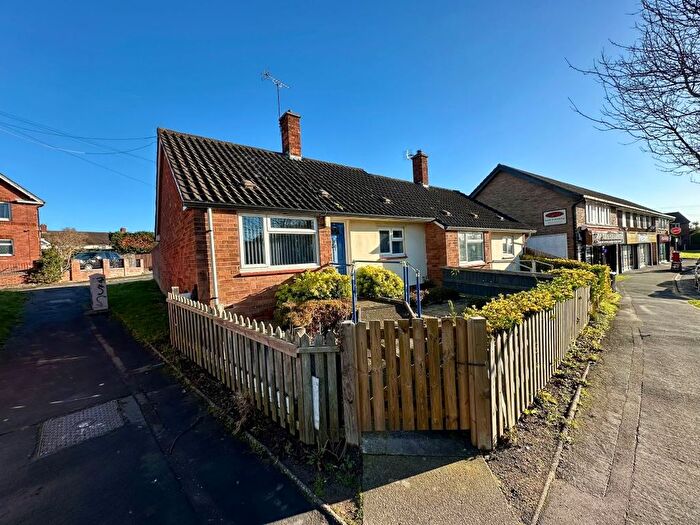
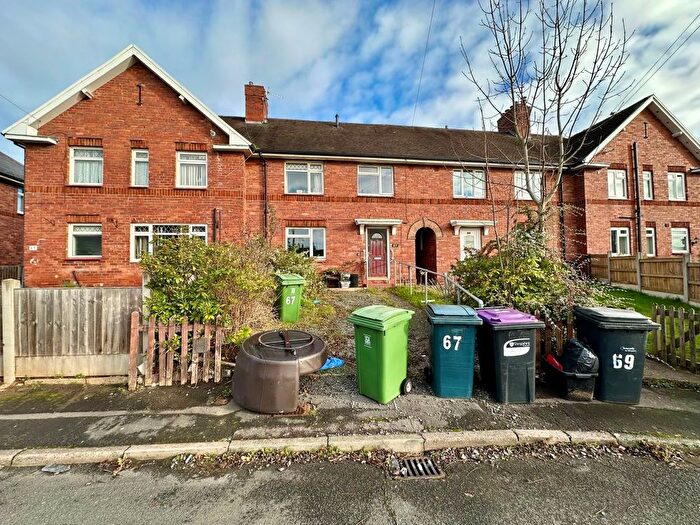
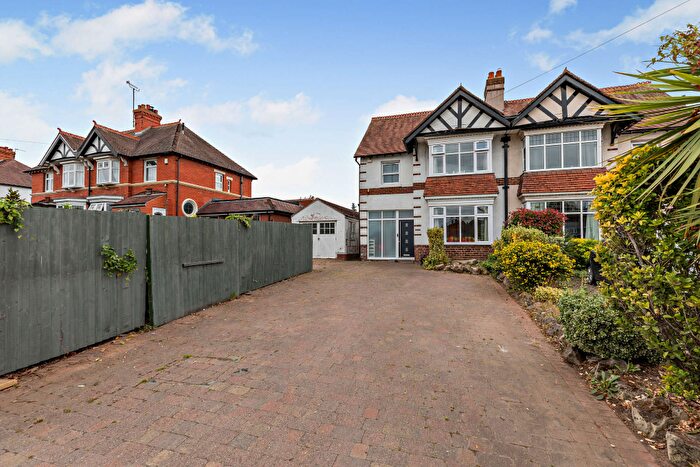
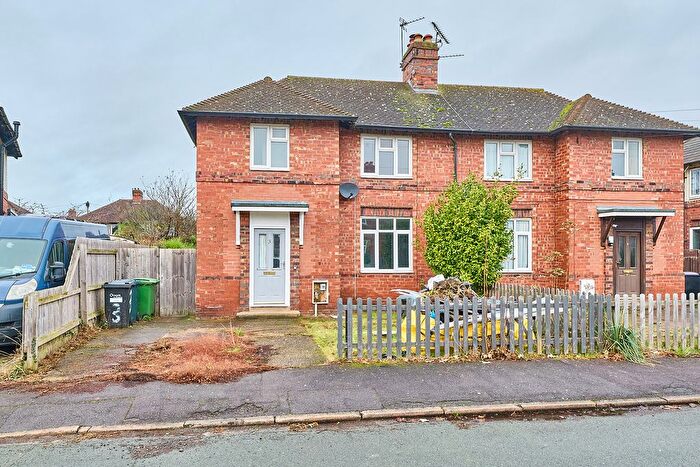
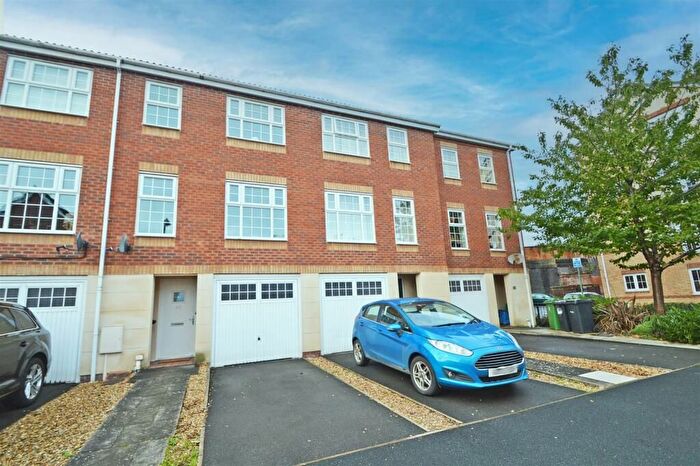
Houses for sale & to rent in Castlefields And Ditherington, Shrewsbury
House Prices in Castlefields And Ditherington
Properties in Castlefields And Ditherington have an average house price of £214,261.00 and had 197 Property Transactions within the last 3 years¹.
Castlefields And Ditherington is an area in Shrewsbury, Shropshire with 2,104 households², where the most expensive property was sold for £775,000.00.
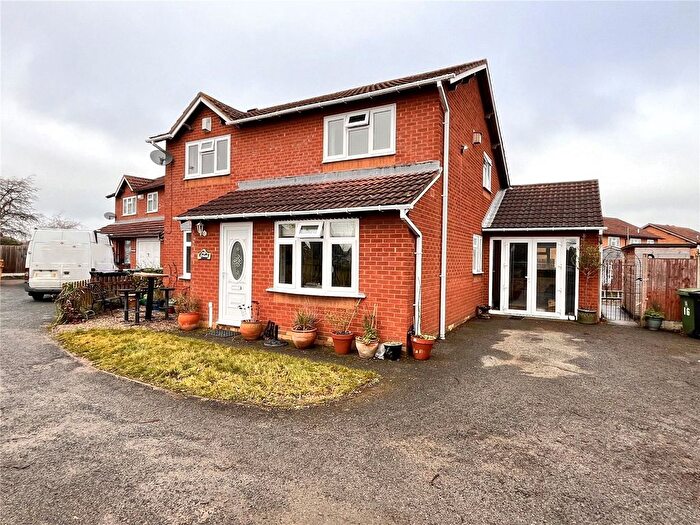
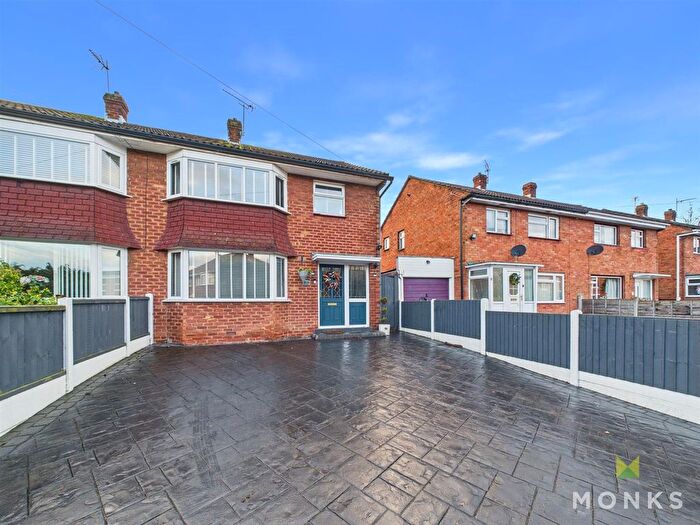
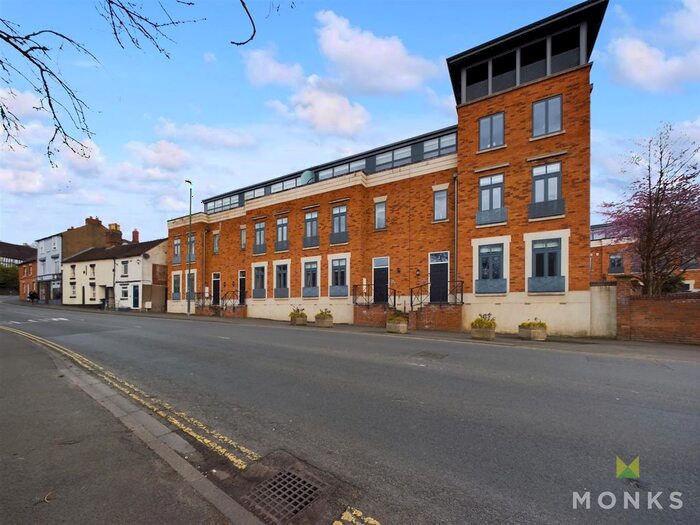
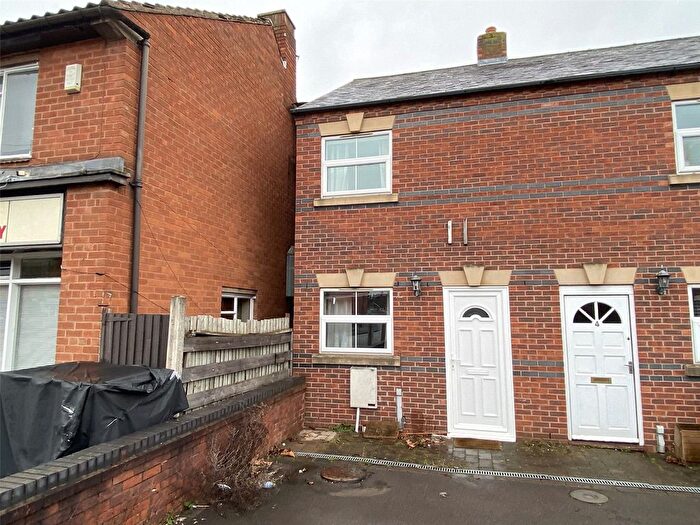
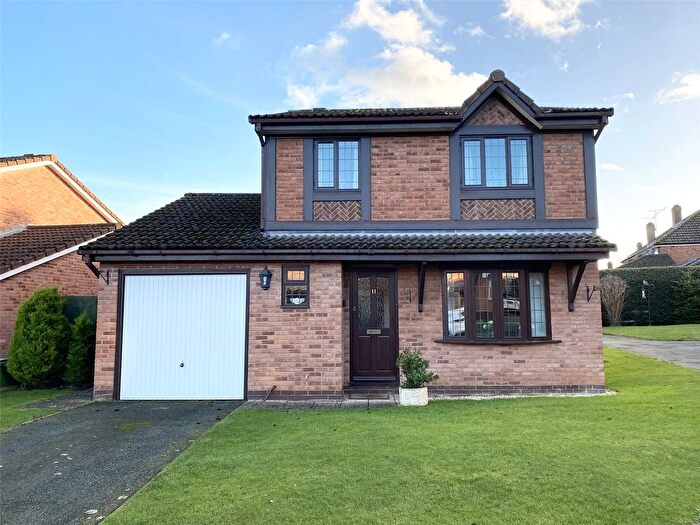
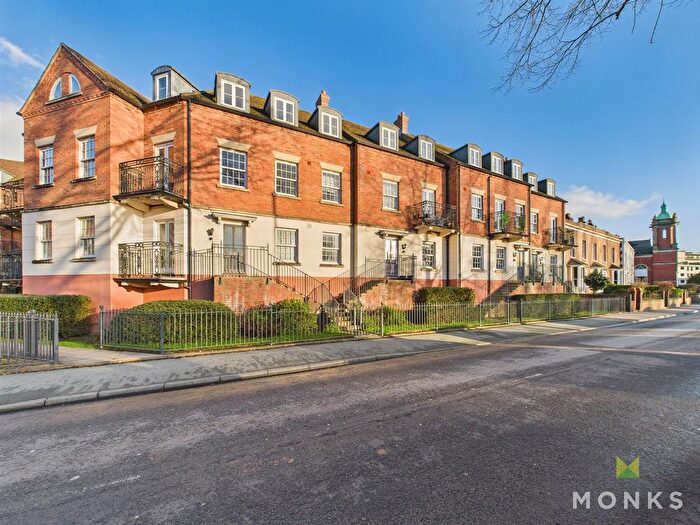
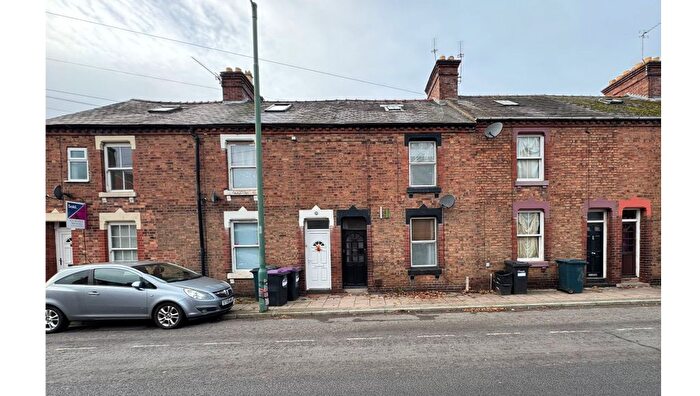
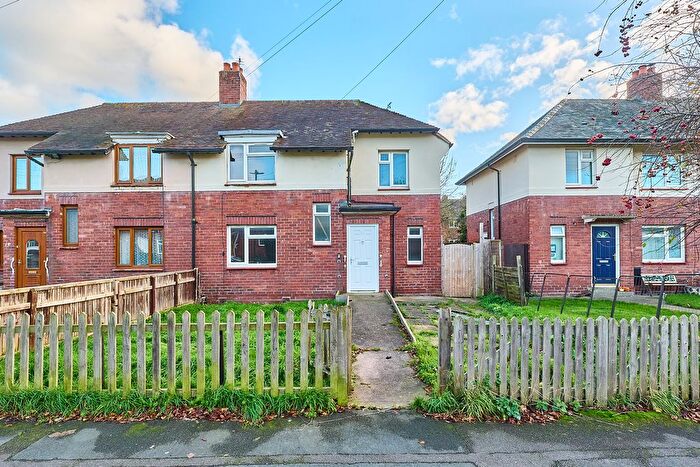
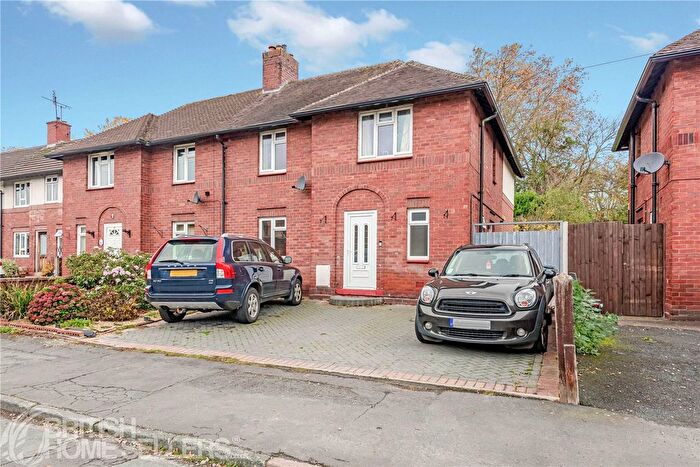
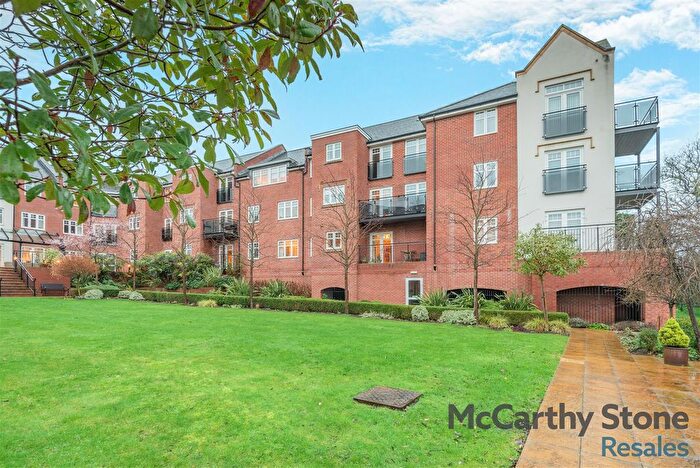
Properties for sale in Castlefields And Ditherington
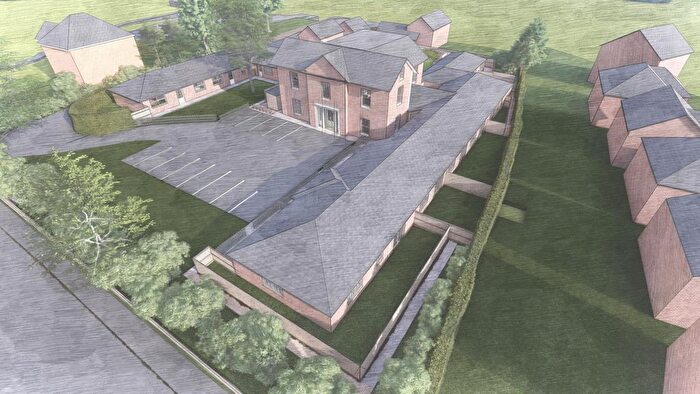
Previously listed properties in Castlefields And Ditherington
Roads and Postcodes in Castlefields And Ditherington
Navigate through our locations to find the location of your next house in Castlefields And Ditherington, Shrewsbury for sale or to rent.
| Streets | Postcodes |
|---|---|
| Albafont Terrace | SY1 2HY |
| Albert Street | SY1 2HT |
| All Saints Terrace | SY1 2LG |
| Argyll Street | SY1 2SF |
| Avondale Drive | SY1 2TZ SY1 2UA |
| Barton Close | SY1 2UQ |
| Beacalls Lane | SY1 2HU SY1 2FA |
| Beaumont Terrace | SY1 2SD |
| Benyon Street | SY1 2JQ |
| Bramley Close | SY1 2TP |
| Bulls Row | SY1 4BZ |
| Burton Street | SY1 2JW |
| Cadran Place | SY1 2HZ |
| Comet Drive | SY1 4AX SY1 4AY SY1 4AZ |
| Darville | SY1 2UG |
| Didcot Close | SY1 2UH |
| Ditherington Road | SY1 4AS SY1 4AT SY1 4AU SY1 4BD SY1 4BE SY1 4BG |
| Dorset Street | SY1 2JB |
| Far Garden Place | SY1 2TJ |
| Felton Close | SY1 2TX |
| Hallcroft Court | SY1 2AF |
| Hampton Road | SY1 2TY |
| Heathgates | SY1 4BA |
| Holyoake Close | SY1 4DH |
| John Street | SY1 2RZ SY1 2SB |
| Laburnum Grove | SY1 2UT |
| Lindley Street | SY1 2JZ |
| Lingen Close | SY1 2UN |
| Long Row | SY1 4DD SY1 4DE SY1 4DF SY1 4DJ |
| Millers Green | SY1 2UB |
| Milton Close | SY1 2UE |
| Morgans Cottages | SY1 4DG |
| Mount Pleasant Road | SY1 3BD SY1 3BH |
| New Park Close | SY1 2SG SY1 2SQ |
| New Park Road | SY1 2RS SY1 2RU SY1 2SE SY1 2SH SY1 2SP SY1 2SW SY1 2RT |
| New Park Street | SY1 2JY SY1 2LA SY1 2LD SY1 2LE |
| Newent Close | SY1 2UJ |
| Newfield Drive | SY1 2SJ SY1 2SL SY1 2SN |
| North Street | SY1 2JF SY1 2JG SY1 2JH SY1 2JJ SY1 2JL |
| Osborne Close | SY1 2SU |
| Poplar Close | SY1 2UU |
| Pretoria Terrace | SY1 2SA |
| Queen Street | SY1 2JP SY1 2JR SY1 2JT SY1 2JU SY1 2JX SY1 2JS |
| Regents Drive | SY1 2TN |
| Sandford Avenue | SY1 3BE |
| Sandford Close | SY1 3BG |
| Severn Bank | SY1 2JD |
| Severn Street | SY1 2JA |
| Spring Gardens | SY1 2ST SY1 2TA SY1 2TD SY1 2TE SY1 2SZ SY1 2TF |
| Spruce Drive | SY1 2UX |
| Sultan Road | SY1 2SR SY1 2SS |
| Tarvin Road | SY1 2TU |
| The Dana | SY1 2HP |
| Tilbrook Drive | SY1 2TR SY1 2TT SY1 2TW |
| Victoria Street | SY1 2HS |
| Victoria Terrace | SY1 2LB |
| Warrenby Close | SY1 2UL |
| Water Street | SY1 2JE |
| West Street | SY1 2JN |
| Whitehouse Gardens | SY1 4BU SY1 4BX SY1 4DB SY1 4BY |
| Wingfield Close | SY1 4BL SY1 4BP SY1 4BW SY1 4BH SY1 4BJ SY1 4BN |
| Wingfield Gardens | SY1 4BS SY1 4BT SY1 4BQ |
| Woodhall Close | SY1 2TS |
| Yew Tree Close | SY1 2UR SY1 2US |
Transport near Castlefields And Ditherington
- FAQ
- Price Paid By Year
- Property Type Price
Frequently asked questions about Castlefields And Ditherington
What is the average price for a property for sale in Castlefields And Ditherington?
The average price for a property for sale in Castlefields And Ditherington is £214,261. This amount is 31% lower than the average price in Shrewsbury. There are 173 property listings for sale in Castlefields And Ditherington.
What streets have the most expensive properties for sale in Castlefields And Ditherington?
The streets with the most expensive properties for sale in Castlefields And Ditherington are Severn Bank at an average of £775,000, Victoria Street at an average of £470,000 and Spruce Drive at an average of £335,000.
What streets have the most affordable properties for sale in Castlefields And Ditherington?
The streets with the most affordable properties for sale in Castlefields And Ditherington are Barton Close at an average of £84,000, Morgans Cottages at an average of £85,000 and Warrenby Close at an average of £100,833.
Which train stations are available in or near Castlefields And Ditherington?
Some of the train stations available in or near Castlefields And Ditherington are Shrewsbury, Yorton and Wellington.
Property Price Paid in Castlefields And Ditherington by Year
The average sold property price by year was:
| Year | Average Sold Price | Price Change |
Sold Properties
|
|---|---|---|---|
| 2025 | £221,853 | 1% |
75 Properties |
| 2024 | £219,000 | 8% |
53 Properties |
| 2023 | £202,369 | -3% |
69 Properties |
| 2022 | £208,156 | 4% |
82 Properties |
| 2021 | £200,450 | 7% |
81 Properties |
| 2020 | £185,620 | 14% |
76 Properties |
| 2019 | £159,155 | - |
66 Properties |
| 2018 | £159,173 | -2% |
91 Properties |
| 2017 | £161,592 | 7% |
83 Properties |
| 2016 | £149,531 | -3% |
75 Properties |
| 2015 | £153,712 | 2% |
95 Properties |
| 2014 | £151,274 | -0,1% |
99 Properties |
| 2013 | £151,367 | 10% |
107 Properties |
| 2012 | £136,415 | -9% |
86 Properties |
| 2011 | £148,607 | 5% |
70 Properties |
| 2010 | £140,972 | 11% |
63 Properties |
| 2009 | £125,347 | -8% |
44 Properties |
| 2008 | £135,234 | 4% |
36 Properties |
| 2007 | £129,153 | -2% |
82 Properties |
| 2006 | £131,455 | 5% |
106 Properties |
| 2005 | £125,321 | 7% |
90 Properties |
| 2004 | £116,444 | 20% |
76 Properties |
| 2003 | £93,660 | 18% |
82 Properties |
| 2002 | £76,800 | 12% |
119 Properties |
| 2001 | £67,292 | 22% |
105 Properties |
| 2000 | £52,774 | 5% |
88 Properties |
| 1999 | £49,907 | 1% |
104 Properties |
| 1998 | £49,532 | 9% |
102 Properties |
| 1997 | £45,067 | -1% |
99 Properties |
| 1996 | £45,639 | 2% |
79 Properties |
| 1995 | £44,867 | - |
99 Properties |
Property Price per Property Type in Castlefields And Ditherington
Here you can find historic sold price data in order to help with your property search.
The average Property Paid Price for specific property types in the last three years are:
| Property Type | Average Sold Price | Sold Properties |
|---|---|---|
| Semi Detached House | £213,565.00 | 61 Semi Detached Houses |
| Detached House | £295,200.00 | 20 Detached Houses |
| Terraced House | £219,249.00 | 98 Terraced Houses |
| Flat | £99,527.00 | 18 Flats |

