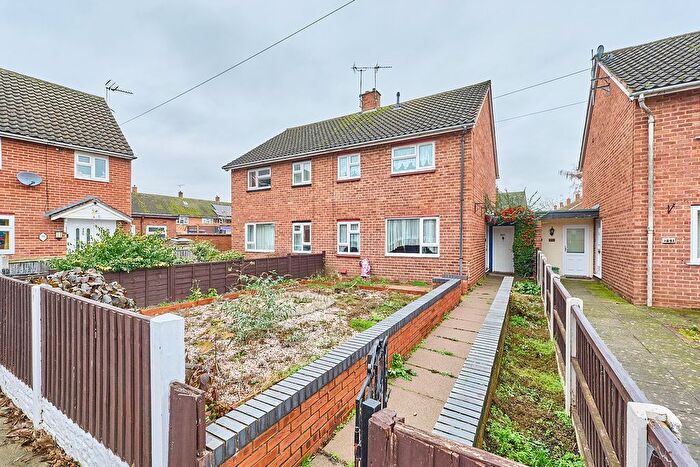
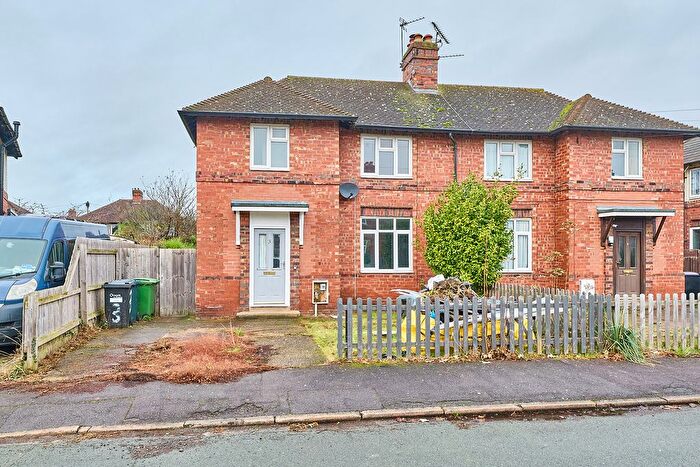
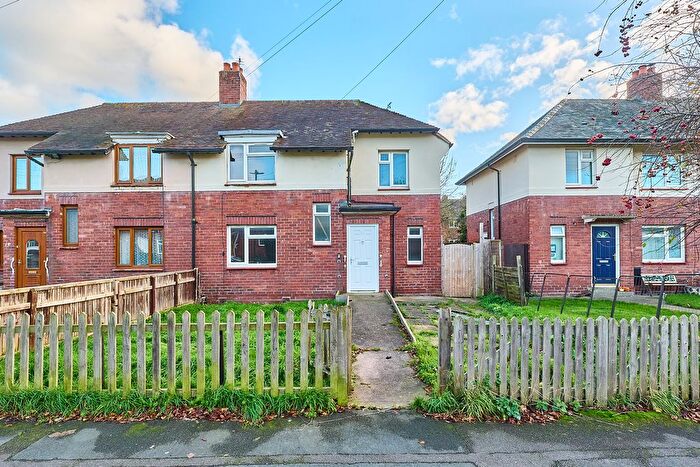
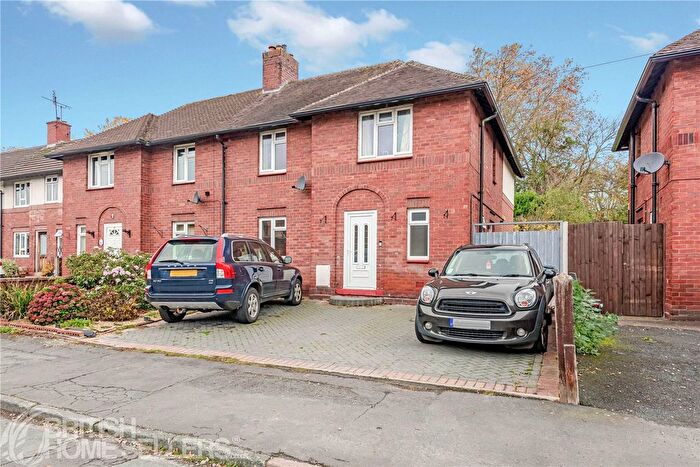
Houses for sale & to rent in Underdale, Shrewsbury
House Prices in Underdale
Properties in Underdale have an average house price of £278,970.00 and had 134 Property Transactions within the last 3 years¹.
Underdale is an area in Shrewsbury, Shropshire with 1,760 households², where the most expensive property was sold for £890,000.00.
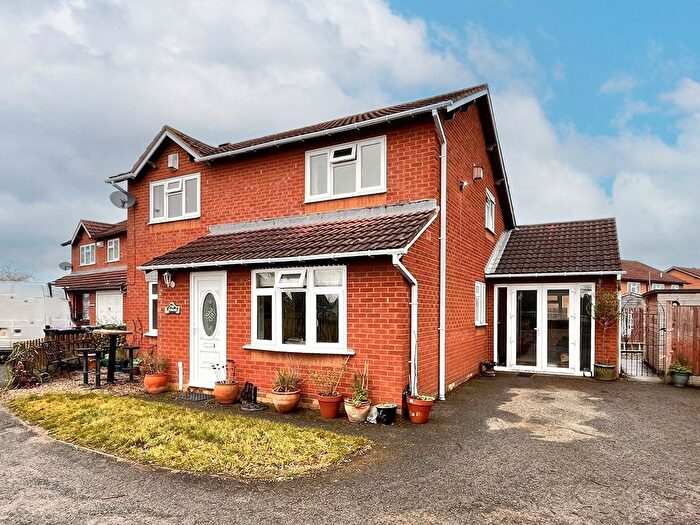
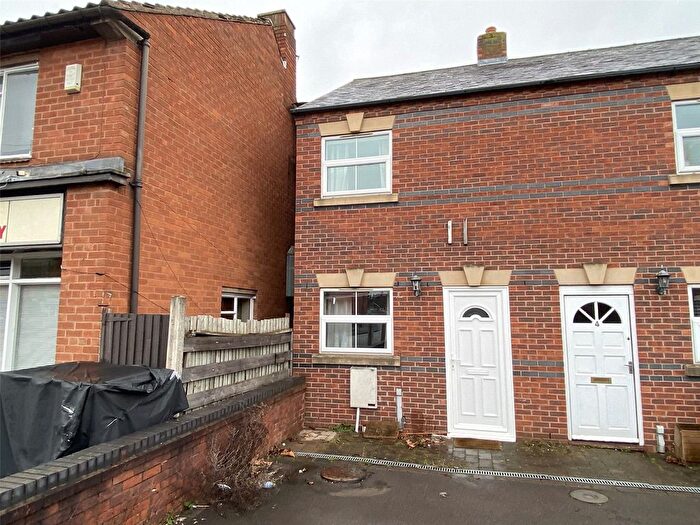
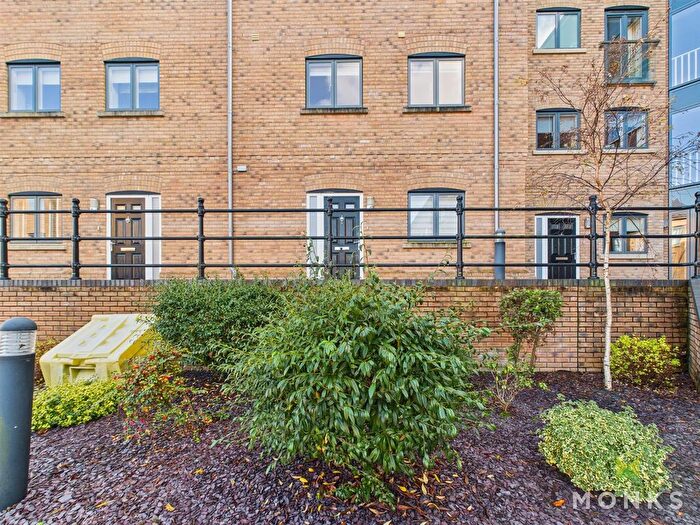
Properties for sale in Underdale
Previously listed properties in Underdale
Roads and Postcodes in Underdale
Navigate through our locations to find the location of your next house in Underdale, Shrewsbury for sale or to rent.
| Streets | Postcodes |
|---|---|
| Alvaston Way | SY2 5TT |
| Arden Close | SY2 5YP |
| Arthur Rowley Close | SY2 5TY |
| Ashley Street | SY2 5DU |
| Aston Butts | SY2 5SA |
| Bradford Street | SY2 5DP |
| Bridgeford Way | SY2 5XX |
| Brighton Terrace | SY2 5DS |
| Buttington Road | SY2 5TN SY2 5TP SY2 5TS |
| Cadfael Way | SY2 5GB |
| Cleveland Street | SY2 5DN |
| Colley Close | SY2 5YN |
| Corinthian Drive | SY2 5EQ |
| Corsten Drive | SY2 5TJ |
| Crowmere Green | SY2 5HU |
| Crowmere Road | SY2 5HS SY2 5HT SY2 5HX SY2 5HZ SY2 5JA |
| Curia Close | SY2 5HN |
| Dale Road | SY2 5TE |
| Drake Close | SY2 5HW |
| Dunwoody Court | SY2 5XS |
| Eden Close | SY2 5YW |
| Ellis Green | SY2 5HP |
| Glenburn Gardens | SY2 5SY |
| Gregson Close | SY2 5EJ |
| Harvey Gardens | SY2 5TG |
| Hearne Way | SY2 5SL |
| Judith Butts Gardens | SY2 5RT SY2 5RU SY2 5RY SY2 5SD SY2 5SE SY2 5RX SY2 5RZ |
| Judith Butts Lane | SY2 5BG |
| Loton Butts | SY2 5SB |
| Lowfield | SY2 5XT |
| May Terrace | SY2 5HY |
| Middletown Square | SY2 5TW |
| Millennium Gardens | SY2 5BZ |
| Monkmoor Avenue | SY2 5DZ SY2 5EB SY2 5ED |
| Monkmoor Crescent | SY2 5EA |
| Monkmoor Road | SY2 5AS SY2 5AT SY2 5AU SY2 5AX SY2 5AY SY2 5AZ SY2 5BA SY2 5BB SY2 5BD SY2 5BE SY2 5BL SY2 5BN SY2 5BQ SY2 5SN SY2 5SS SY2 5SW SY2 5TF SY2 5AR |
| Oswell Road | SY2 5YL |
| Racecourse Avenue | SY2 5BS SY2 5BU |
| Racecourse Crescent | SY2 5BP SY2 5BW |
| Racecourse Green | SY2 5BT |
| Redwing Fields | SY2 5SZ |
| Riverdale Road | SY2 5TA SY2 5TB SY2 5TD |
| Rushbrooke Way | SY2 5TQ |
| Rushton Road | SY2 5SF |
| Tankerville Street | SY2 5DJ |
| Telford Way | SY2 5XQ |
| The Chase | SY2 5BX |
| Trafalgar Place | SY2 5EH |
| Underdale Avenue | SY2 5DY |
| Underdale Court | SY2 5DD |
| Underdale Road | SY2 5DH SY2 5DL SY2 5DT SY2 5DW SY2 5DX SY2 5EE SY2 5EF SY2 5EG |
| Vennington Walk | SY2 5TR |
| Woodcote Way | SY2 5SG SY2 5SJ SY2 5SQ SY2 5SH |
| SY2 5XU |
Transport near Underdale
- FAQ
- Price Paid By Year
- Property Type Price
Frequently asked questions about Underdale
What is the average price for a property for sale in Underdale?
The average price for a property for sale in Underdale is £278,970. This amount is 10% lower than the average price in Shrewsbury. There are 253 property listings for sale in Underdale.
What streets have the most expensive properties for sale in Underdale?
The streets with the most expensive properties for sale in Underdale are Underdale Court at an average of £530,000, Underdale Road at an average of £529,318 and Underdale Avenue at an average of £505,500.
What streets have the most affordable properties for sale in Underdale?
The streets with the most affordable properties for sale in Underdale are The Chase at an average of £100,666, May Terrace at an average of £122,000 and Aston Butts at an average of £150,000.
Which train stations are available in or near Underdale?
Some of the train stations available in or near Underdale are Shrewsbury, Yorton and Wellington.
Property Price Paid in Underdale by Year
The average sold property price by year was:
| Year | Average Sold Price | Price Change |
Sold Properties
|
|---|---|---|---|
| 2025 | £299,591 | 14% |
40 Properties |
| 2024 | £257,869 | -10% |
49 Properties |
| 2023 | £283,616 | 13% |
45 Properties |
| 2022 | £247,329 | -7% |
40 Properties |
| 2021 | £264,669 | 16% |
70 Properties |
| 2020 | £222,821 | 9% |
42 Properties |
| 2019 | £203,437 | 6% |
55 Properties |
| 2018 | £190,823 | 2% |
76 Properties |
| 2017 | £186,555 | -11% |
81 Properties |
| 2016 | £207,358 | -6% |
65 Properties |
| 2015 | £219,612 | 20% |
62 Properties |
| 2014 | £175,052 | -4% |
56 Properties |
| 2013 | £181,753 | 3% |
51 Properties |
| 2012 | £176,636 | 13% |
33 Properties |
| 2011 | £153,173 | -25% |
36 Properties |
| 2010 | £192,102 | 15% |
51 Properties |
| 2009 | £163,807 | -14% |
56 Properties |
| 2008 | £187,001 | -3% |
33 Properties |
| 2007 | £191,777 | 17% |
79 Properties |
| 2006 | £160,070 | 4% |
82 Properties |
| 2005 | £154,278 | 8% |
63 Properties |
| 2004 | £142,000 | 7% |
75 Properties |
| 2003 | £131,624 | 23% |
71 Properties |
| 2002 | £101,843 | 15% |
102 Properties |
| 2001 | £86,642 | 17% |
89 Properties |
| 2000 | £71,526 | 5% |
91 Properties |
| 1999 | £67,638 | 7% |
96 Properties |
| 1998 | £62,834 | 6% |
127 Properties |
| 1997 | £58,753 | -5% |
118 Properties |
| 1996 | £61,671 | 9% |
80 Properties |
| 1995 | £56,168 | - |
38 Properties |
Property Price per Property Type in Underdale
Here you can find historic sold price data in order to help with your property search.
The average Property Paid Price for specific property types in the last three years are:
| Property Type | Average Sold Price | Sold Properties |
|---|---|---|
| Semi Detached House | £267,787.00 | 60 Semi Detached Houses |
| Detached House | £411,640.00 | 25 Detached Houses |
| Terraced House | £237,312.00 | 44 Terraced Houses |
| Flat | £116,400.00 | 5 Flats |

