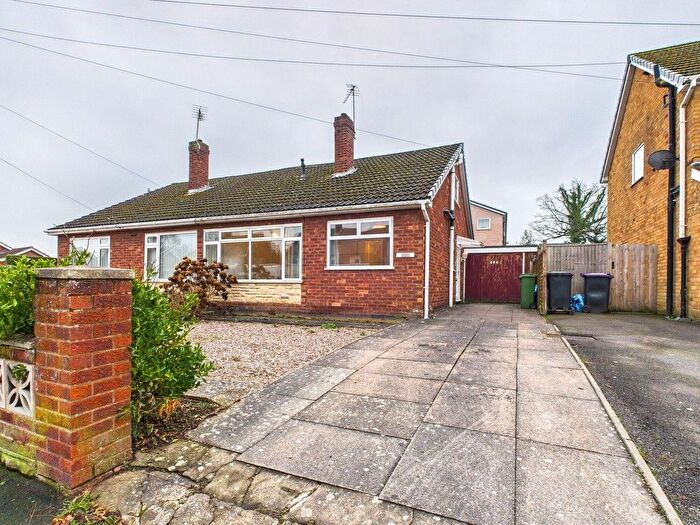
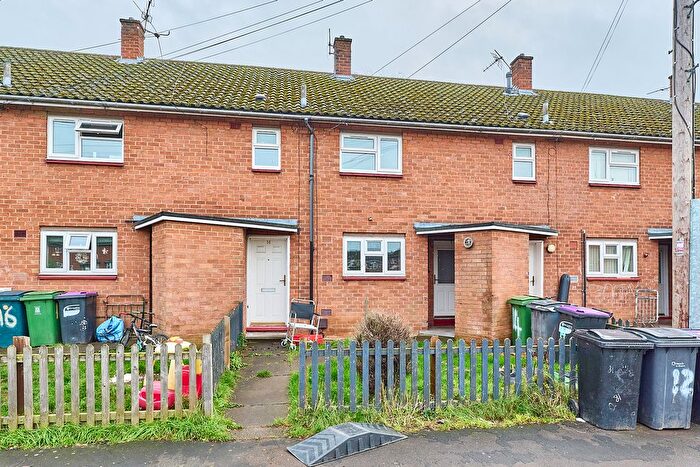
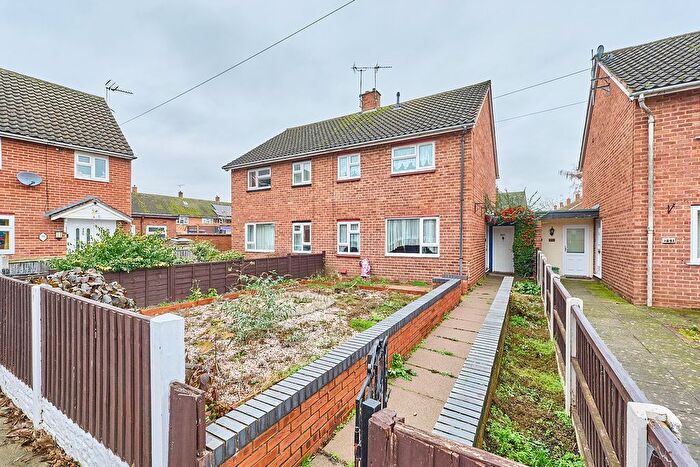
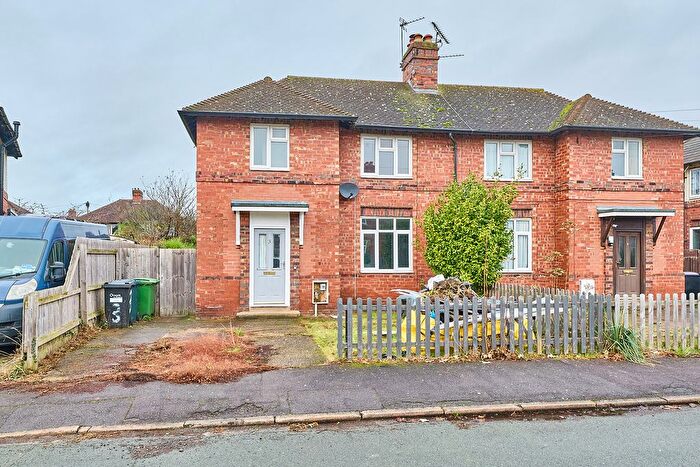
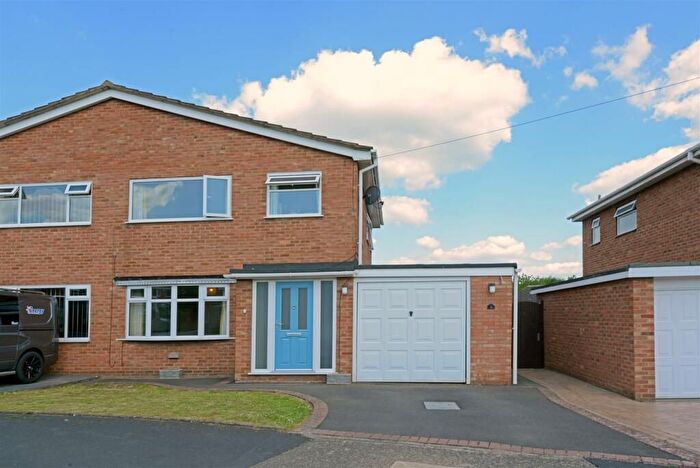
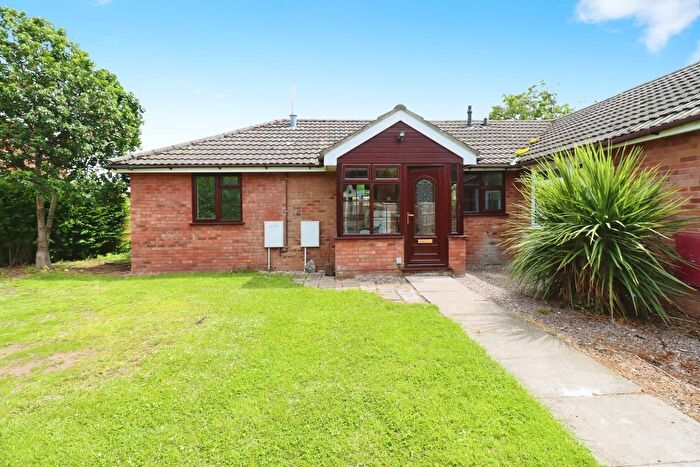
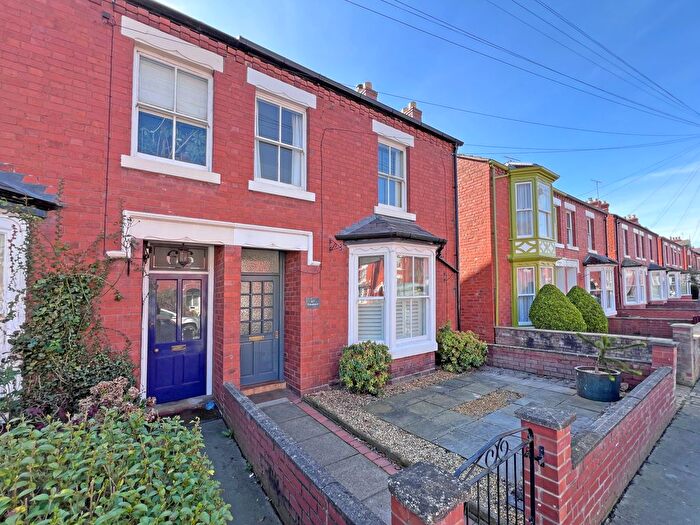
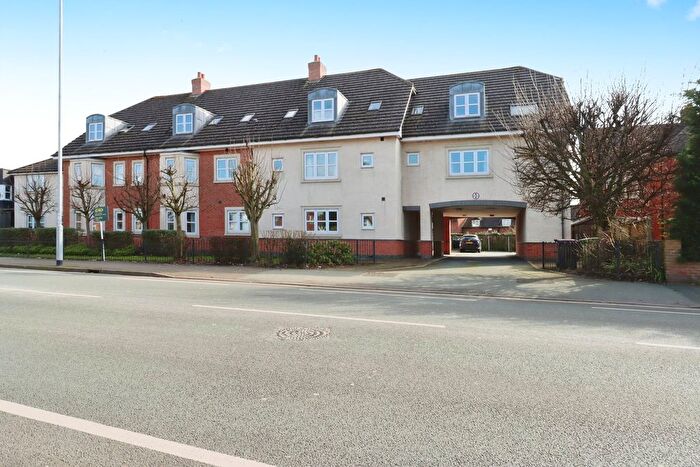
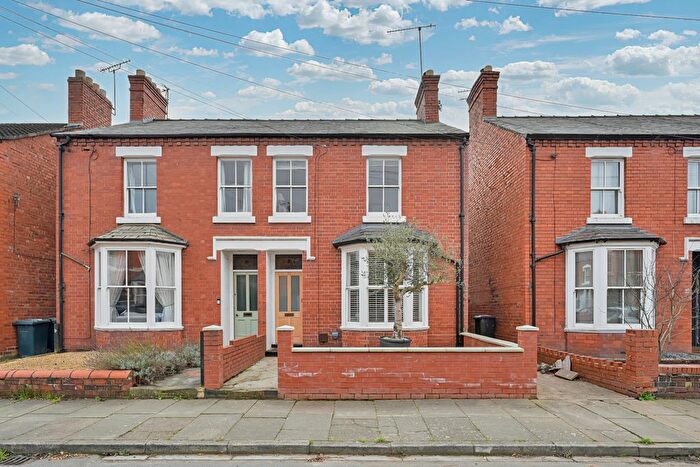
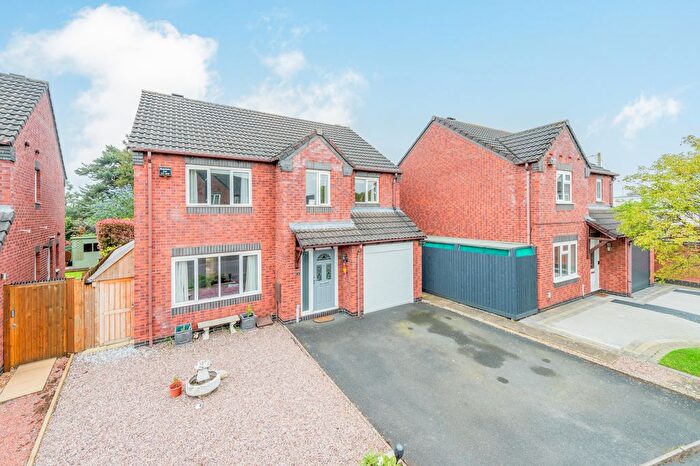
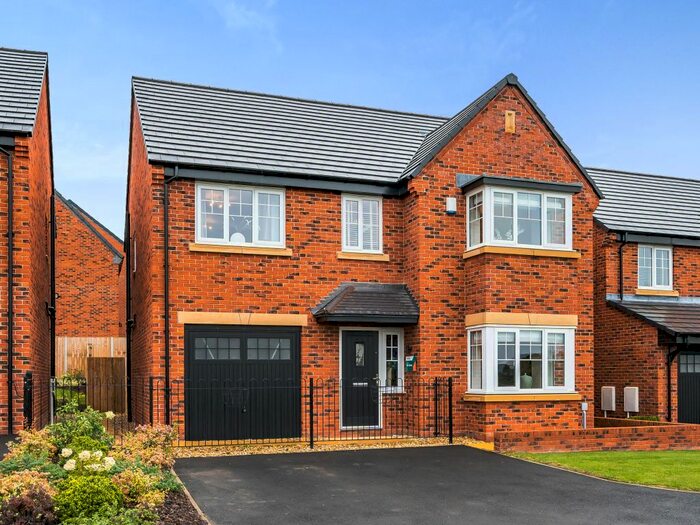
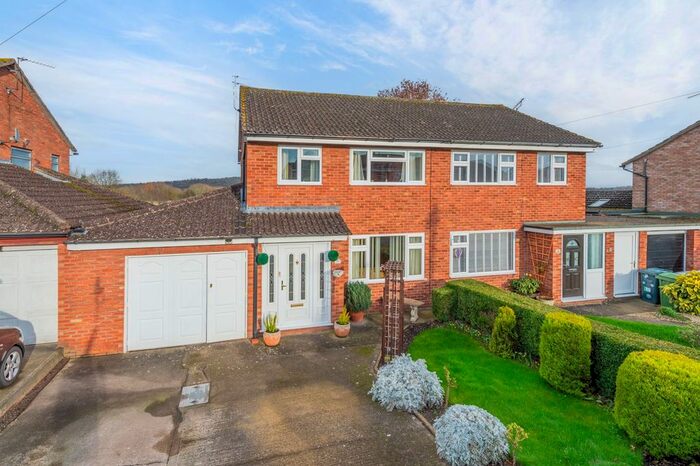
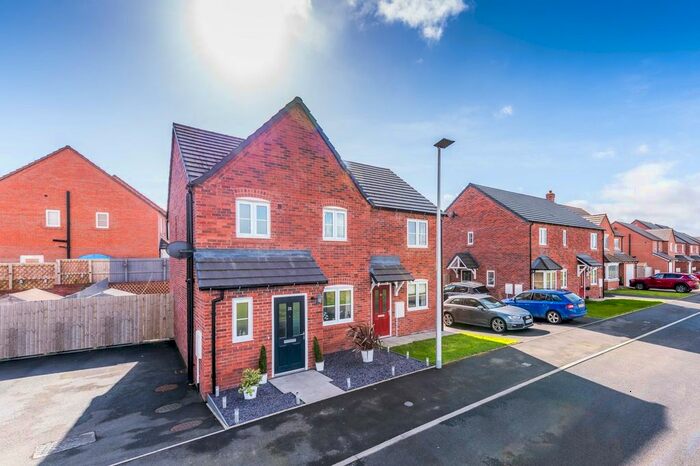
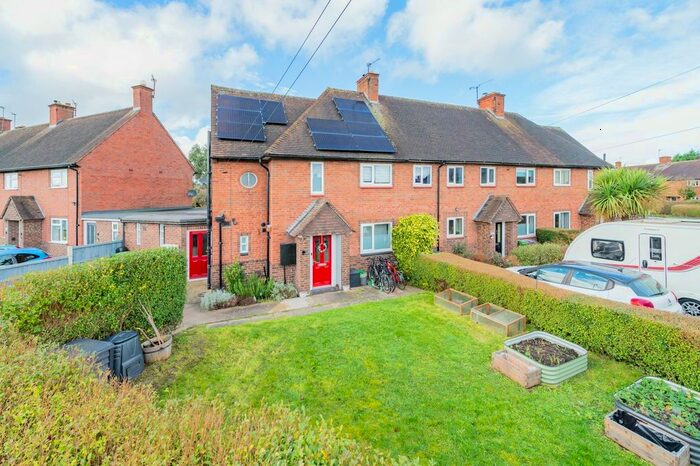
Houses for sale & to rent in Monkmoor, Shrewsbury
House Prices in Monkmoor
Properties in Monkmoor have an average house price of £218,277.00 and had 109 Property Transactions within the last 3 years¹.
Monkmoor is an area in Shrewsbury, Shropshire with 1,897 households², where the most expensive property was sold for £344,000.00.
Previously listed properties in Monkmoor
Roads and Postcodes in Monkmoor
Navigate through our locations to find the location of your next house in Monkmoor, Shrewsbury for sale or to rent.
| Streets | Postcodes |
|---|---|
| Abbots Close | SY2 5QS |
| Abbots Green | SY2 5QU |
| Abbots Place | SY2 5PY |
| Abbots Road | SY2 5PX SY2 5QA SY2 5QG SY2 5QX SY2 5PZ |
| Abbots Way | SY2 5QQ SY2 5QR |
| Abingdon Road | SY2 5XD SY2 5XF SY2 5XG |
| Allness Close | SY2 5XH |
| Barleyfield | SY2 5JT SY2 5JU SY2 5JX |
| Belgrave Place | SY2 5LJ |
| Belvidere Lane | SY2 5RH SY2 5RJ SY2 5RL |
| Belvidere Road | SY2 5RF SY2 5RE |
| Bewdley Avenue | SY2 5UQ |
| Burnham Avenue | SY2 5LL |
| Calder Close | SY2 5YQ |
| Caradoc Crescent | SY2 5RG |
| Cartland Avenue | SY2 5UW |
| Clive Green | SY2 5QL |
| Clive Road | SY2 5QN SY2 5QP SY2 5QT SY2 5QW SY2 5QY SY2 5RW |
| Clive Way | SY2 5QH SY2 5QJ |
| Coller Meadow | SY2 5QB |
| Connynger Crescent | SY2 5QD SY2 5QE SY2 5QF |
| Conway Drive | SY2 5UB SY2 5UF SY2 5UG SY2 5UJ SY2 5UL SY2 5UR SY2 5UU SY2 5UY SY2 5XA SY2 5XB SY2 5UA |
| Coppice Walk | SY2 5PS |
| Coseley Avenue | SY2 5UP |
| Crowmere Road | SY2 5JD SY2 5JG SY2 5JJ SY2 5JY SY2 5JZ SY2 5LA SY2 5LD SY2 5LE SY2 5LF SY2 5QZ |
| Dunkeld Drive | SY2 5UZ |
| Dymens Meadow | SY2 5JL SY2 5JN |
| Eskdale Road | SY2 5UD SY2 5UE SY2 5GA |
| Fairness Close | SY2 5YE |
| Fearn Drive | SY2 5XL |
| Flagwall | SY2 5JR |
| Forest Way | SY2 5RP |
| Frankton Close | SY2 5UX |
| Freer Meadow | SY2 5JH SY2 5JQ |
| Frith Close | SY2 5PU SY2 5XW |
| Galton Drive | SY2 5UT SY2 5XJ SY2 5YA |
| Grinshill Drive | SY2 5JE SY2 5JF |
| Gwyn Close | SY2 5JB |
| Hamilton Drive | SY2 5UH |
| Harcourt Crescent | SY2 5LG SY2 5LQ |
| Haywood Court | SY2 5RS |
| Hillside Drive | SY2 5LW |
| Hinton Drive | SY2 5LB |
| Langholm Drive | SY2 5UN |
| Lawley Gardens | SY2 5RQ |
| Ledwych Close | SY2 5YG |
| Longbridge Close | SY2 5YD |
| Lovat Close | SY2 5XE |
| Manor Way | SY2 5LN |
| Monkmoor Industrial Estate | SY2 5TX |
| Monkmoor Road | SY2 5BH SY2 5BJ SY2 5SP SY2 5ST SY2 5TL SY2 5SR |
| Monkmoor Trading Estate | SY2 5TZ |
| Mynd Close | SY2 5RA |
| Northwood Road | SY2 5LH |
| Potters Meadow | SY2 5JP SY2 5JW |
| Ragleth Gardens | SY2 5RB SY2 5RD |
| Shaw Road | SY2 5RN SY2 5XP SY2 5XR |
| Spinney Path | SY2 5PR |
| St James Road | SY2 5YH SY2 5YJ |
| Tenbury Drive | SY2 5YB SY2 5YF |
| Twyfords Way | SY2 5XN |
| Upton Lane | SY2 5RR |
| Weald Drive | SY2 5PT |
| SY2 5JS SY2 5YS |
Transport near Monkmoor
- FAQ
- Price Paid By Year
- Property Type Price
Frequently asked questions about Monkmoor
What is the average price for a property for sale in Monkmoor?
The average price for a property for sale in Monkmoor is £218,277. This amount is 29% lower than the average price in Shrewsbury. There are 199 property listings for sale in Monkmoor.
What streets have the most expensive properties for sale in Monkmoor?
The streets with the most expensive properties for sale in Monkmoor are Hillside Drive at an average of £335,000, St James Road at an average of £335,000 and Burnham Avenue at an average of £315,750.
What streets have the most affordable properties for sale in Monkmoor?
The streets with the most affordable properties for sale in Monkmoor are Coller Meadow at an average of £130,500, Barleyfield at an average of £151,250 and Dymens Meadow at an average of £157,500.
Which train stations are available in or near Monkmoor?
Some of the train stations available in or near Monkmoor are Shrewsbury, Yorton and Wellington.
Property Price Paid in Monkmoor by Year
The average sold property price by year was:
| Year | Average Sold Price | Price Change |
Sold Properties
|
|---|---|---|---|
| 2025 | £219,880 | 3% |
36 Properties |
| 2024 | £213,179 | -4% |
39 Properties |
| 2023 | £222,429 | -2% |
34 Properties |
| 2022 | £226,818 | 2% |
63 Properties |
| 2021 | £223,159 | 13% |
70 Properties |
| 2020 | £193,439 | 2% |
54 Properties |
| 2019 | £189,548 | 3% |
41 Properties |
| 2018 | £183,586 | -4% |
45 Properties |
| 2017 | £190,704 | -0,3% |
57 Properties |
| 2016 | £191,272 | 11% |
56 Properties |
| 2015 | £169,956 | 11% |
45 Properties |
| 2014 | £150,769 | 1% |
48 Properties |
| 2013 | £149,794 | 6% |
38 Properties |
| 2012 | £140,561 | -3% |
36 Properties |
| 2011 | £144,385 | 0,1% |
31 Properties |
| 2010 | £144,281 | -3% |
48 Properties |
| 2009 | £149,012 | -5% |
35 Properties |
| 2008 | £155,990 | -1% |
31 Properties |
| 2007 | £157,008 | 10% |
74 Properties |
| 2006 | £140,726 | 5% |
88 Properties |
| 2005 | £133,165 | 7% |
54 Properties |
| 2004 | £123,548 | 13% |
80 Properties |
| 2003 | £106,884 | 13% |
60 Properties |
| 2002 | £92,588 | 20% |
86 Properties |
| 2001 | £74,309 | 19% |
59 Properties |
| 2000 | £60,502 | -0,4% |
53 Properties |
| 1999 | £60,762 | 17% |
72 Properties |
| 1998 | £50,240 | 1% |
65 Properties |
| 1997 | £49,601 | -4% |
73 Properties |
| 1996 | £51,399 | 5% |
72 Properties |
| 1995 | £48,672 | - |
53 Properties |
Property Price per Property Type in Monkmoor
Here you can find historic sold price data in order to help with your property search.
The average Property Paid Price for specific property types in the last three years are:
| Property Type | Average Sold Price | Sold Properties |
|---|---|---|
| Semi Detached House | £230,945.00 | 61 Semi Detached Houses |
| Detached House | £309,750.00 | 8 Detached Houses |
| Terraced House | £184,691.00 | 37 Terraced Houses |
| Flat | £131,000.00 | 3 Flats |

