
Houses for sale & to rent in SY1 3QZ, Mortimar, Harlescott, Shrewsbury
House Prices in SY1 3QZ, Mortimar, Harlescott
Properties in SY1 3QZ have no sales history available within the last 3 years. SY1 3QZ is a postcode in Mortimar located in Harlescott, an area in Shrewsbury, Shropshire, with 9 households².
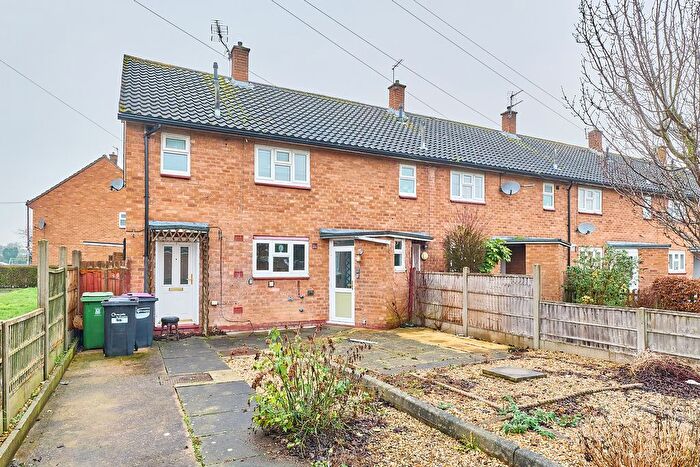
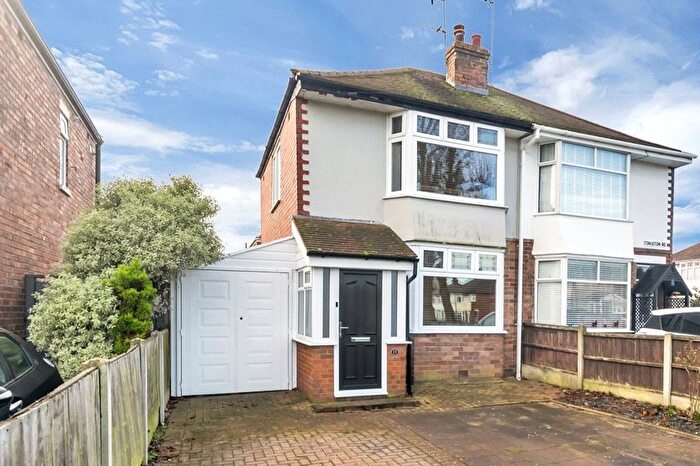
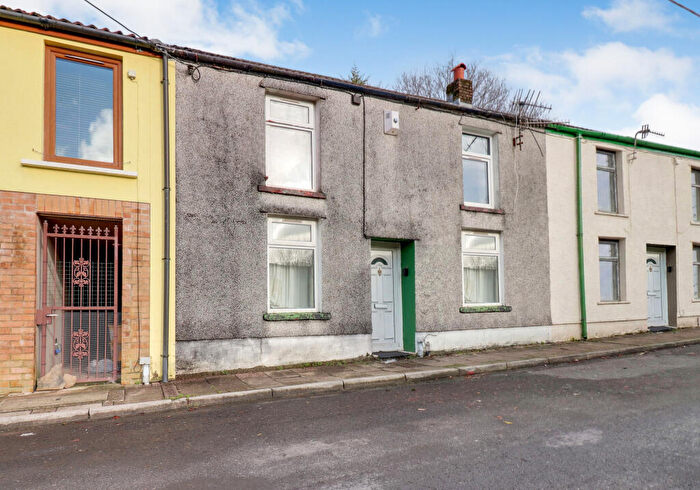
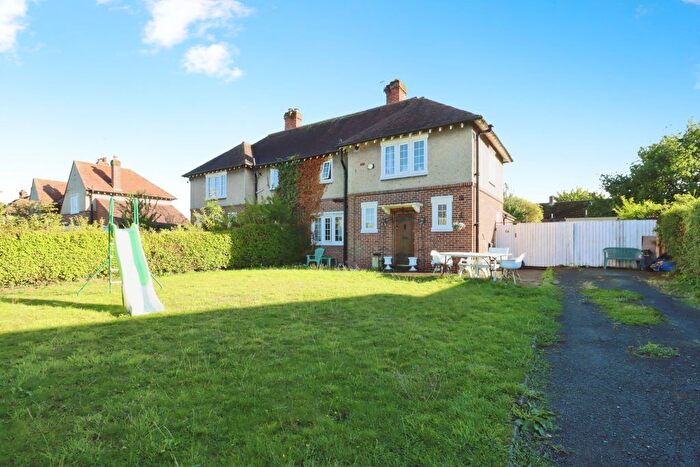
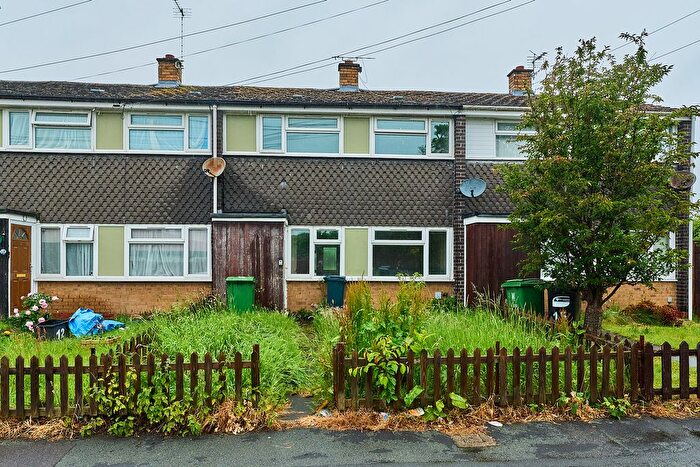
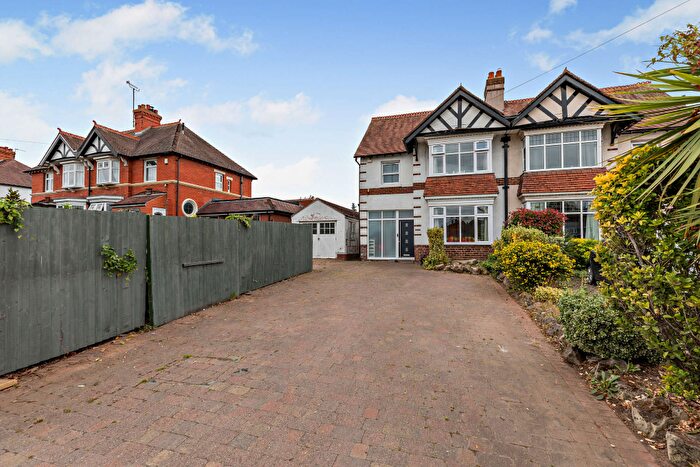
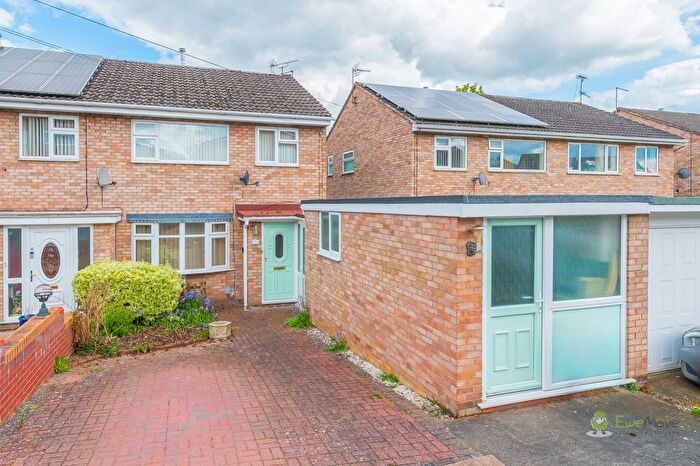
Properties for sale near SY1 3QZ, Mortimar
![]()
If you are looking to sell your house, let it out, or receive a property valuation, an expert can help you.
Click the button below to get started.
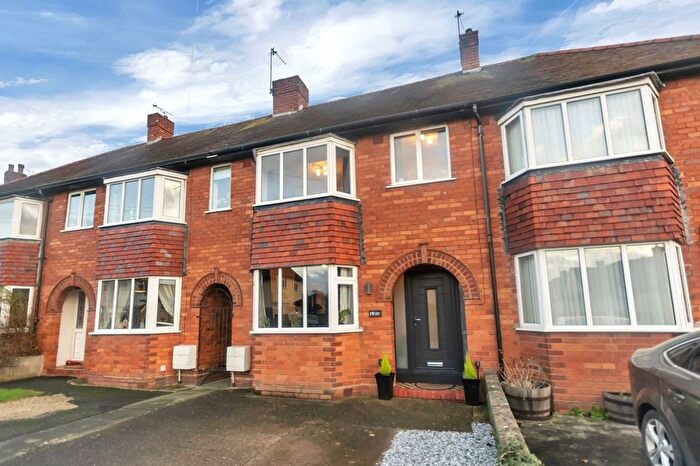
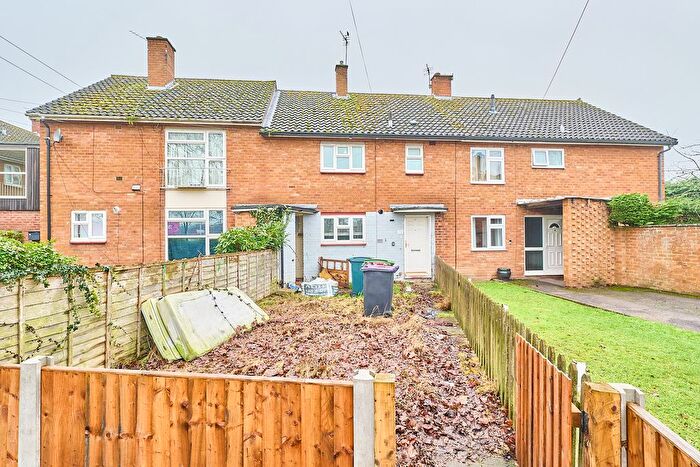
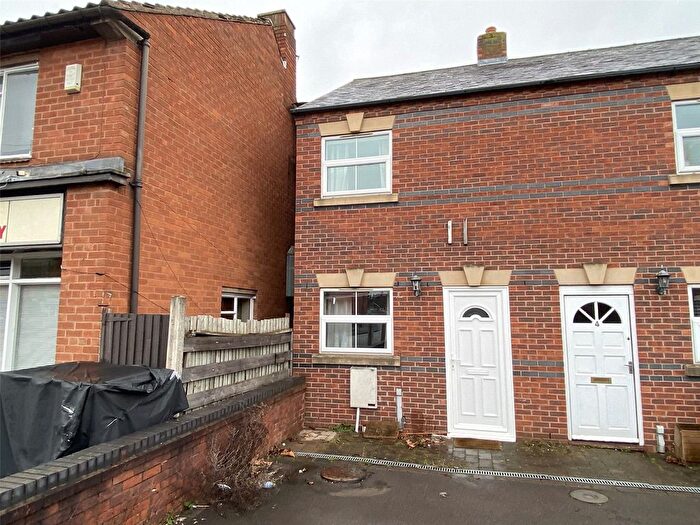
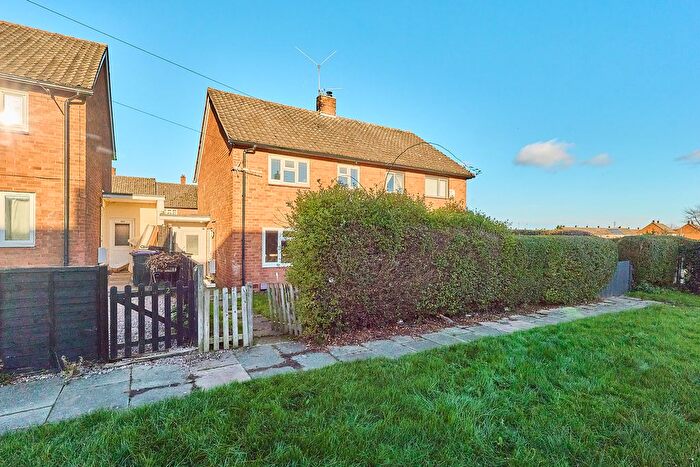
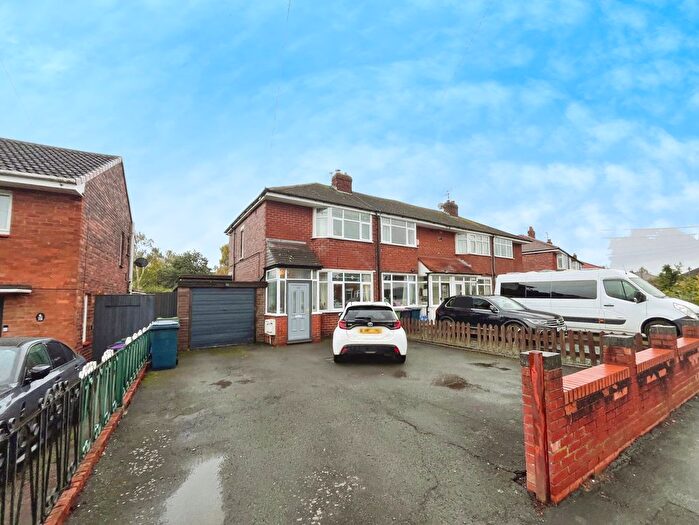
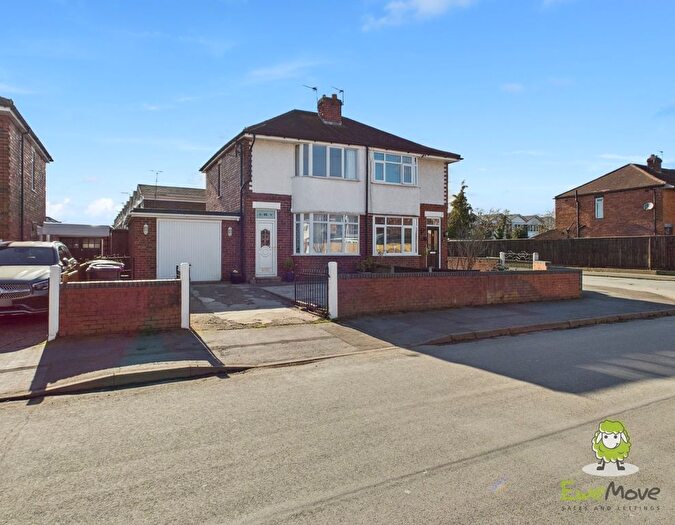
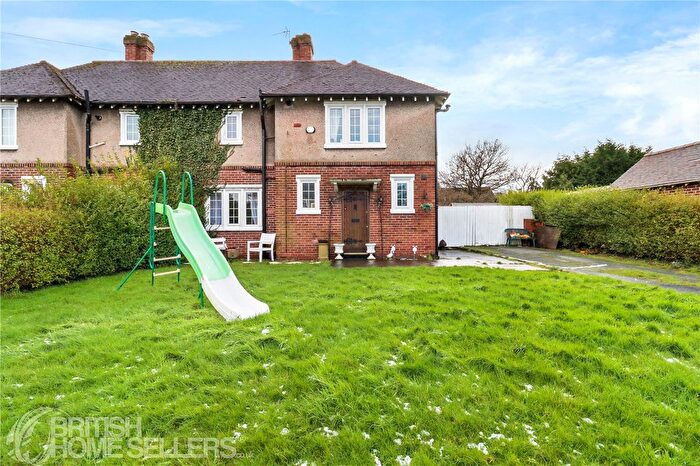
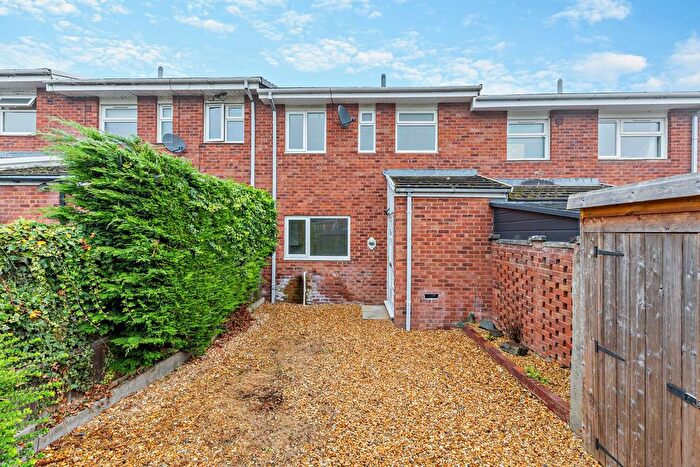
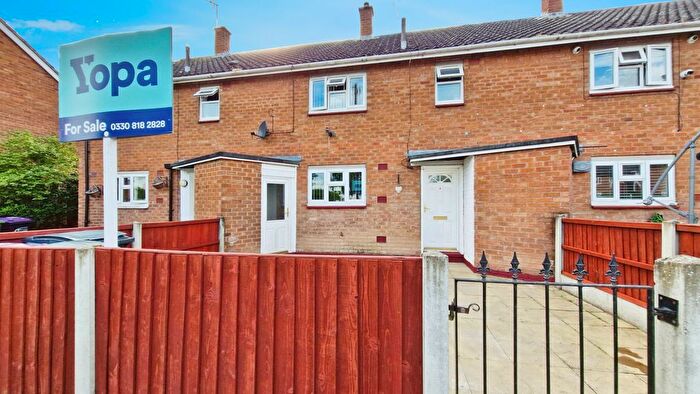
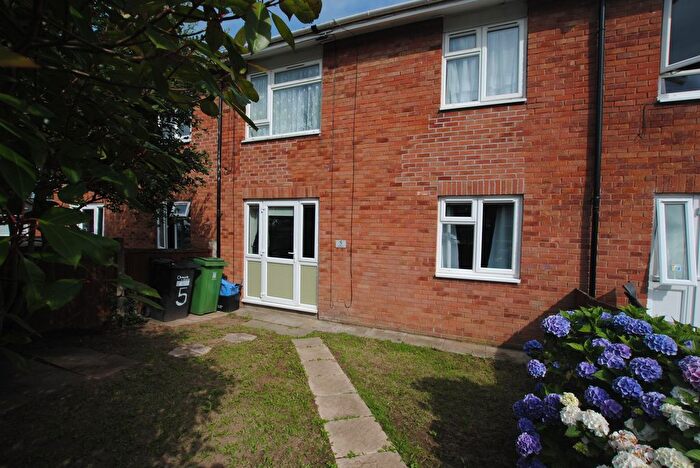
Previously listed properties near SY1 3QZ, Mortimar
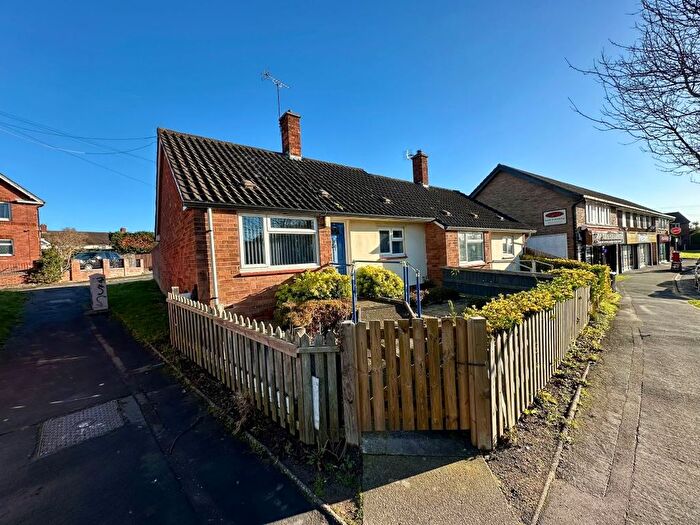
![]()
If you are looking to sell your house, let it out, or receive a property valuation, an expert can help you.
Click the button below to get started.
Price Paid in Mortimar, SY1 3QZ, Harlescott
2 Mortimar, SY1 3QZ, Harlescott Shrewsbury
Property 2 has been sold 3 times. The last time it was sold was in 16/11/2021 and the sold price was £154,000.00.
This terraced house, sold as a freehold on 16/11/2021, is a 78 sqm end-terrace house with an EPC rating of C.
| Date | Price | Property Type | Tenure | Classification |
|---|---|---|---|---|
| 16/11/2021 | £154,000.00 | Terraced House | freehold | Established Building |
| 17/02/2015 | £102,500.00 | Terraced House | freehold | Established Building |
| 09/04/2010 | £99,000.00 | Semi Detached House | freehold | Established Building |
6 Mortimar, SY1 3QZ, Harlescott Shrewsbury
Property 6 has been sold 3 times. The last time it was sold was in 14/08/2017 and the sold price was £115,000.00.
This semi detached house, sold as a freehold on 14/08/2017, is a 82 sqm mid-terrace house with an EPC rating of D.
| Date | Price | Property Type | Tenure | Classification |
|---|---|---|---|---|
| 14/08/2017 | £115,000.00 | Semi Detached House | freehold | Established Building |
| 09/02/2007 | £104,500.00 | Semi Detached House | freehold | Established Building |
| 30/04/2004 | £74,500.00 | Semi Detached House | freehold | Established Building |
10 Mortimar, SY1 3QZ, Harlescott Shrewsbury
This is a 39 square meter End-terrace Bungalow with an EPC rating of D. Currently, there is no transaction history available for this property.
Transport near SY1 3QZ, Mortimar

House price paid reports for SY1 3QZ, Mortimar
Click on the buttons below to see price paid reports by year or property price:
- Price Paid By Year
Property Price Paid in SY1 3QZ, Mortimar by Year
The average sold property price by year was:
| Year | Average Sold Price | Price Change |
Sold Properties
|
|---|---|---|---|
| 2021 | £154,000 | 25% |
1 Property |
| 2017 | £115,000 | 11% |
1 Property |
| 2015 | £102,500 | 3% |
1 Property |
| 2010 | £99,000 | -6% |
1 Property |
| 2007 | £104,500 | 29% |
1 Property |
| 2004 | £74,500 | - |
1 Property |