
Houses for sale & to rent in NE31 1BY, Caledonian Street, Hebburn North, Hebburn
House Prices in NE31 1BY, Caledonian Street, Hebburn North
Properties in NE31 1BY have no sales history available within the last 3 years. NE31 1BY is a postcode in Caledonian Street located in Hebburn North, an area in Hebburn, South Tyneside, with 14 households².
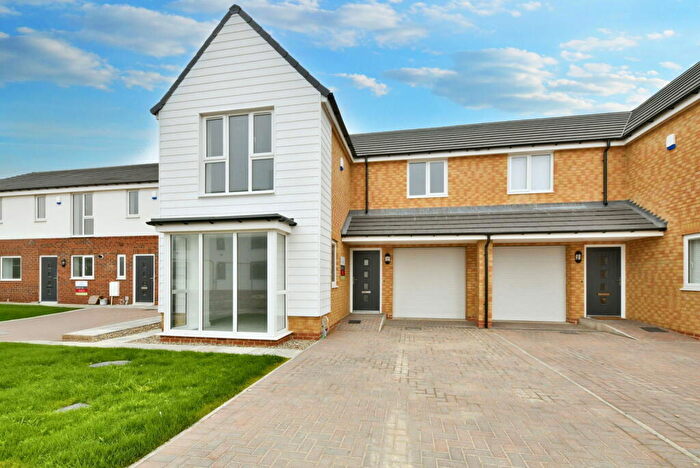
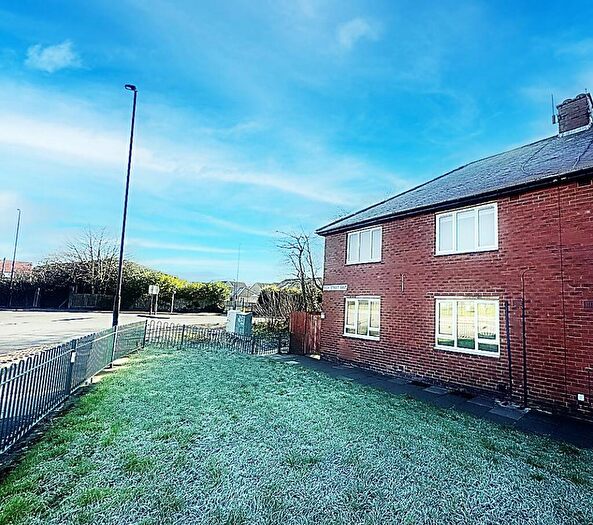
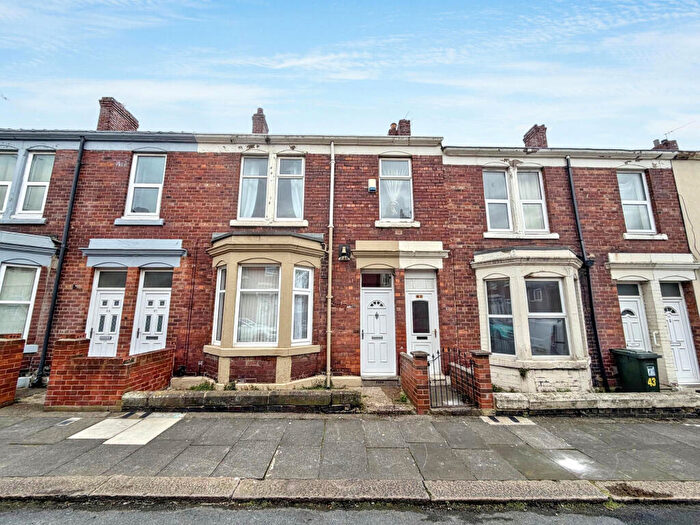
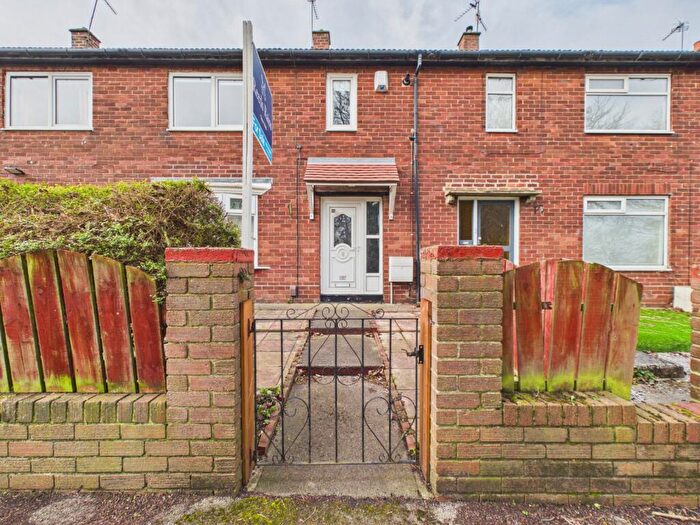
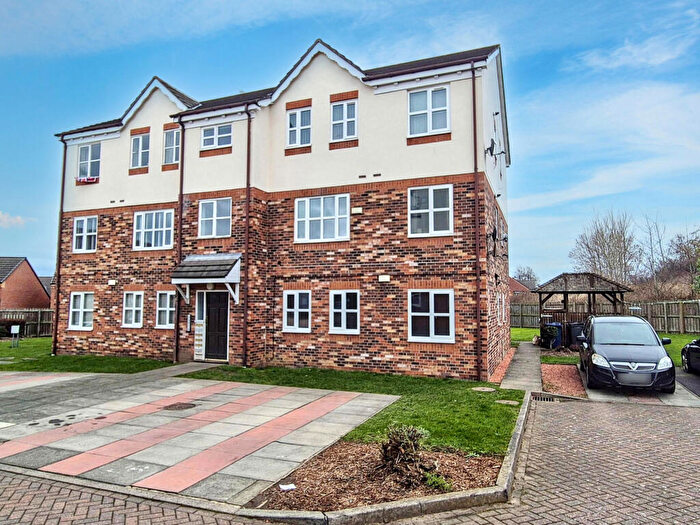
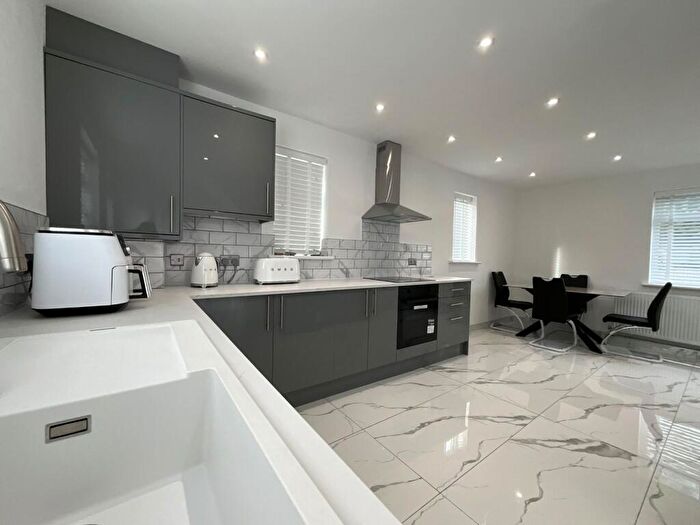
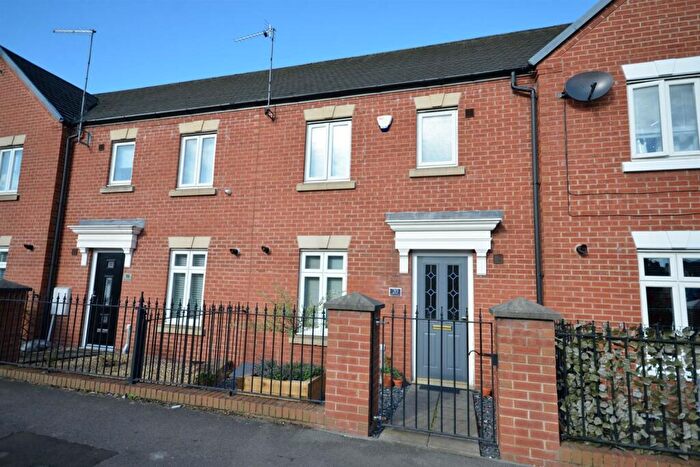
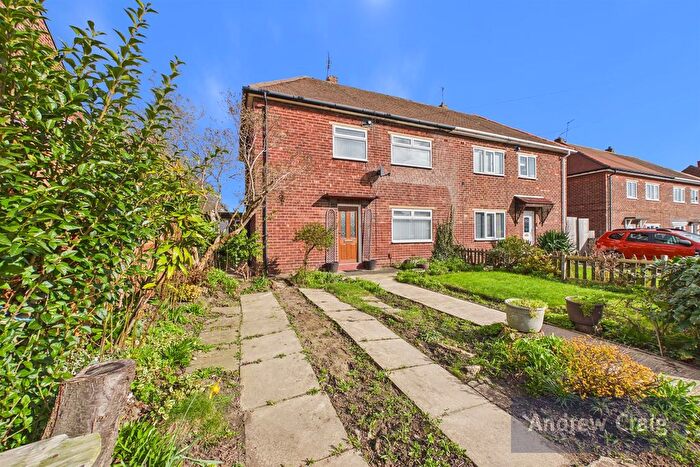
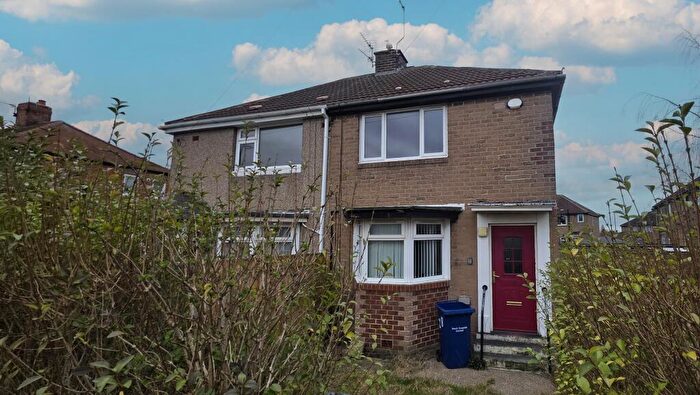
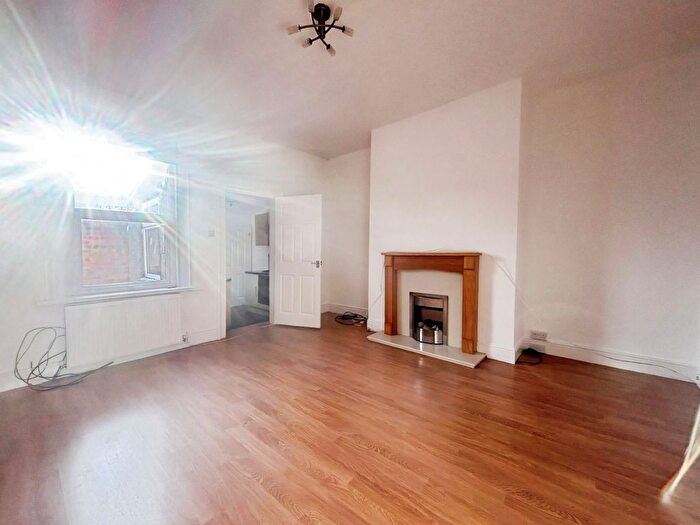
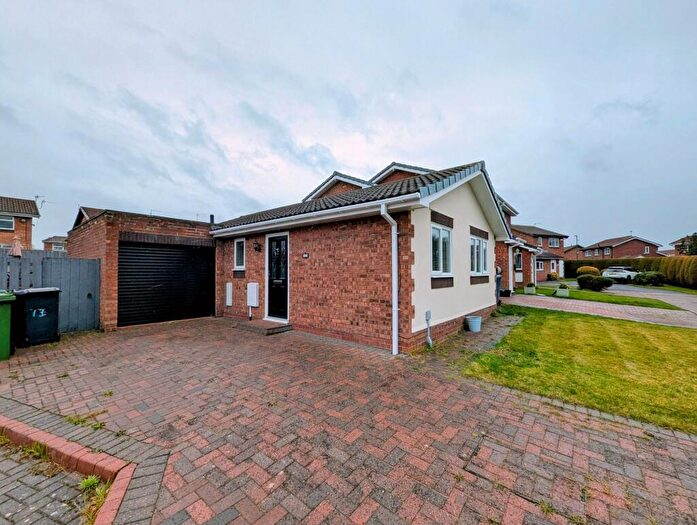
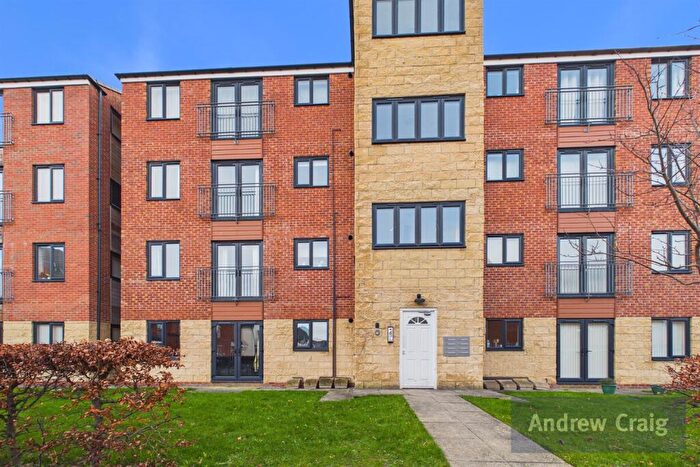
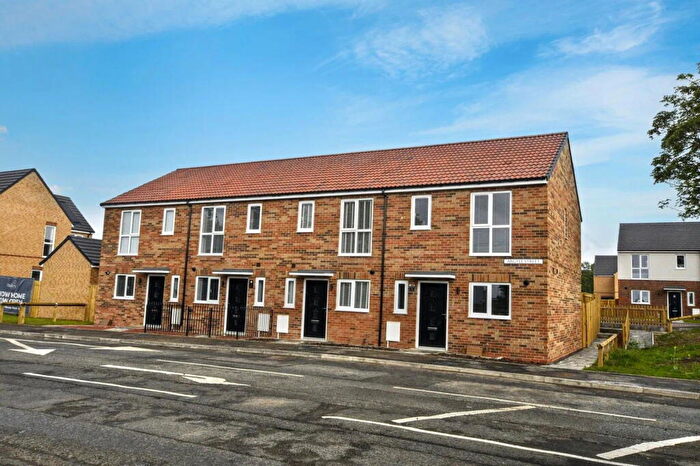
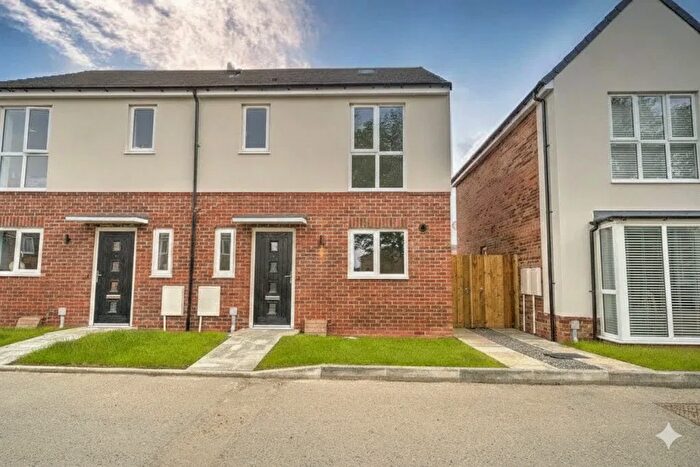
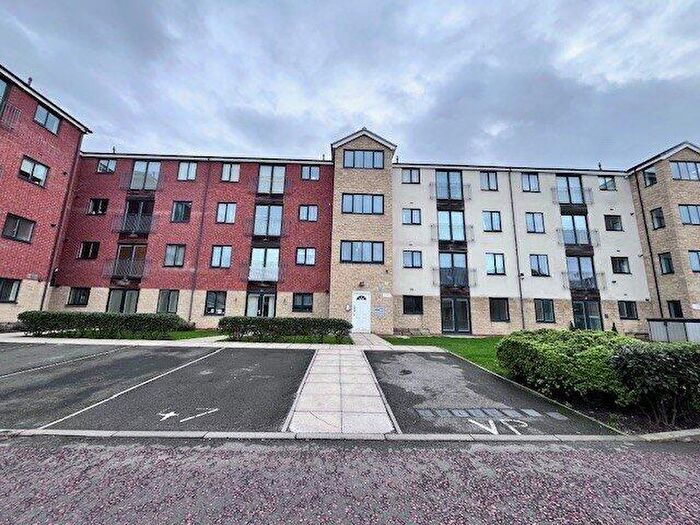
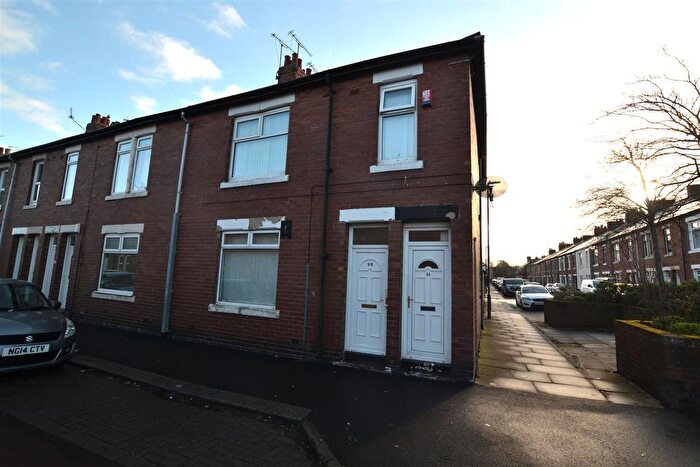
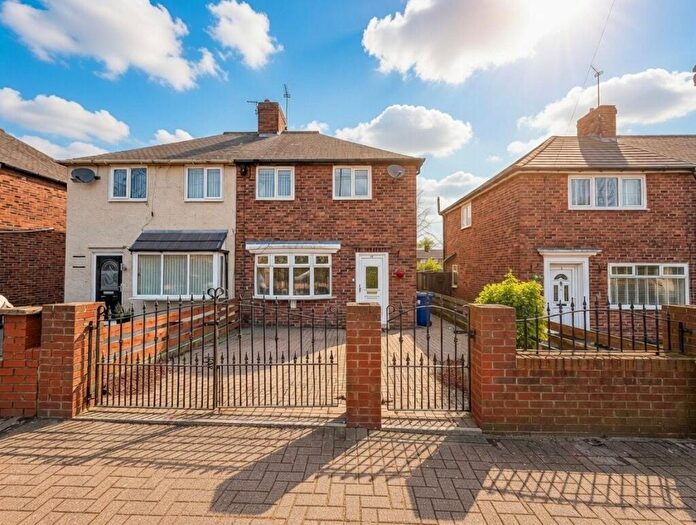
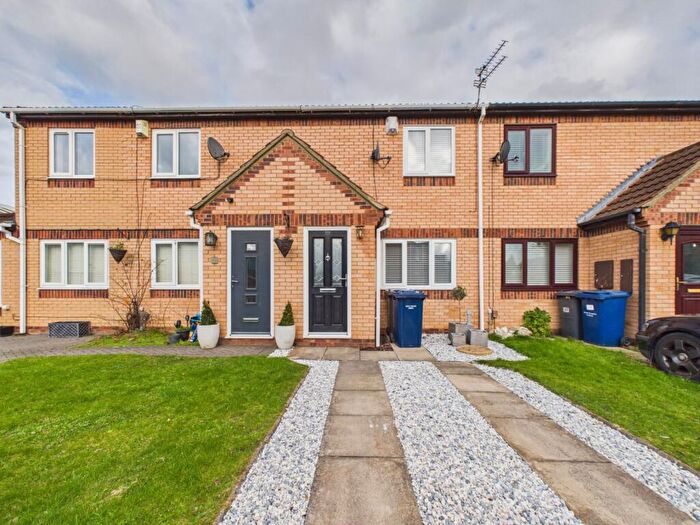
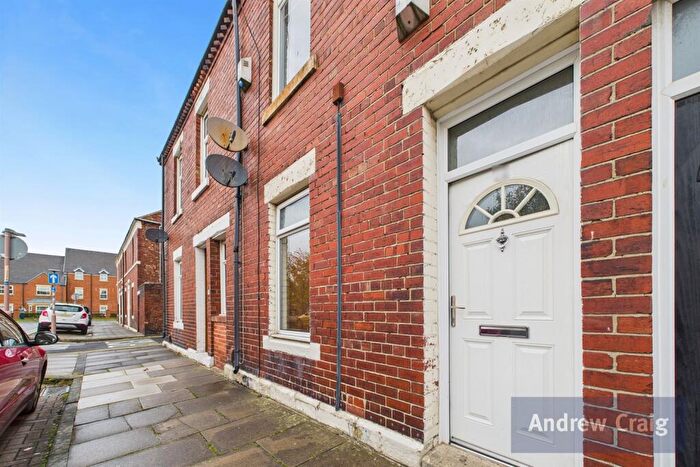
Properties for sale near NE31 1BY, Caledonian Street

![]()
If you are looking to sell your house, let it out, or receive a property valuation, an expert can help you.
Click the button below to get started.


Price Paid in Caledonian Street, NE31 1BY, Hebburn North
6 Caledonian Street, NE31 1BY, Hebburn North Hebburn
Property 6 has been sold 2 times. The last time it was sold was in 15/07/2022 and the sold price was £80,000.00.
This terraced house, sold as a freehold on 15/07/2022, is a 67 sqm mid-terrace house with an EPC rating of C.
| Date | Price | Property Type | Tenure | Classification |
|---|---|---|---|---|
| 15/07/2022 | £80,000.00 | Terraced House | freehold | Established Building |
| 31/01/2005 | £73,000.00 | Terraced House | freehold | Established Building |
24 Caledonian Street, NE31 1BY, Hebburn North Hebburn
Property 24 has been sold 1 time. The last time it was sold was in 22/05/2020 and the sold price was £65,000.00.
This is a Terraced House which was sold as a freehold in 22/05/2020
| Date | Price | Property Type | Tenure | Classification |
|---|---|---|---|---|
| 22/05/2020 | £65,000.00 | Terraced House | freehold | Established Building |
8 Caledonian Street, NE31 1BY, Hebburn North Hebburn
Property 8 has been sold 1 time. The last time it was sold was in 11/10/2010 and the sold price was £70,000.00.
This terraced house, sold as a freehold on 11/10/2010, is a 66 sqm mid-terrace house with an EPC rating of C.
| Date | Price | Property Type | Tenure | Classification |
|---|---|---|---|---|
| 11/10/2010 | £70,000.00 | Terraced House | freehold | Established Building |
Transport near NE31 1BY, Caledonian Street

House price paid reports for NE31 1BY, Caledonian Street
Click on the buttons below to see price paid reports by year or property price:
- Price Paid By Year
Property Price Paid in NE31 1BY, Caledonian Street by Year
The average sold property price by year was:
| Year | Average Sold Price | Price Change |
Sold Properties
|
|---|---|---|---|
| 2022 | £80,000 | 19% |
1 Property |
| 2020 | £65,000 | -8% |
1 Property |
| 2010 | £70,000 | -4% |
1 Property |
| 2005 | £73,000 | - |
1 Property |