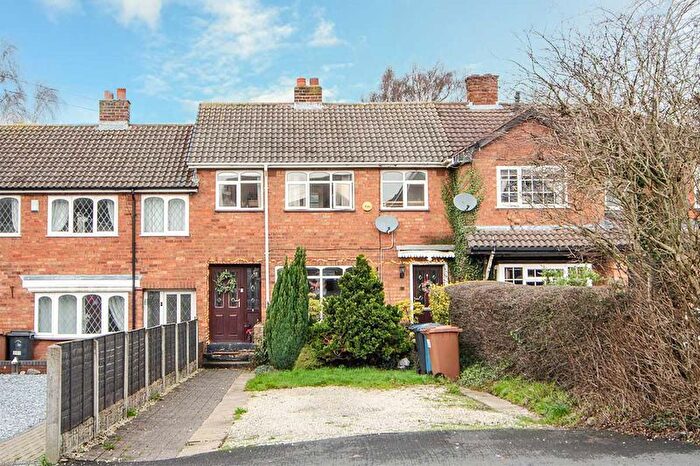
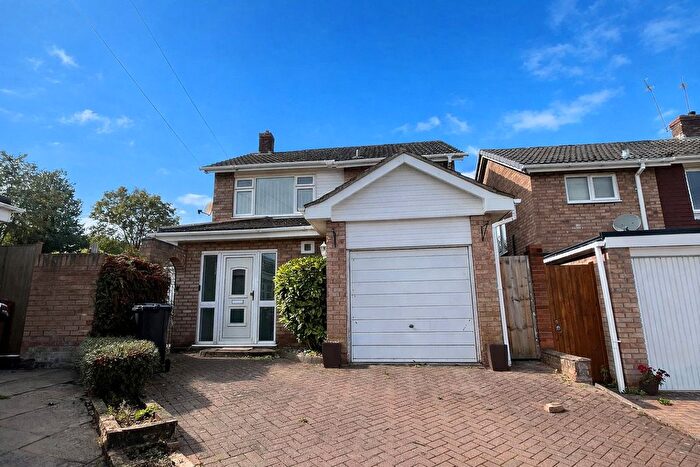
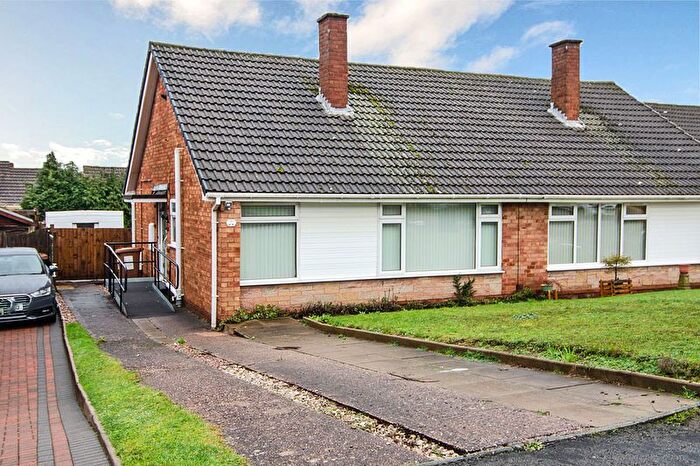
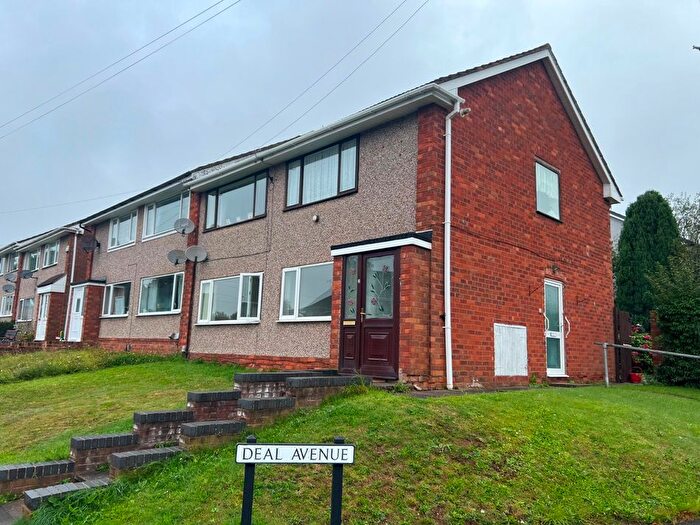
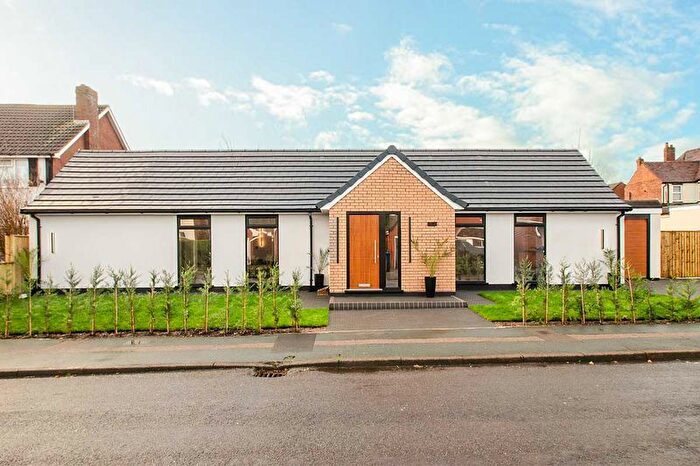
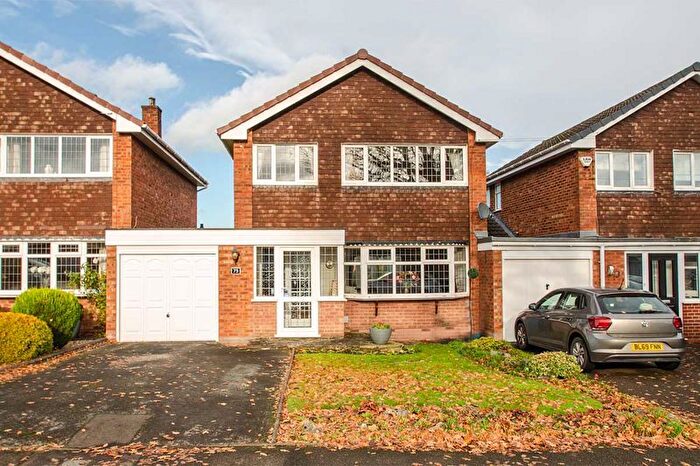
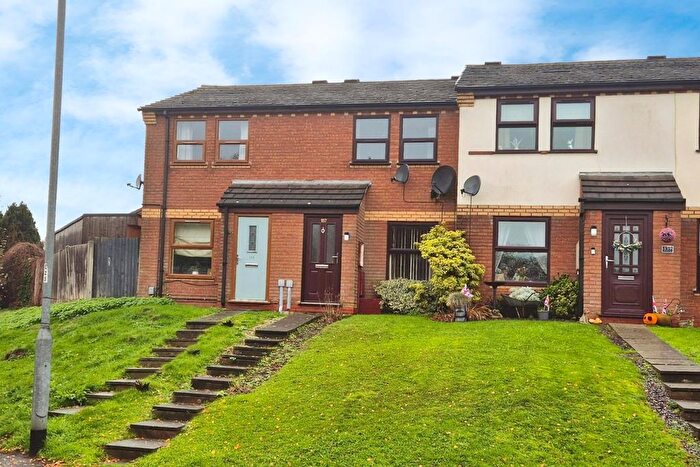
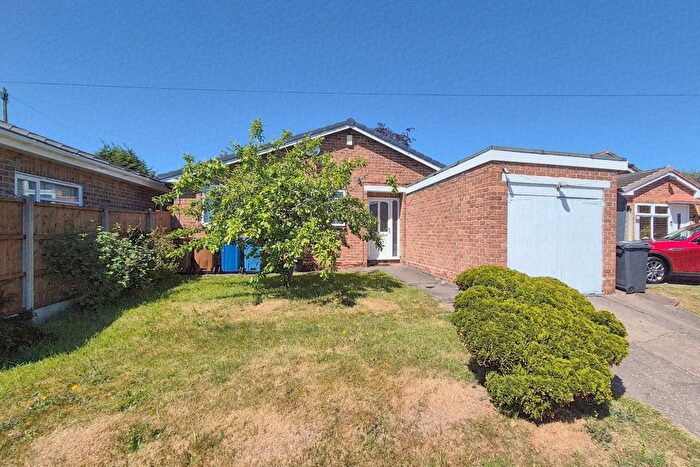
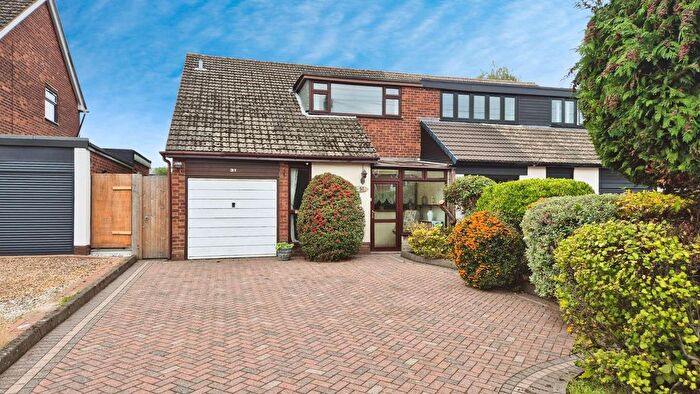
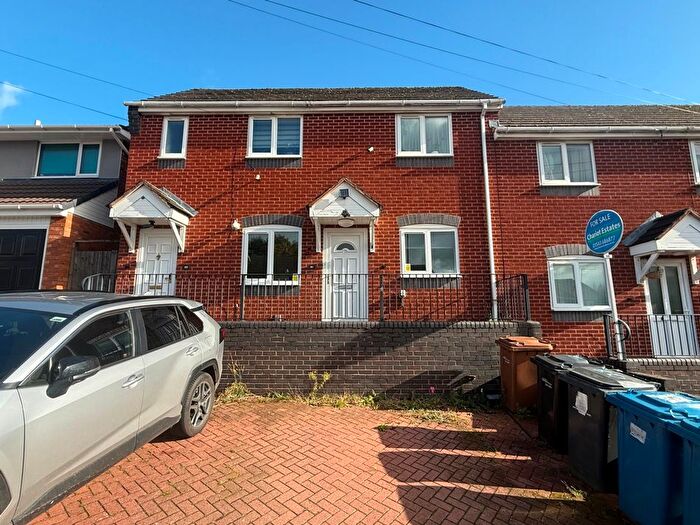
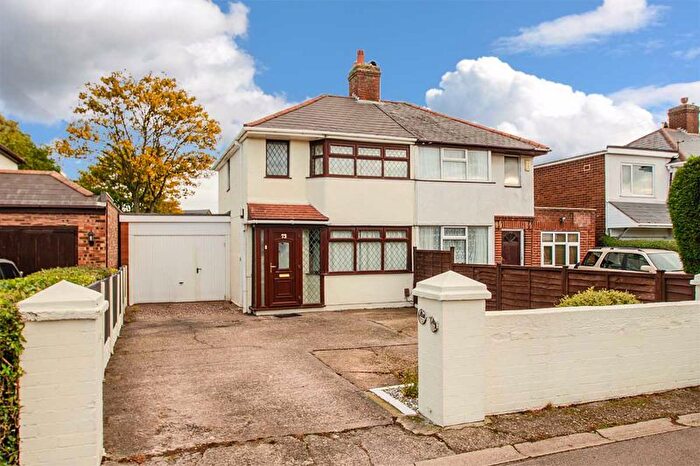
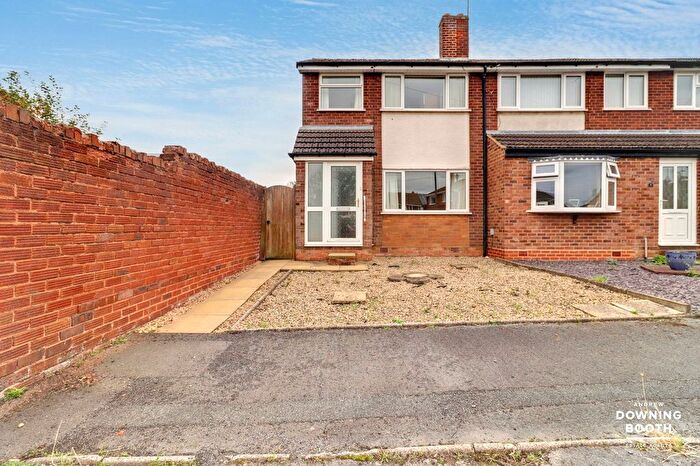
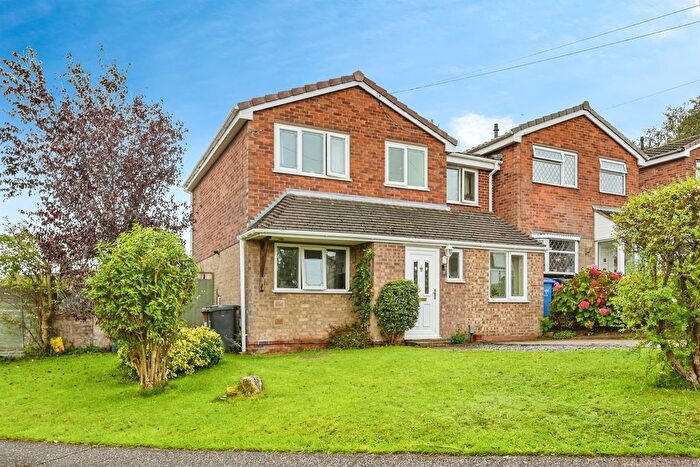
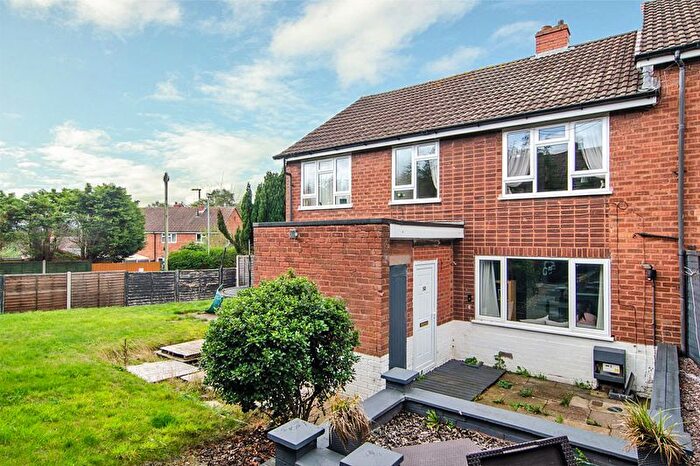
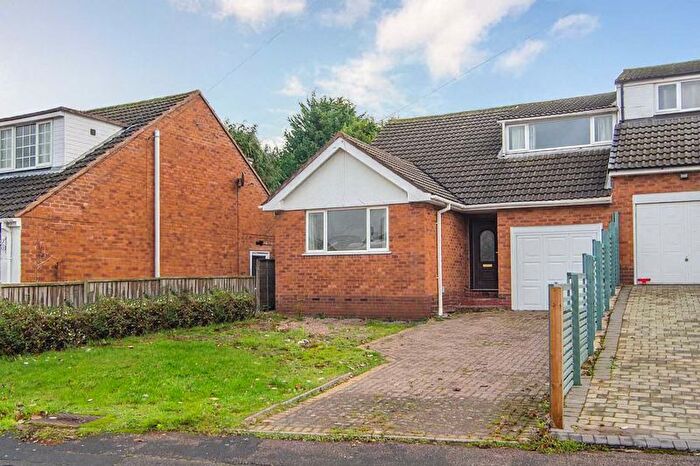
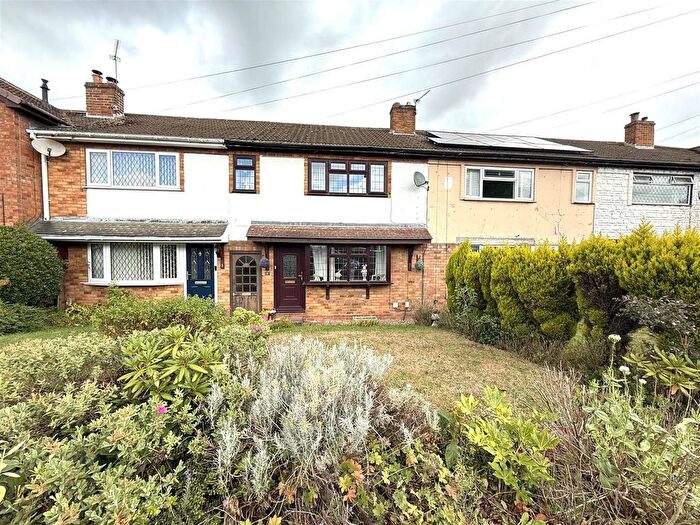
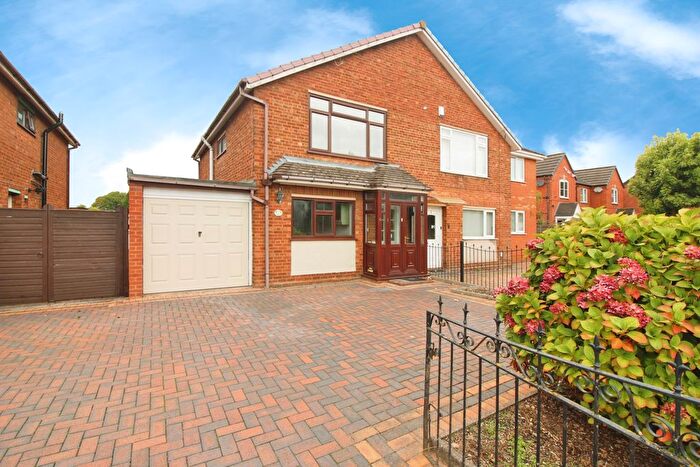
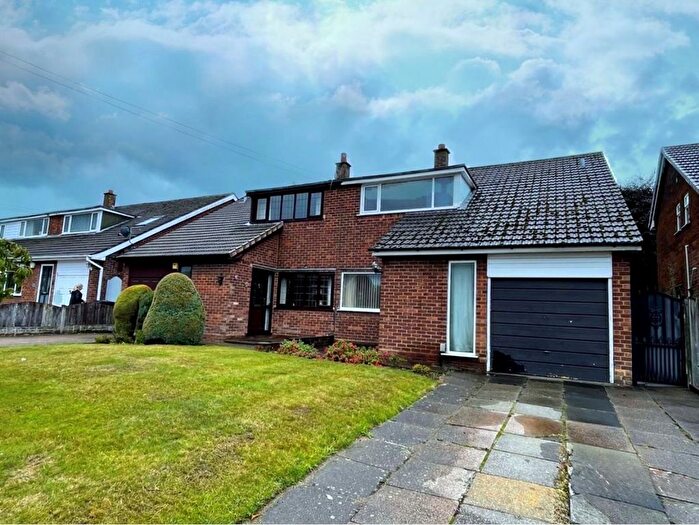
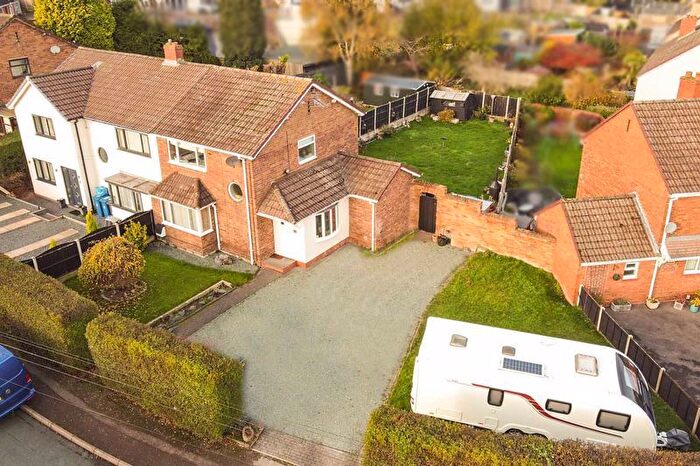
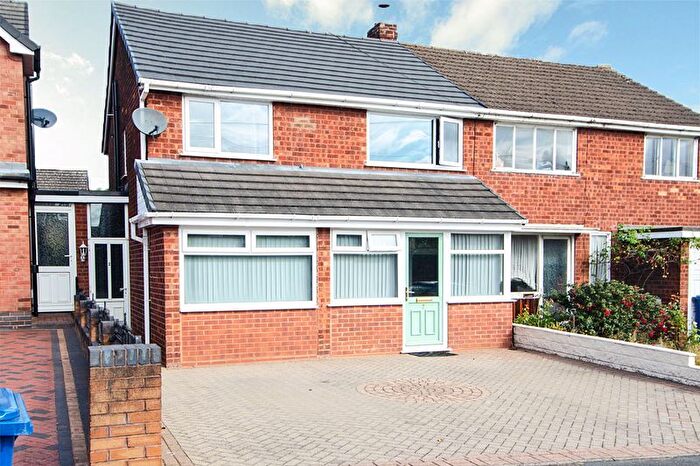
Houses for sale & to rent in Burntwood Central, Burntwood
House Prices in Burntwood Central
Properties in Burntwood Central have an average house price of £246,742.00 and had 159 Property Transactions within the last 3 years¹.
Burntwood Central is an area in Burntwood, Staffordshire with 1,200 households², where the most expensive property was sold for £485,000.00.
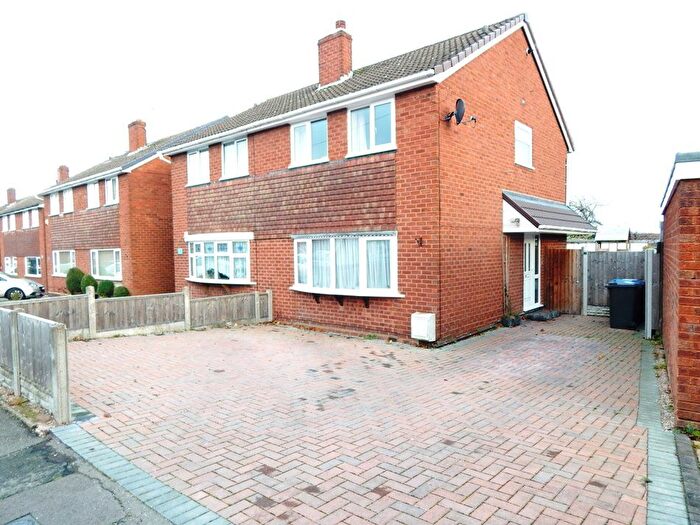
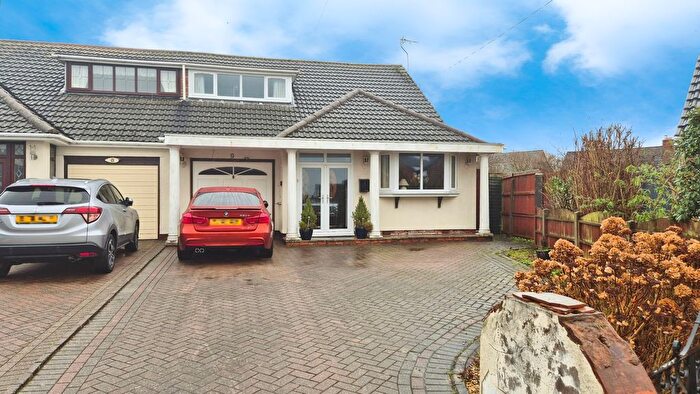
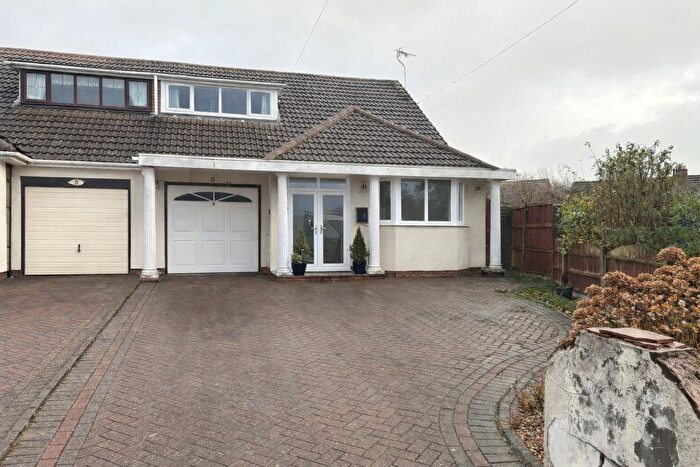
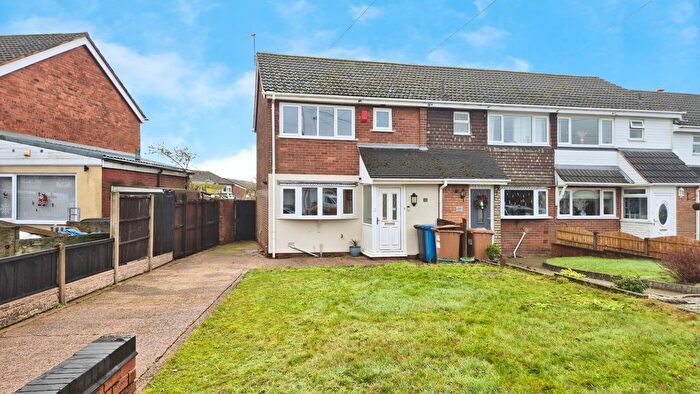
Properties for sale in Burntwood Central
Previously listed properties in Burntwood Central
Roads and Postcodes in Burntwood Central
Navigate through our locations to find the location of your next house in Burntwood Central, Burntwood for sale or to rent.
| Streets | Postcodes |
|---|---|
| Alden Hurst | WS7 2BQ |
| Ashmead Road | WS7 2DG WS7 2DU WS7 2EF |
| Aspen Grove | WS7 2AT |
| Bampton Avenue | WS7 2EQ |
| Beechen Grove | WS7 2BH |
| Boney Hay Road | WS7 9AB WS7 9AN |
| Bridge Cross Road | WS7 2BU WS7 2DA |
| Californian Grove | WS7 2BG |
| Cannock Road | WS7 0BG |
| Carlton Crescent | WS7 2EP |
| Clinton Crescent | WS7 2EA |
| Clive Road | WS7 2DJ |
| Columbian Crescent | WS7 2BD |
| Corsican Close | WS7 2AZ |
| Cranfield Road | WS7 2DQ |
| Cumberland Crescent | WS7 2EW |
| Deerfold Crescent | WS7 9AX |
| Dunston Drive | WS7 2EJ |
| Dursley Road | WS7 2DS |
| Eastwood Avenue | WS7 2DX |
| Fieldhouse Road | WS7 2DW |
| Filton Avenue | WS7 2EG |
| Galway Road | WS7 2DT |
| Halston Road | WS7 2DY |
| Highfield Avenue | WS7 9AP WS7 9AW |
| Highfield Close | WS7 9AR |
| Lambert Drive | WS7 2DR |
| Lebanon Grove | WS7 2BE |
| Linden Avenue | WS7 2AX |
| Lombardy Grove | WS7 2BA |
| Lulworth Road | WS7 2DN |
| Marton Avenue | WS7 2EH |
| Morley Road | WS7 2DE WS7 2DZ WS7 9AS |
| Morlings Drive | WS7 2ED |
| Myatt Avenue | WS7 2DF |
| Oaken Gardens | WS7 2AY |
| Ogley Hay Road | WS7 2EB |
| Oregon Gardens | WS7 2BB |
| Redwood Drive | WS7 2AR WS7 2AS WS7 2AU |
| Rochester Avenue | WS7 2DH WS7 2DL WS7 2EN |
| Rugeley Road | WS7 1AA WS7 1AU |
| Stamford Crescent | WS7 2DP |
| Victory Avenue | WS7 2AL |
Transport near Burntwood Central
-
Hednesford Station
-
Cannock Station
-
Lichfield City Station
-
Landywood Station
-
Shenstone Station
-
Rugeley Town Station
- FAQ
- Price Paid By Year
- Property Type Price
Frequently asked questions about Burntwood Central
What is the average price for a property for sale in Burntwood Central?
The average price for a property for sale in Burntwood Central is £246,742. This amount is 6% lower than the average price in Burntwood. There are 634 property listings for sale in Burntwood Central.
What streets have the most expensive properties for sale in Burntwood Central?
The streets with the most expensive properties for sale in Burntwood Central are Cumberland Crescent at an average of £330,500, Californian Grove at an average of £302,500 and Bridge Cross Road at an average of £280,777.
What streets have the most affordable properties for sale in Burntwood Central?
The streets with the most affordable properties for sale in Burntwood Central are Alden Hurst at an average of £207,100, Highfield Close at an average of £208,750 and Carlton Crescent at an average of £213,857.
Which train stations are available in or near Burntwood Central?
Some of the train stations available in or near Burntwood Central are Hednesford, Cannock and Lichfield City.
Property Price Paid in Burntwood Central by Year
The average sold property price by year was:
| Year | Average Sold Price | Price Change |
Sold Properties
|
|---|---|---|---|
| 2025 | £247,839 | -1% |
28 Properties |
| 2024 | £249,413 | 2% |
43 Properties |
| 2023 | £244,578 | -0,3% |
35 Properties |
| 2022 | £245,426 | 9% |
53 Properties |
| 2021 | £223,600 | 13% |
54 Properties |
| 2020 | £194,259 | -3% |
27 Properties |
| 2019 | £200,893 | 11% |
38 Properties |
| 2018 | £178,465 | -6% |
38 Properties |
| 2017 | £189,506 | 11% |
48 Properties |
| 2016 | £168,367 | 2% |
42 Properties |
| 2015 | £164,563 | 4% |
57 Properties |
| 2014 | £157,302 | 7% |
44 Properties |
| 2013 | £146,255 | 3% |
35 Properties |
| 2012 | £141,701 | 7% |
29 Properties |
| 2011 | £132,343 | 6% |
29 Properties |
| 2010 | £124,210 | -8% |
20 Properties |
| 2009 | £134,713 | -2% |
22 Properties |
| 2008 | £137,838 | -9% |
26 Properties |
| 2007 | £150,003 | 5% |
68 Properties |
| 2006 | £142,557 | -6% |
49 Properties |
| 2005 | £151,216 | 14% |
33 Properties |
| 2004 | £130,486 | 12% |
34 Properties |
| 2003 | £114,458 | 29% |
39 Properties |
| 2002 | £81,175 | 14% |
49 Properties |
| 2001 | £69,646 | 8% |
53 Properties |
| 2000 | £64,092 | 13% |
57 Properties |
| 1999 | £56,052 | -5% |
58 Properties |
| 1998 | £58,924 | 7% |
49 Properties |
| 1997 | £54,772 | 7% |
58 Properties |
| 1996 | £50,973 | 2% |
43 Properties |
| 1995 | £50,130 | - |
49 Properties |
Property Price per Property Type in Burntwood Central
Here you can find historic sold price data in order to help with your property search.
The average Property Paid Price for specific property types in the last three years are:
| Property Type | Average Sold Price | Sold Properties |
|---|---|---|
| Semi Detached House | £245,727.00 | 83 Semi Detached Houses |
| Detached House | £271,625.00 | 36 Detached Houses |
| Terraced House | £228,673.00 | 39 Terraced Houses |
| Flat | £140,000.00 | 1 Flat |

