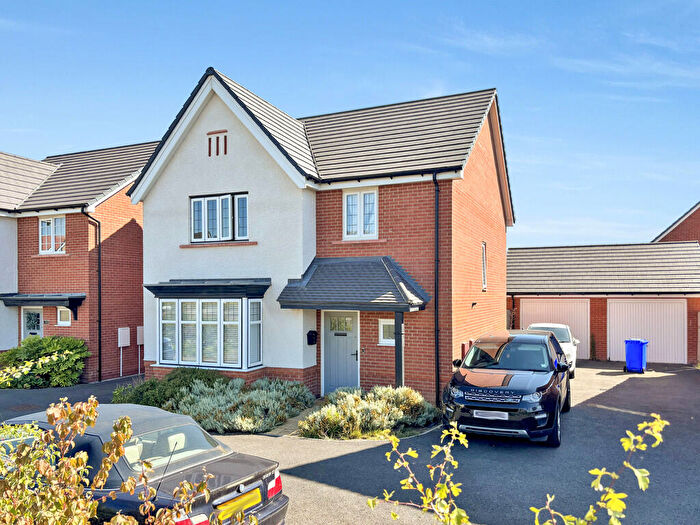
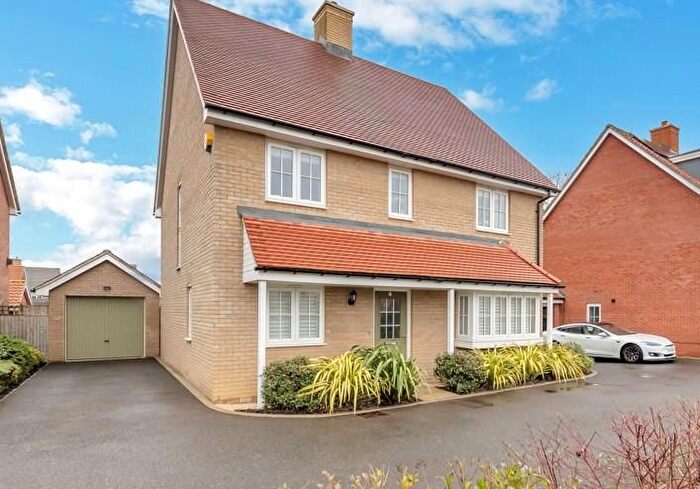
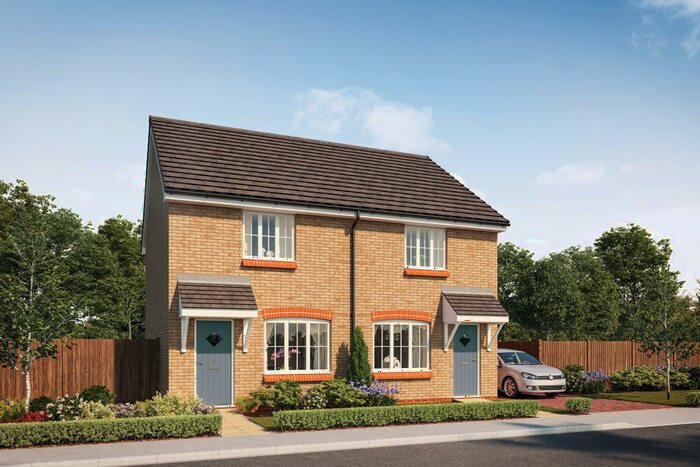
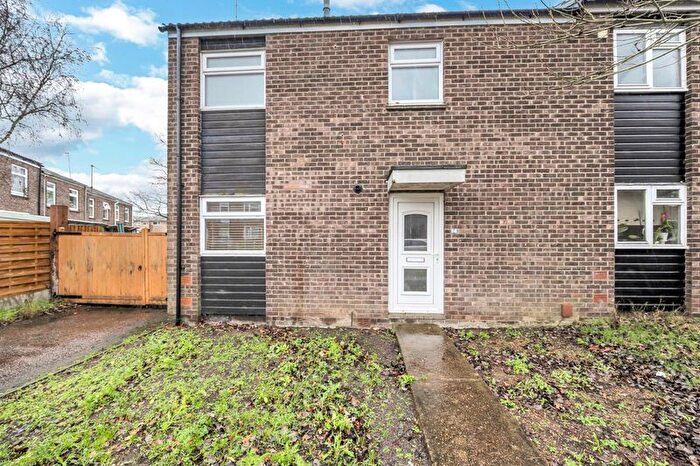
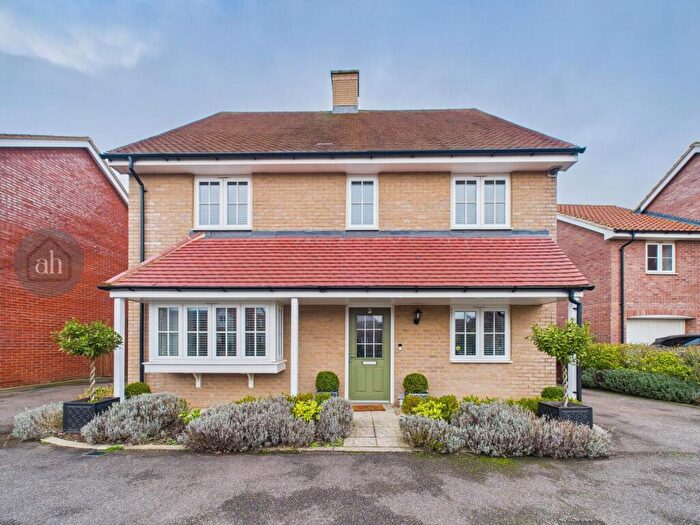
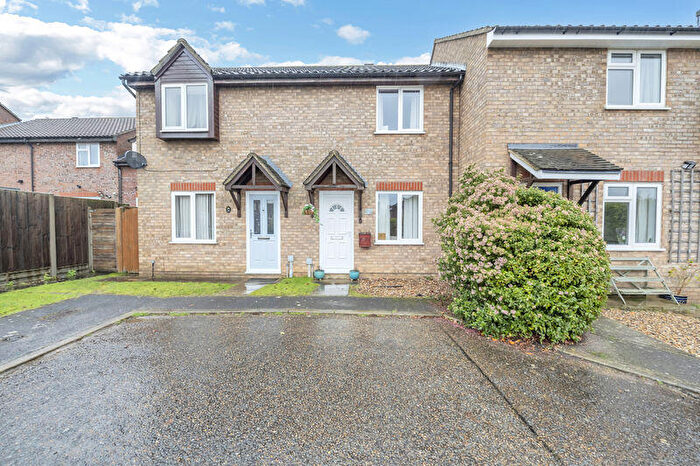
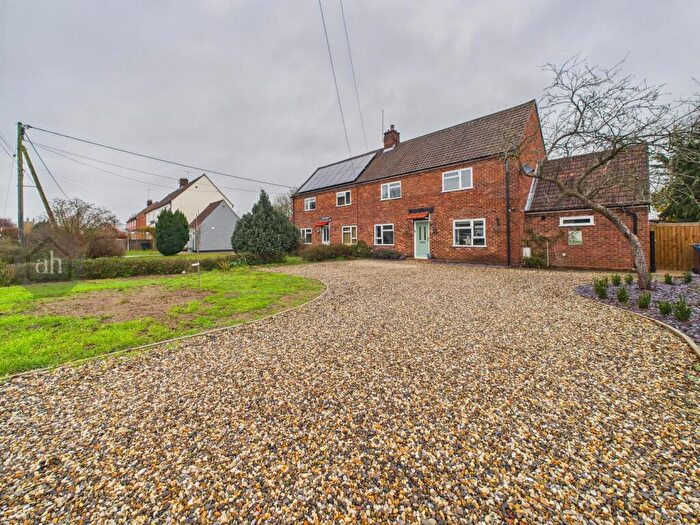
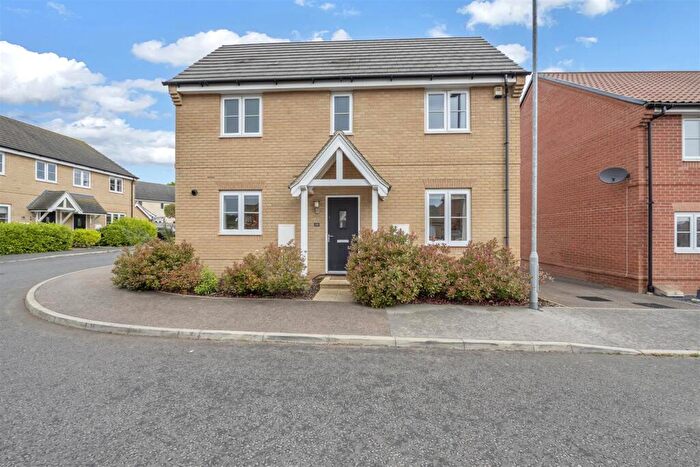
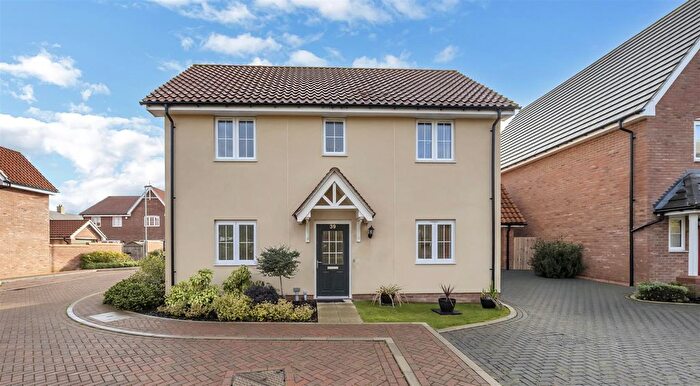
Houses for sale & to rent in Fornham, Bury St Edmunds
House Prices in Fornham
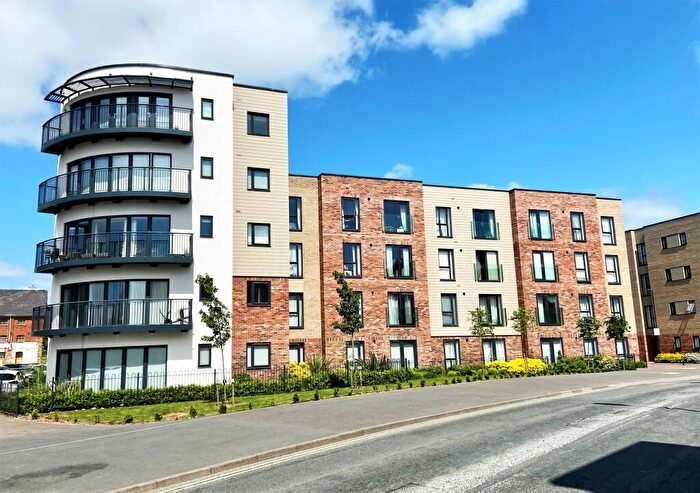
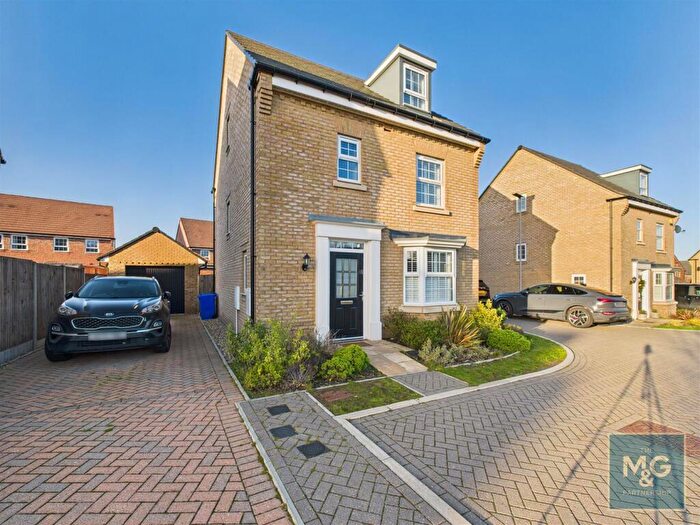
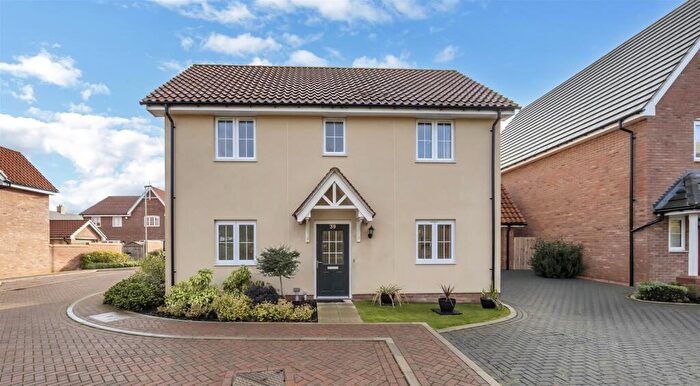
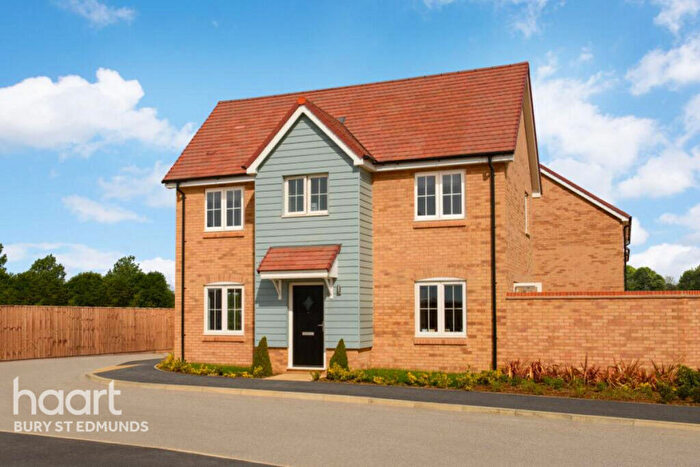
Properties in Fornham have an average house price of £438,007.00 and had 68 Property Transactions within the last 3 years¹.
Fornham is an area in Bury St Edmunds, Suffolk with 821 households², where the most expensive property was sold for £1,450,000.00.
Properties for sale in Fornham
Roads and Postcodes in Fornham
Navigate through our locations to find the location of your next house in Fornham, Bury St Edmunds for sale or to rent.
| Streets | Postcodes |
|---|---|
| Aldridge Lane | IP28 6JT |
| Barton Hill | IP31 1SN |
| Birkdale Court | IP28 6XF |
| Carnoustie Drive | IP28 6UU |
| Chestnut Close | IP28 6LH |
| Church Close | IP31 1ST |
| Culford Road | IP28 6TN |
| Dairy Drive | IP28 6LN |
| Forge End | IP28 6JS |
| Fornham House Close | IP31 1SY |
| Fornham Park | IP28 6JH IP28 6JF IP28 6TT |
| Fulford Close | IP28 6UP |
| Gilstrap Road | IP31 1TD |
| Gleneagles Close | IP28 6XA |
| Golton Cottages | IP28 6JN |
| Hengrave Road | IP28 6LA |
| Hoylake Close | IP28 6XB |
| Kytson Road | IP31 1TF |
| Lark Valley Drive | IP28 6UG IP28 6UF IP28 6UQ |
| Larks Gate | IP28 6HY |
| Manners Road | IP31 1TE |
| Northern Way | IP32 6NL |
| Oak Close | IP28 6BY |
| Oak Grove | IP31 1TH |
| Old Hall Lane | IP31 1SS |
| Ord Road | IP31 1TB |
| Park Avenue | IP28 6TW |
| Parklands Green | IP28 6UH |
| Pigeon Lane | IP28 6JP |
| Pound Meadow | IP28 6JL |
| Rectory Meadow | IP28 6JR |
| Russell Baron Road | IP31 1TA |
| School Lane | IP31 1SP |
| South Lodge Drive | IP28 6TQ |
| St Andrews Drive | IP28 6TR |
| The Drift | IP31 1SU |
| The Green | IP28 6JX |
| The Street | IP28 6JW IP31 1SW |
| Troon Court | IP28 6TJ |
| Turnberry Drive | IP28 6TP |
| Tut Hill | IP28 6LE IP28 6LF IP28 6LG IP28 6LD |
| Wentworth Close | IP28 6XE |
| IP28 6DX IP28 6JY IP28 6JJ IP31 1SR |
Transport near Fornham
- FAQ
- Price Paid By Year
- Property Type Price
Frequently asked questions about Fornham
What is the average price for a property for sale in Fornham?
The average price for a property for sale in Fornham is £438,007. This amount is 25% higher than the average price in Bury St Edmunds. There are 1,070 property listings for sale in Fornham.
What streets have the most expensive properties for sale in Fornham?
The streets with the most expensive properties for sale in Fornham are The Street at an average of £605,833, Turnberry Drive at an average of £585,000 and Fornham Park at an average of £557,200.
What streets have the most affordable properties for sale in Fornham?
The streets with the most affordable properties for sale in Fornham are Oak Close at an average of £121,375, Barton Hill at an average of £266,500 and School Lane at an average of £267,000.
Which train stations are available in or near Fornham?
Some of the train stations available in or near Fornham are Bury St.Edmunds, Thurston and Kennett.
Property Price Paid in Fornham by Year
The average sold property price by year was:
| Year | Average Sold Price | Price Change |
Sold Properties
|
|---|---|---|---|
| 2025 | £382,947 | -23% |
19 Properties |
| 2024 | £472,452 | 5% |
21 Properties |
| 2023 | £449,535 | -3% |
28 Properties |
| 2022 | £462,239 | 11% |
30 Properties |
| 2021 | £411,934 | -12% |
23 Properties |
| 2020 | £461,298 | 9% |
25 Properties |
| 2019 | £420,293 | 18% |
22 Properties |
| 2018 | £343,843 | -3% |
32 Properties |
| 2017 | £355,072 | -1% |
29 Properties |
| 2016 | £360,272 | 19% |
22 Properties |
| 2015 | £292,895 | -21% |
31 Properties |
| 2014 | £355,824 | 7% |
36 Properties |
| 2013 | £331,888 | 7% |
27 Properties |
| 2012 | £309,142 | 4% |
26 Properties |
| 2011 | £296,642 | 15% |
14 Properties |
| 2010 | £251,035 | 12% |
27 Properties |
| 2009 | £220,849 | -39% |
30 Properties |
| 2008 | £305,921 | -17% |
14 Properties |
| 2007 | £357,404 | 36% |
32 Properties |
| 2006 | £228,011 | -2% |
37 Properties |
| 2005 | £233,017 | 5% |
40 Properties |
| 2004 | £221,994 | 19% |
32 Properties |
| 2003 | £178,724 | -9% |
29 Properties |
| 2002 | £194,044 | 6% |
36 Properties |
| 2001 | £183,201 | 25% |
48 Properties |
| 2000 | £137,478 | 23% |
44 Properties |
| 1999 | £106,222 | 3% |
31 Properties |
| 1998 | £102,569 | 6% |
33 Properties |
| 1997 | £96,884 | 15% |
42 Properties |
| 1996 | £82,156 | -13% |
38 Properties |
| 1995 | £93,026 | - |
22 Properties |
Property Price per Property Type in Fornham
Here you can find historic sold price data in order to help with your property search.
The average Property Paid Price for specific property types in the last three years are:
| Property Type | Average Sold Price | Sold Properties |
|---|---|---|
| Semi Detached House | £324,895.00 | 24 Semi Detached Houses |
| Detached House | £547,434.00 | 38 Detached Houses |
| Terraced House | £262,500.00 | 4 Terraced Houses |
| Flat | £67,250.00 | 2 Flats |

