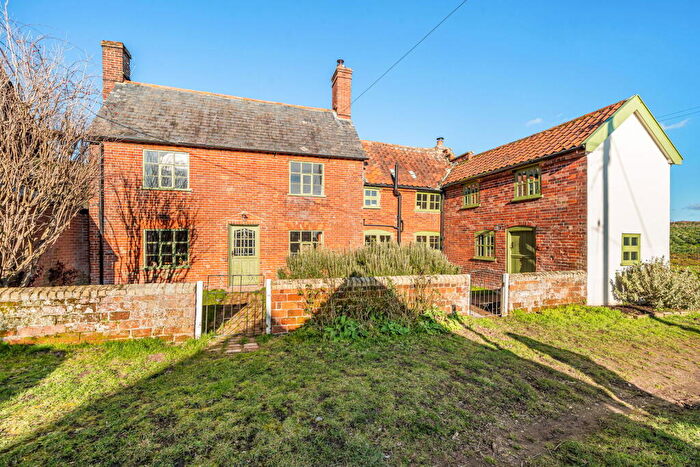
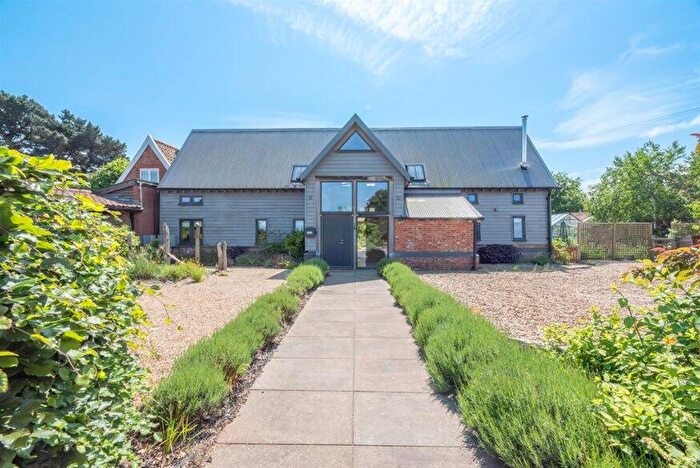
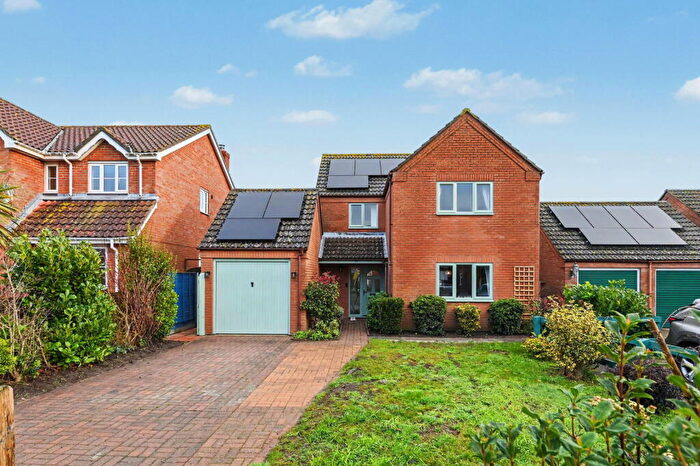
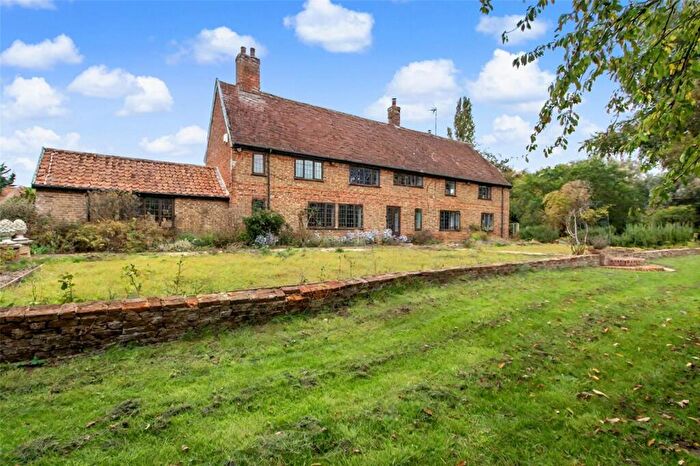
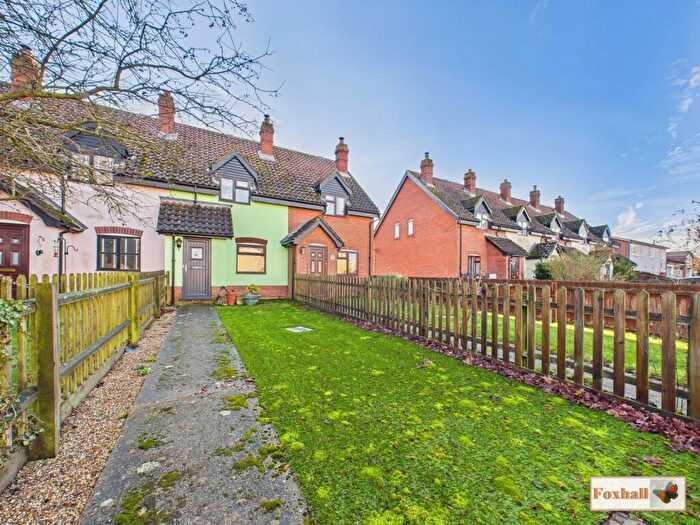
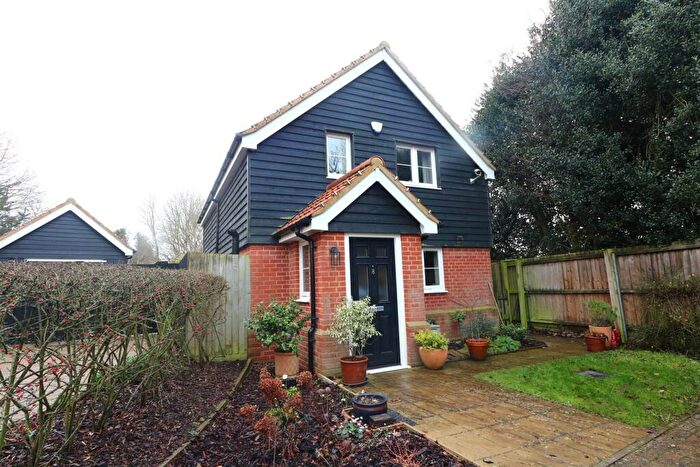
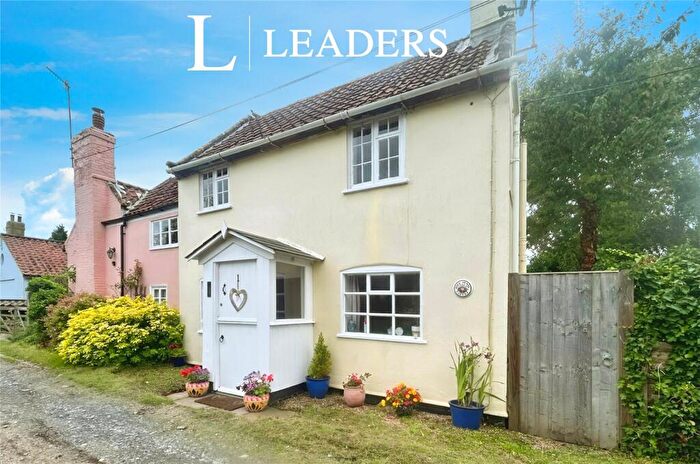
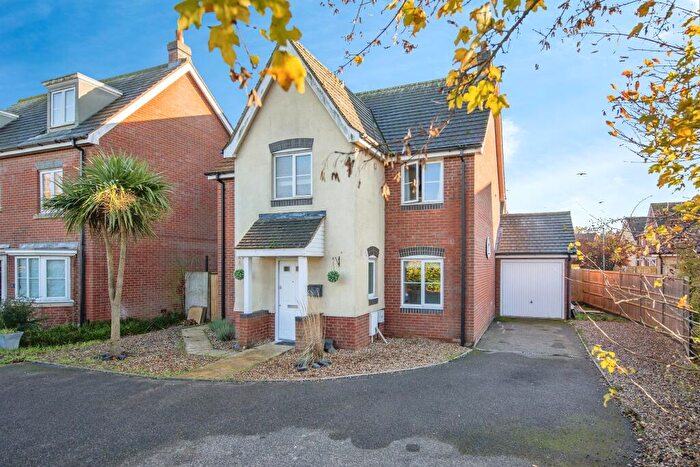
Houses for sale & to rent in Orford And Tunstall, Woodbridge
House Prices in Orford And Tunstall
Properties in Orford And Tunstall have an average house price of £438,441.00 and had 75 Property Transactions within the last 3 years¹.
Orford And Tunstall is an area in Woodbridge, Suffolk with 704 households², where the most expensive property was sold for £1,338,000.00.
Properties for sale in Orford And Tunstall
Roads and Postcodes in Orford And Tunstall
Navigate through our locations to find the location of your next house in Orford And Tunstall, Woodbridge for sale or to rent.
| Streets | Postcodes |
|---|---|
| Ashe Road | IP12 2HJ IP12 2JB |
| Blacklands Lane | IP12 2AX |
| Blaxhall Church Road | IP12 2DA |
| Broad Street | IP12 2NQ |
| Bullace Lane | IP12 2AU |
| Burnt Lane | IP12 2NJ |
| Castle Close | IP12 2LB |
| Castle Green | IP12 2NF |
| Castle Hill | IP12 2NE |
| Castle Lane | IP12 2LY |
| Castle Terrace | IP12 2ND |
| Castle View | IP12 2NL |
| Chapelfield | IP12 2HW |
| Church Road | IP12 2DH IP12 2DN |
| Church Street | IP12 2LL IP12 2NT |
| Crag Farm Road | IP12 2BN |
| Crown Lane | IP12 2NB |
| Daphne Road | IP12 2NH |
| Duck Lane | IP12 2SN |
| Farnham Road | IP12 2DX |
| Ferry Lane | IP12 2HD |
| Ferry Road | IP12 2BJ IP12 2BP IP12 2BQ IP12 2BS IP12 2NR |
| Front Street | IP12 2LN |
| Gedgrave Road | IP12 2NG |
| Gorse Lane | IP12 2BD |
| Green Man Place | IP12 2HR |
| Heath Cottages | IP12 2HQ |
| Heath Walk | IP12 2EA |
| High Street | IP12 2EY IP12 2NW |
| Hocket Crescent | IP12 2JD |
| Hyde Park Corner | IP12 2AZ |
| Iken Cliff | IP12 2EN |
| Ipswich Road | IP12 2LT |
| Lamberts Lane | IP12 2HB |
| Langham Road | IP12 2EF |
| Market Hill | IP12 2LH IP12 2LQ |
| Meadowlands | IP12 2BB |
| Mill Broadway | IP12 2AB |
| Mill Common | IP12 2ED |
| Mill Lane | IP12 2JS |
| Mundays Lane | IP12 2LX |
| Newlands | IP12 2DJ |
| Newton Broadway | IP12 2AF |
| Nightingale Piece | IP12 2NP |
| Old Barn Cottages | IP12 2DE |
| Old Post Office Lane | IP12 2EB |
| Orford Road | IP12 2JA IP12 2JN IP12 2JW |
| Peacocks Pyghtle | IP12 2HX |
| Potkins Lane | IP12 2SS |
| Pump Street | IP12 2LZ |
| Quay Street | IP12 2NU IP12 2NX |
| Raydon Lane | IP12 2BT |
| Rectory Road | IP12 2DT IP12 2NN |
| Sandy Lane | IP12 2HE IP12 2HF |
| School Hill | IP12 2HN |
| School Lane | IP12 2LU |
| School Road | IP12 2BE IP12 2DZ IP12 2JF IP12 2JQ |
| Ship Cottages | IP12 2DY |
| Snape Road | IP12 2AT IP12 2BA IP12 2JL IP12 2JZ IP12 2LA |
| Station Road | IP12 2DF IP12 2DG |
| Stone Common | IP12 2DP |
| Sudbourne Park | IP12 2AJ |
| Sudbourne Road | IP12 2AD |
| The Close | IP12 2EW |
| The Common | IP12 2JR IP12 2JU |
| Toller Close | IP12 2LR |
| Town Farm Estate | IP12 2LS |
| Tudor Cottages | IP12 2DL |
| Tunstall Green | IP12 2JJ |
| Tunstall Road | IP12 2EP IP12 2ER |
| Woodbridge Road | IP12 2JE |
| IP12 2AY IP12 2EH IP12 2EQ IP12 2EU IP12 2EZ |
Transport near Orford And Tunstall
- FAQ
- Price Paid By Year
- Property Type Price
Frequently asked questions about Orford And Tunstall
What is the average price for a property for sale in Orford And Tunstall?
The average price for a property for sale in Orford And Tunstall is £438,441. This amount is 4% higher than the average price in Woodbridge. There are 546 property listings for sale in Orford And Tunstall.
What streets have the most expensive properties for sale in Orford And Tunstall?
The streets with the most expensive properties for sale in Orford And Tunstall are Raydon Lane at an average of £1,338,000, Chapelfield at an average of £802,750 and Broad Street at an average of £795,000.
What streets have the most affordable properties for sale in Orford And Tunstall?
The streets with the most affordable properties for sale in Orford And Tunstall are Heath Walk at an average of £173,666, Town Farm Estate at an average of £240,000 and Tunstall Green at an average of £278,333.
Which train stations are available in or near Orford And Tunstall?
Some of the train stations available in or near Orford And Tunstall are Wickham Market, Saxmundham and Melton.
Property Price Paid in Orford And Tunstall by Year
The average sold property price by year was:
| Year | Average Sold Price | Price Change |
Sold Properties
|
|---|---|---|---|
| 2025 | £438,630 | 5% |
23 Properties |
| 2024 | £416,239 | -10% |
23 Properties |
| 2023 | £455,900 | 3% |
29 Properties |
| 2022 | £439,964 | -9% |
35 Properties |
| 2021 | £480,045 | -1% |
33 Properties |
| 2020 | £486,328 | 23% |
38 Properties |
| 2019 | £374,454 | -20% |
39 Properties |
| 2018 | £447,613 | -10% |
30 Properties |
| 2017 | £493,988 | 32% |
42 Properties |
| 2016 | £336,128 | -13% |
35 Properties |
| 2015 | £380,113 | -2% |
44 Properties |
| 2014 | £387,885 | -7% |
44 Properties |
| 2013 | £415,151 | 37% |
28 Properties |
| 2012 | £262,343 | -32% |
32 Properties |
| 2011 | £346,868 | -12% |
32 Properties |
| 2010 | £388,862 | 23% |
29 Properties |
| 2009 | £301,036 | -2% |
31 Properties |
| 2008 | £306,726 | -0,5% |
28 Properties |
| 2007 | £308,184 | 0,3% |
37 Properties |
| 2006 | £307,131 | 10% |
42 Properties |
| 2005 | £275,387 | 10% |
27 Properties |
| 2004 | £249,050 | 9% |
48 Properties |
| 2003 | £225,742 | 11% |
43 Properties |
| 2002 | £201,443 | 14% |
42 Properties |
| 2001 | £173,043 | 21% |
49 Properties |
| 2000 | £136,530 | 5% |
39 Properties |
| 1999 | £130,035 | 16% |
55 Properties |
| 1998 | £109,473 | 23% |
56 Properties |
| 1997 | £83,983 | -19% |
41 Properties |
| 1996 | £100,091 | 21% |
39 Properties |
| 1995 | £79,440 | - |
32 Properties |
Property Price per Property Type in Orford And Tunstall
Here you can find historic sold price data in order to help with your property search.
The average Property Paid Price for specific property types in the last three years are:
| Property Type | Average Sold Price | Sold Properties |
|---|---|---|
| Semi Detached House | £426,460.00 | 23 Semi Detached Houses |
| Detached House | £524,758.00 | 31 Detached Houses |
| Terraced House | £319,100.00 | 20 Terraced Houses |
| Flat | £425,000.00 | 1 Flat |

