
Houses for sale in Aldershot, Surrey
House Prices in Aldershot
Properties in Aldershot have an average house price of £415k and had 826 Property Transactions within the last 3 years.¹
Aldershot is an area in Surrey with 7,418 households², where the most expensive property was sold for £2.11M.
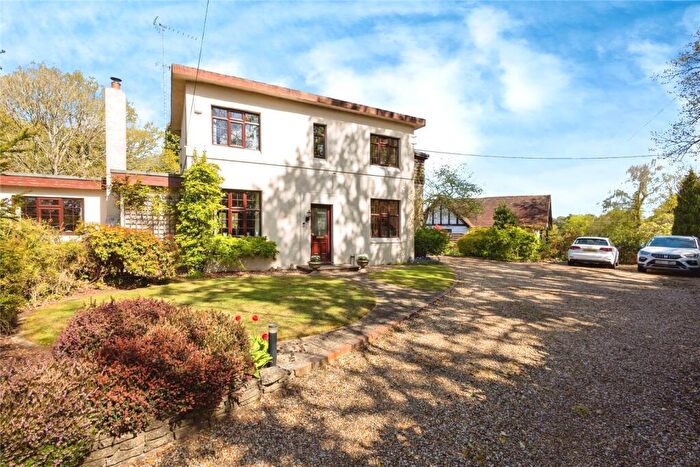
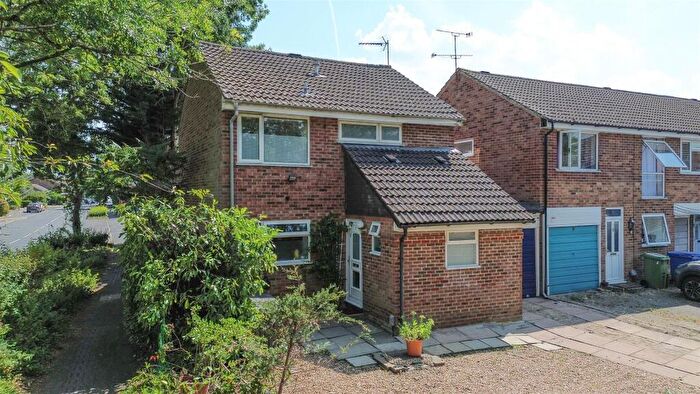
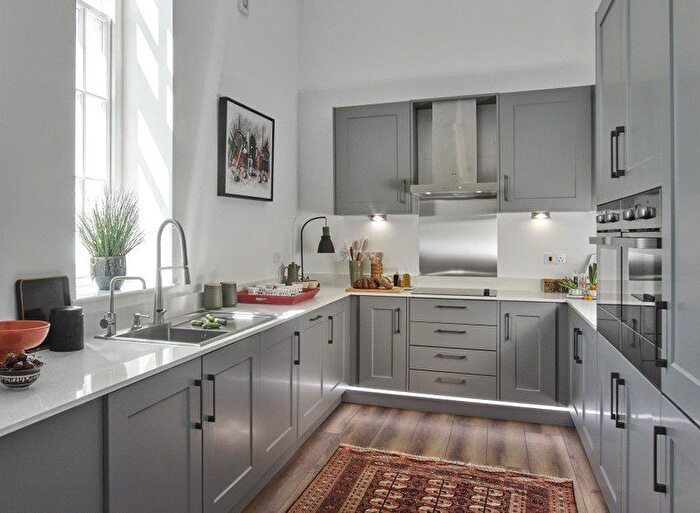
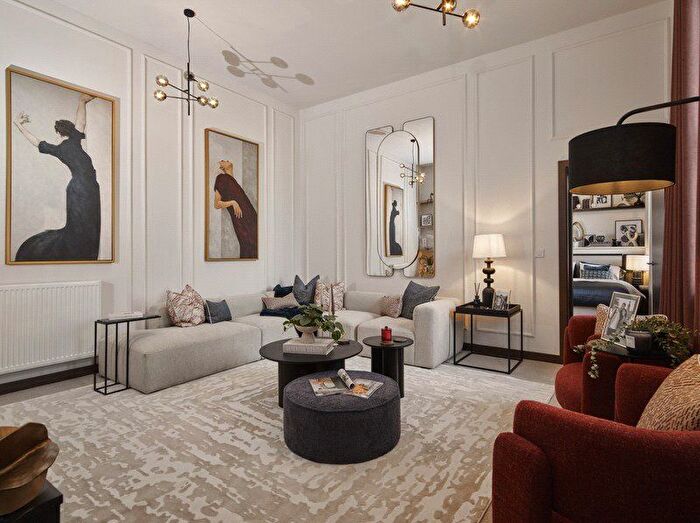
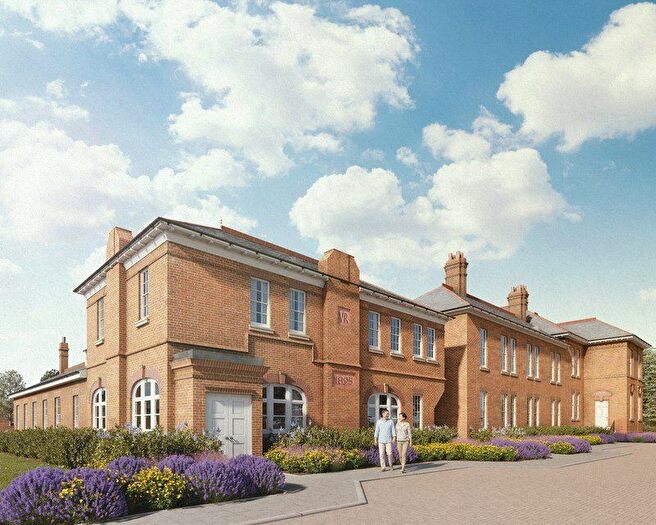
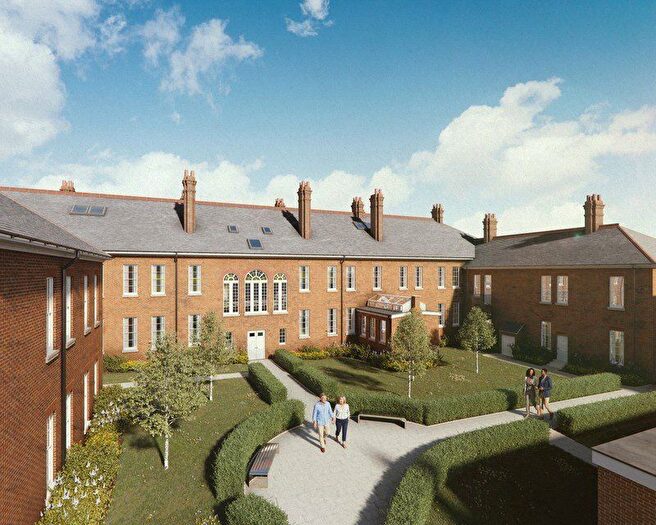
Properties for sale in Aldershot
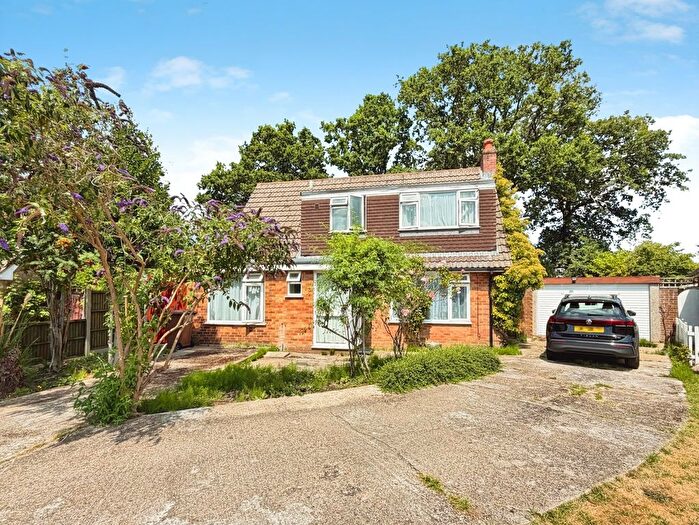
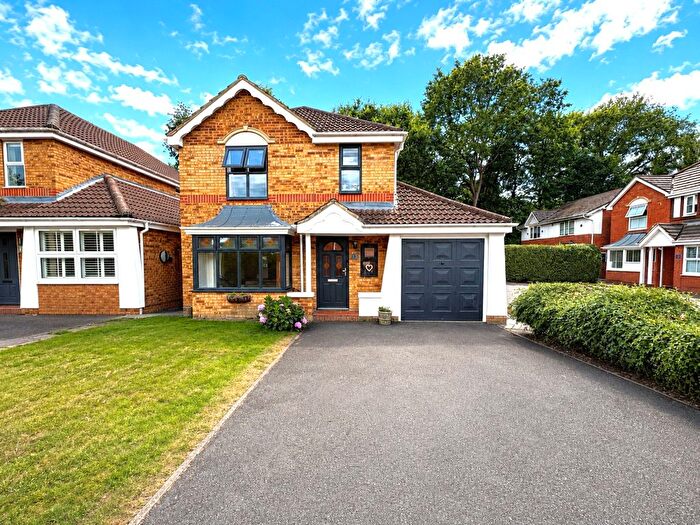
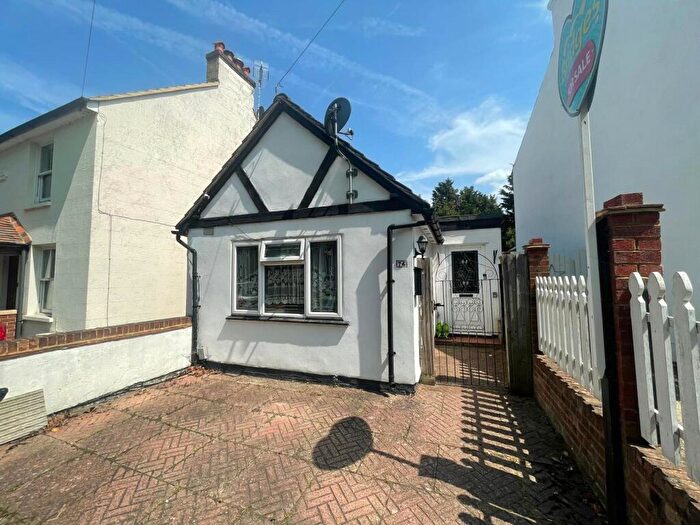
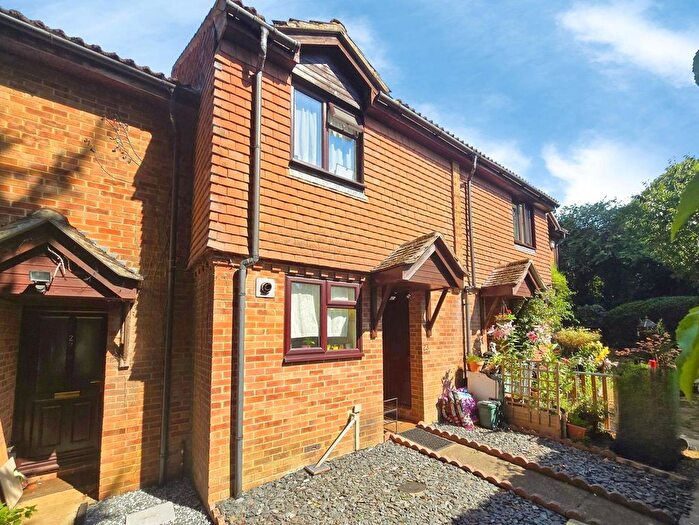
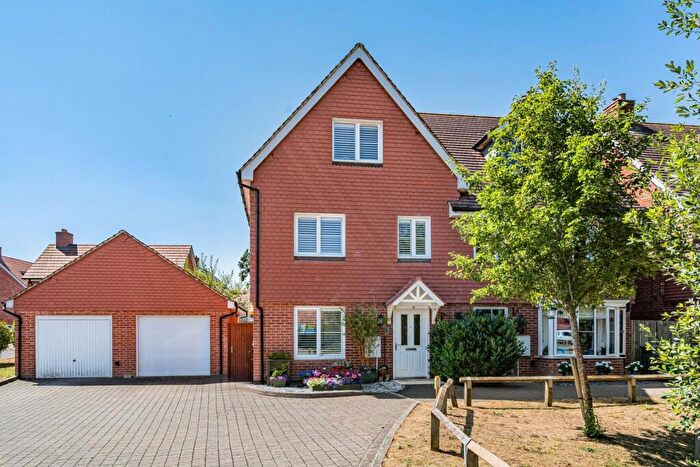
![]()
If you are looking to sell your house, let it out, or receive a property valuation, an expert can help you.
Click the button below to get started.


Neighbourhoods in Aldershot
Navigate through our locations to find the location of your next house in Aldershot, Surrey for sale or to rent.
Property price trends in Aldershot
According to the latest Land Registry data, the average home in Aldershot sold for £414,071 in 2026. That figure comes from a substantial record of 11,545 sales logged over the past 31 years.
Prices have softened over the last three years. Compared with 2023, when the typical sale came in around £421,759, that's a fall of roughly 1.8%.
Looking back five years, average prices are up about 6.1% since 2021, a gain of around £23,643 in cash terms.
Zoom out to the past decade for the fuller picture. Back in 2016, homes here averaged £331,736, so the typical sold price has climbed about 24.8% since then, roughly 2.2% a year. Stretch the view to fifteen years and that annual pace edges up closer to 4%.
Frequently asked questions about Aldershot
What is the average price for a property for sale in Aldershot?
The average price for a property for sale in Aldershot is £415,194. This amount is 32% lower than the average price in Surrey. There are 5,357 property listings for sale in Aldershot.
What locations have the most expensive properties for sale in Aldershot?
The locations with the most expensive properties for sale in Aldershot are Normandy at an average of £599,789, Ash South And Tongham at an average of £450,927 and Mytchett And Deepcut at an average of £427,500.
What locations have the most affordable properties for sale in Aldershot?
The locations with the most affordable properties for sale in Aldershot are Ash Vale at an average of £389,160 and Ash Wharf at an average of £399,191.
Which train stations are available in or near Aldershot?
Some of the train stations available in or near Aldershot are Ash, Ash Vale and North Camp.
Property Price Paid in Aldershot by Year
The average sold property price by year was:
| Year | Average Sold Price | Price Change |
Sold Properties
|
|---|---|---|---|
| 2026 | £414,071 | 1% |
14 Properties |
| 2025 | £409,042 | -2% |
286 Properties |
| 2024 | £415,522 | -2% |
269 Properties |
| 2023 | £421,759 | -0,5% |
257 Properties |
| 2022 | £423,691 | 8% |
329 Properties |
| 2021 | £390,428 | -2% |
459 Properties |
| 2020 | £397,884 | 8% |
303 Properties |
| 2019 | £367,472 | 4% |
313 Properties |
| 2018 | £352,918 | -0,3% |
303 Properties |
| 2017 | £354,082 | 6% |
343 Properties |
Property Price per Property Type in Aldershot
Here you can find historic sold price data in order to help with your property search.
The average Property Paid Price for specific property types in the last three years are:
| Property Type | Average Sold Price | Sold Properties |
|---|---|---|
| Semi Detached House | £419,111.00 | 297 Semi Detached Houses |
| Detached House | £578,754.00 | 211 Detached Houses |
| Terraced House | £337,188.00 | 234 Terraced Houses |
| Flat | £207,804.00 | 84 Flats |
Transport in Aldershot
Please see below transportation links in this area:
