
Houses for sale & to rent in BN43 5DT, Church Street, St Marys, Shoreham-by-sea
House Prices in BN43 5DT, Church Street, St Marys
Properties in BN43 5DT have no sales history available within the last 3 years. BN43 5DT is a postcode in Church Street located in St Marys, an area in Shoreham-by-sea, West Sussex, with 2 households².
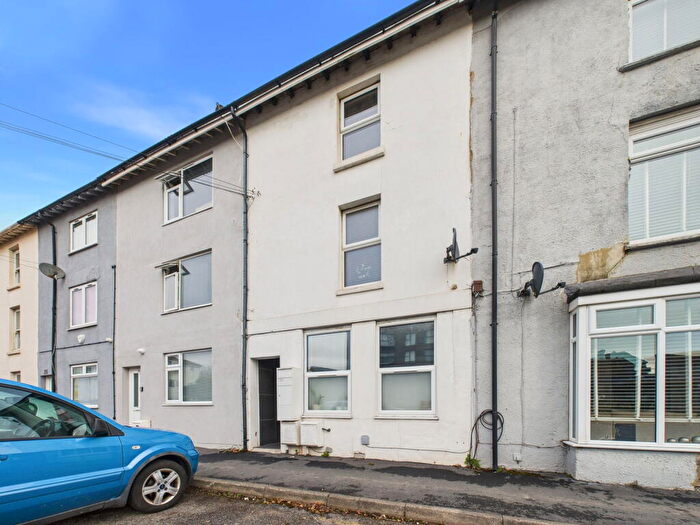
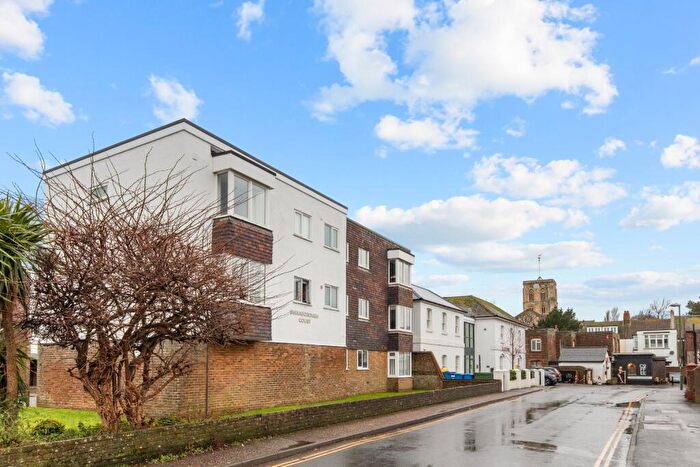
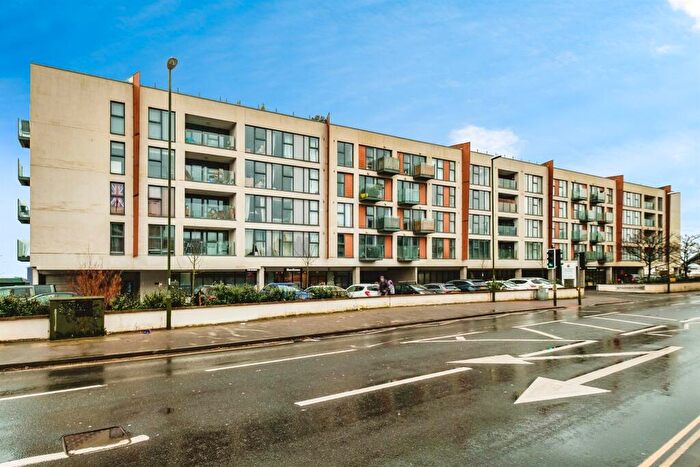
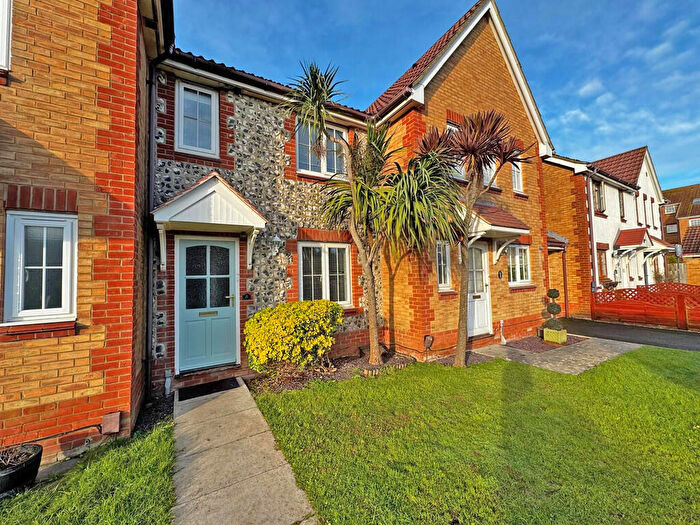
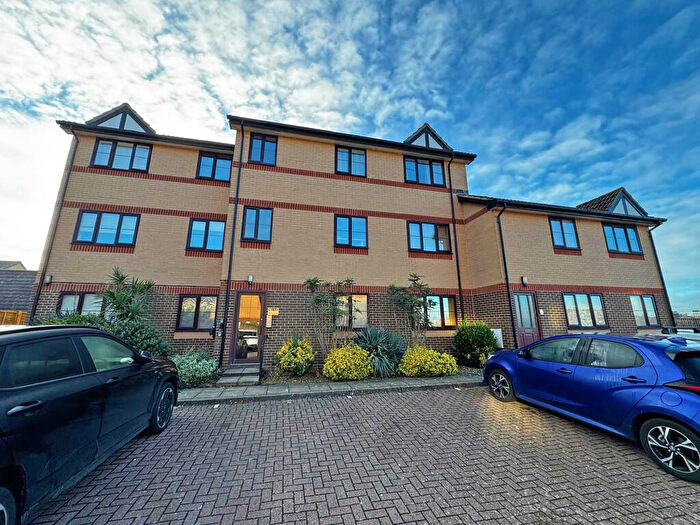
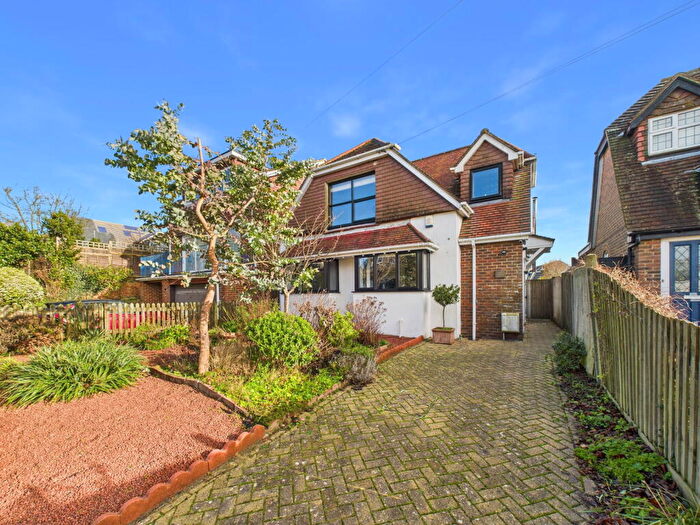
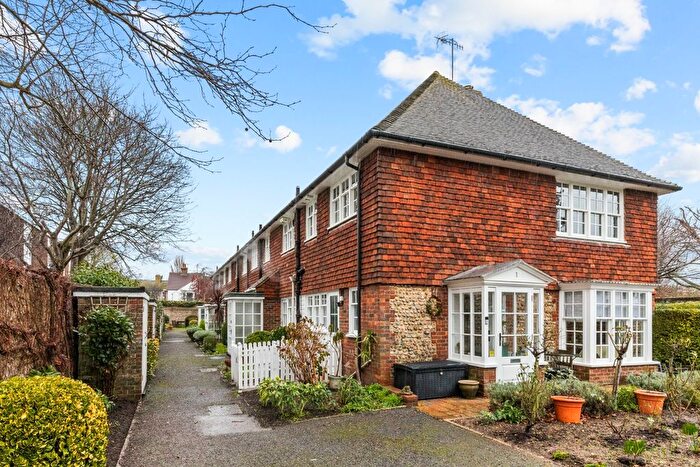
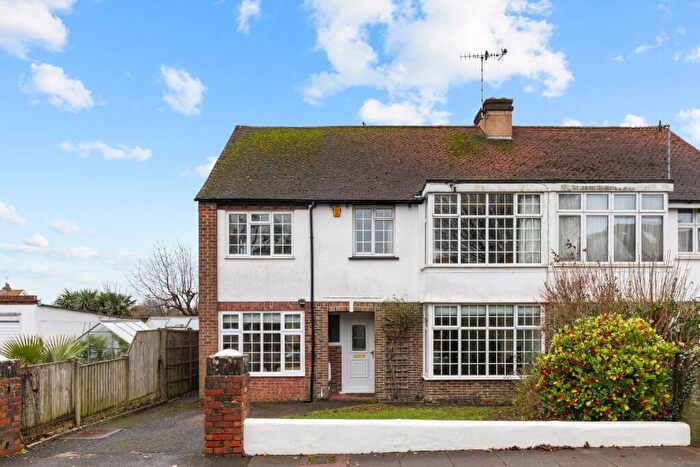
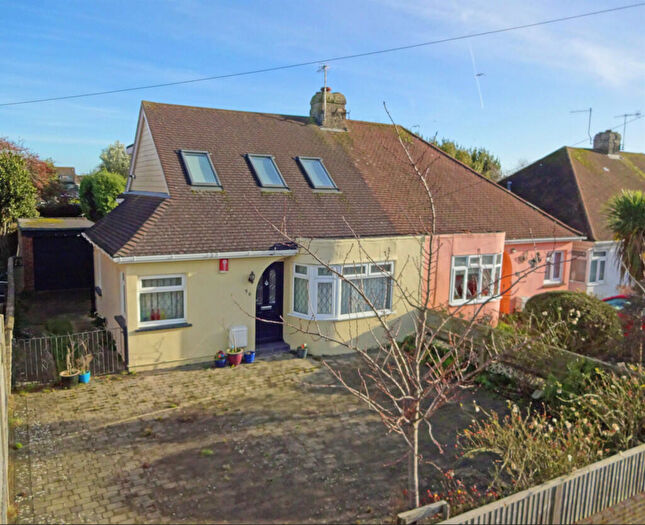
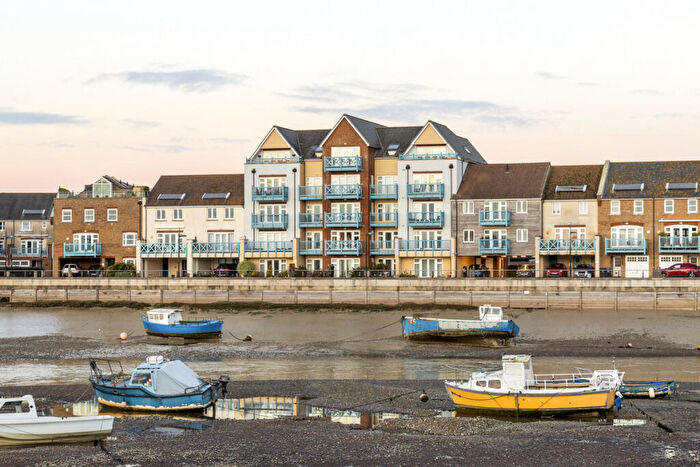
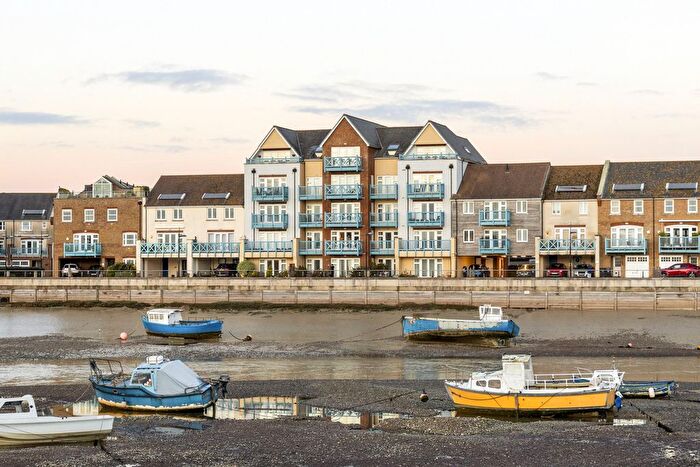
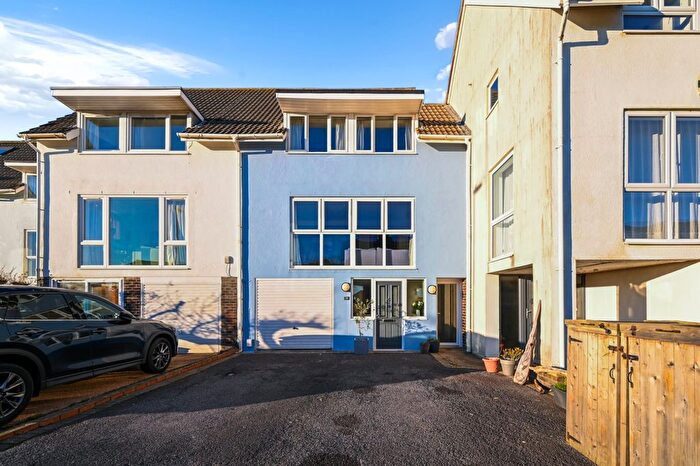
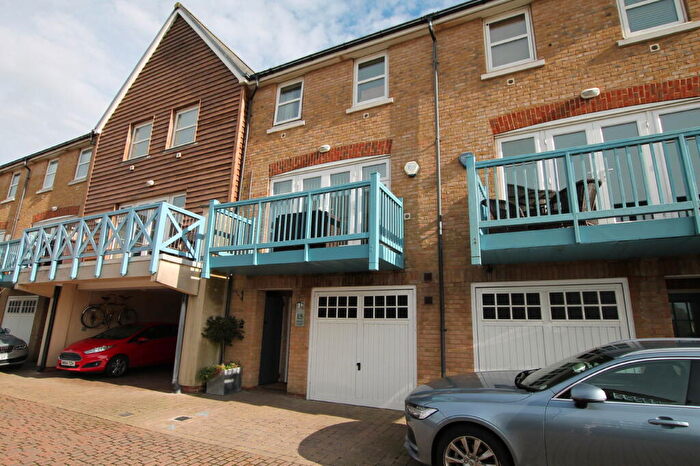
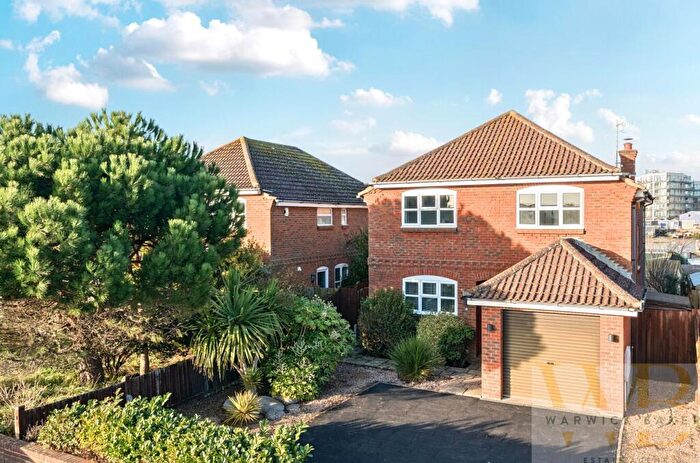
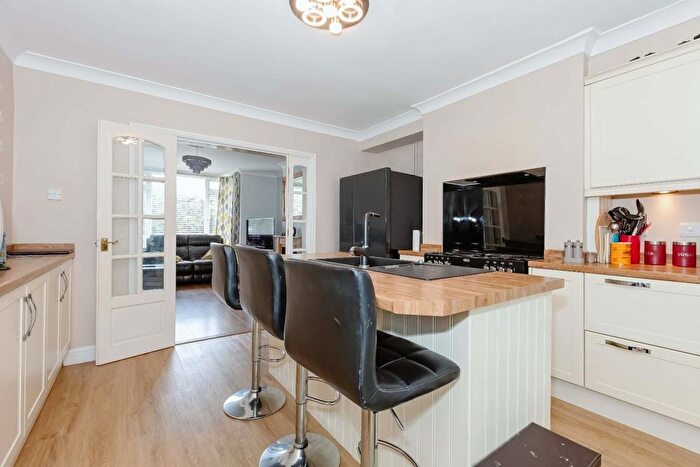
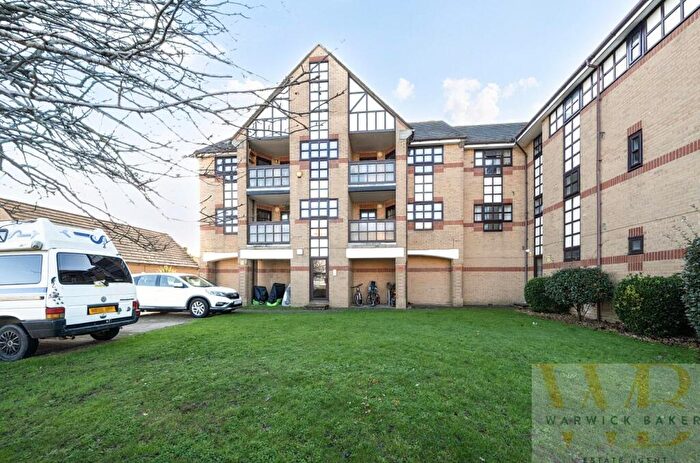
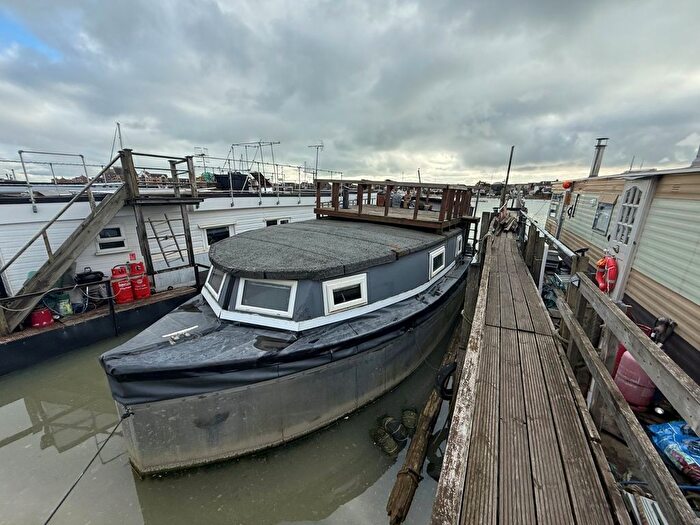
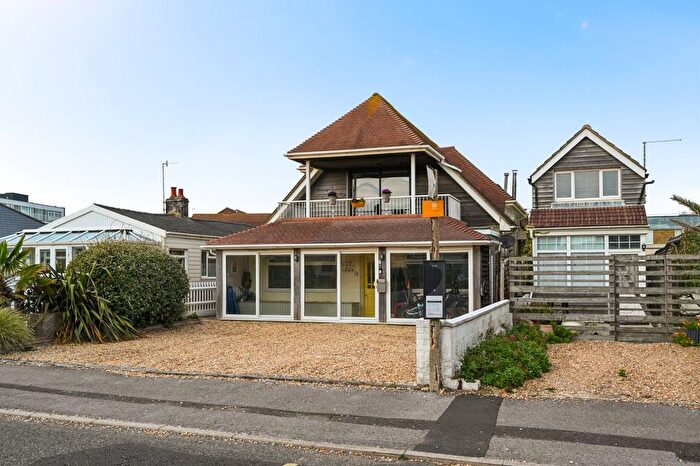
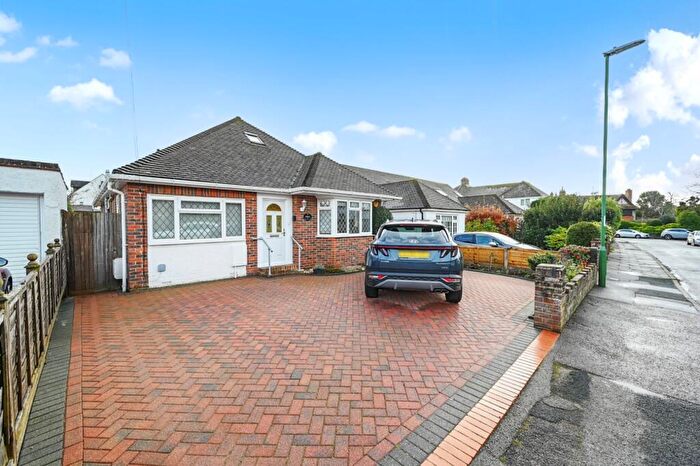
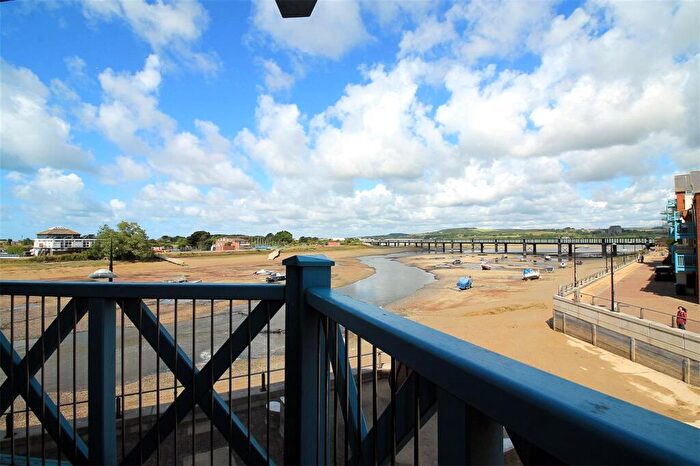
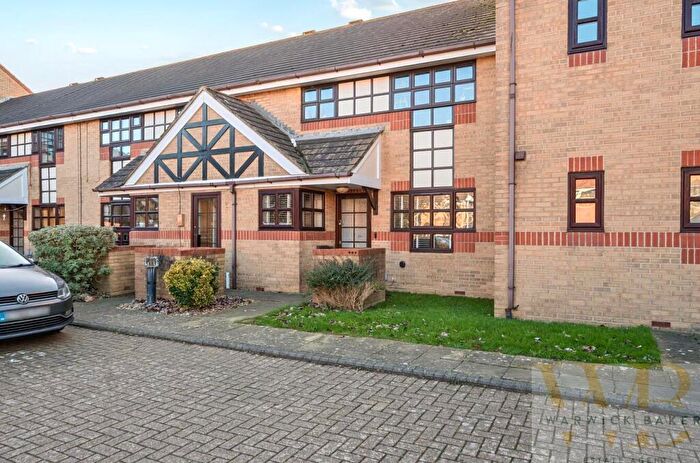
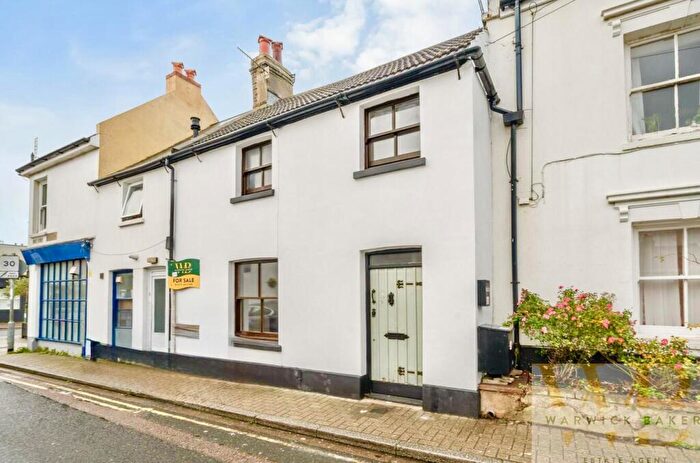
Properties for sale near BN43 5DT, Church Street
![]()
If you are looking to sell your house, let it out, or receive a property valuation, an expert can help you.
Click the button below to get started.

Price Paid in Church Street, BN43 5DT, St Marys
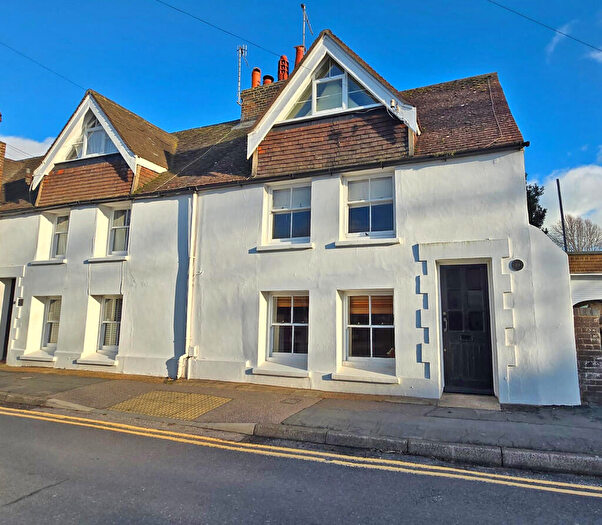
OLD SWAN COTTAGES 1 Church Street, BN43 5DT, St Marys Shoreham-by-sea
Property OLD SWAN COTTAGES 1 has been sold 1 time. The last time it was sold was in 23/06/2017 and the sold price was £575,000.00.
This is a Semi Detached House which was sold as a freehold in 23/06/2017
| Date | Price | Property Type | Tenure | Classification |
|---|---|---|---|---|
| 23/06/2017 | £575,000.00 | Semi Detached House | freehold | Established Building |
OLD SWAN COTTAGES 2 Church Street, BN43 5DT, St Marys Shoreham-by-sea
Property OLD SWAN COTTAGES 2 has been sold 2 times. The last time it was sold was in 20/06/2003 and the sold price was £149,950.00.
This is a Semi Detached House which was sold as a freehold in 20/06/2003
| Date | Price | Property Type | Tenure | Classification |
|---|---|---|---|---|
| 20/06/2003 | £149,950.00 | Semi Detached House | freehold | Established Building |
| 24/09/1999 | £65,000.00 | Semi Detached House | freehold | Established Building |
2 Old Swan Cottages Church Street, BN43 5DT, St Marys Shoreham-by-sea
This is a 50 square meter Semi-detached House with an EPC rating of F. Currently, there is no transaction history available for this property.
Postcodes in Church Street, St Marys
Navigate through other locations in Church Street, St Marys, Shoreham-by-sea to see more property listings for sale or to rent.
Transport near BN43 5DT, Church Street

House price paid reports for BN43 5DT, Church Street
Click on the buttons below to see price paid reports by year or property price:
- Price Paid By Year
Property Price Paid in BN43 5DT, Church Street by Year
The average sold property price by year was:
| Year | Average Sold Price | Price Change |
Sold Properties
|
|---|---|---|---|
| 2017 | £575,000 | 74% |
1 Property |
| 2003 | £149,950 | 57% |
1 Property |
| 1999 | £65,000 | - |
1 Property |