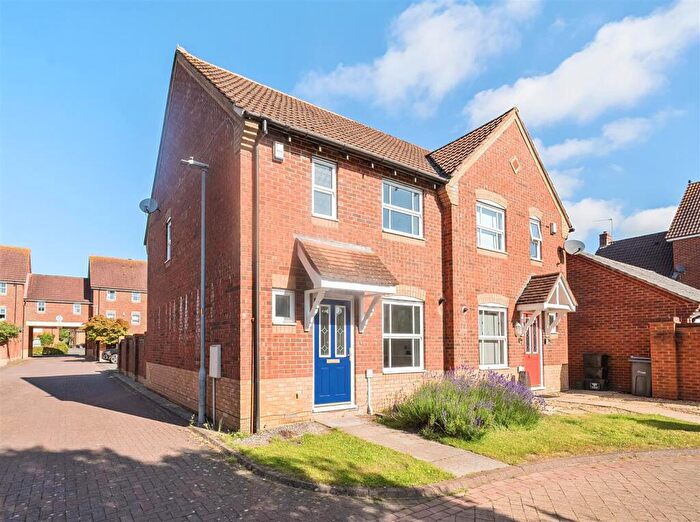
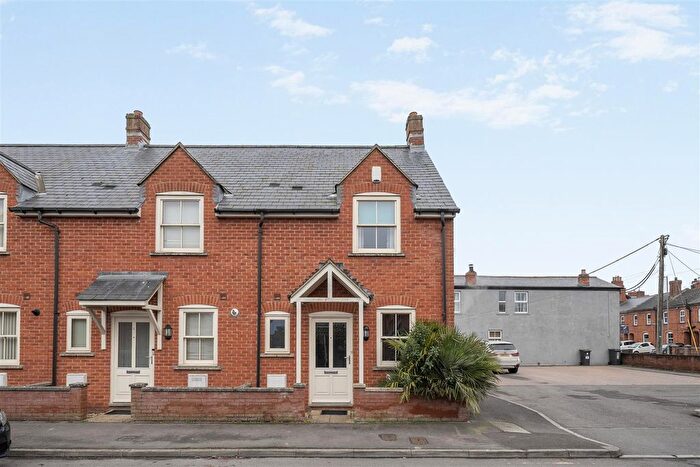
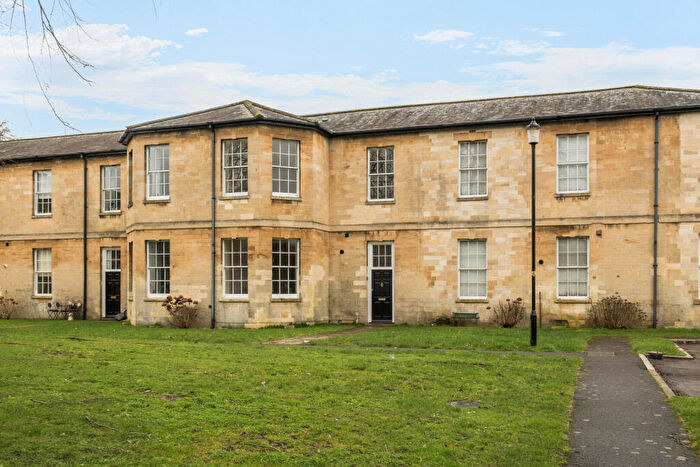
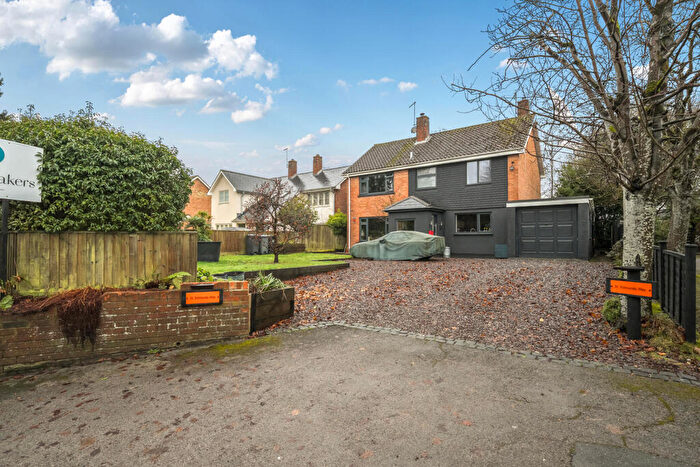
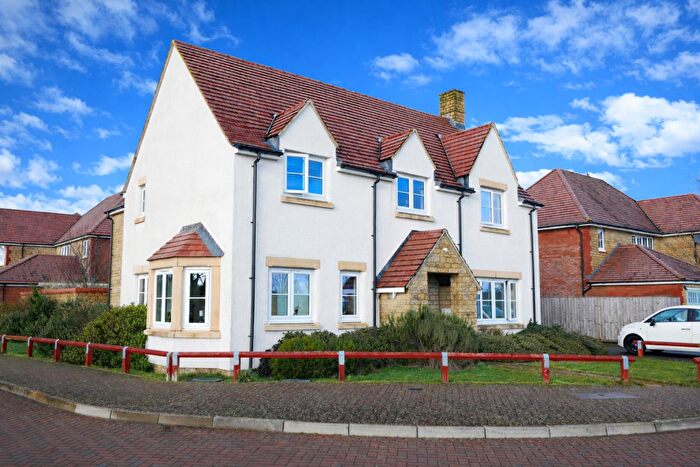
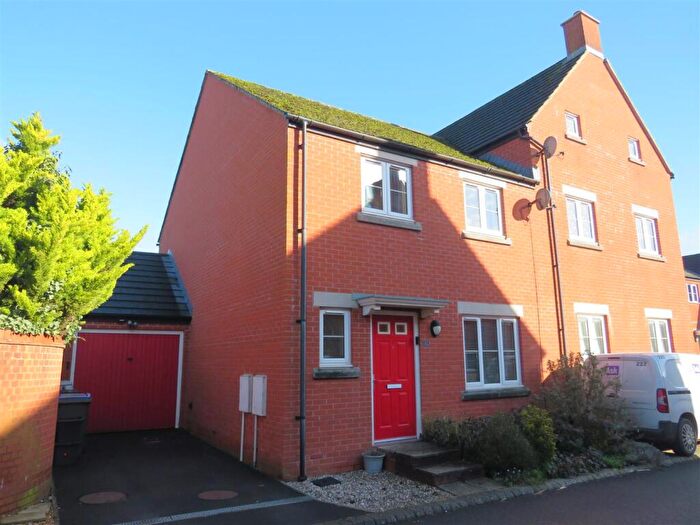
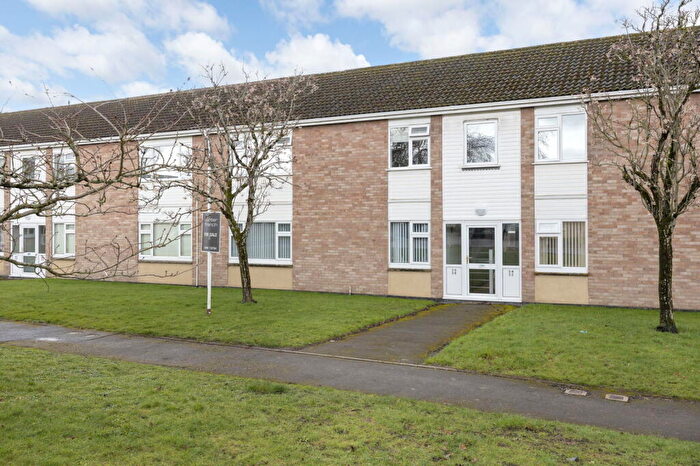
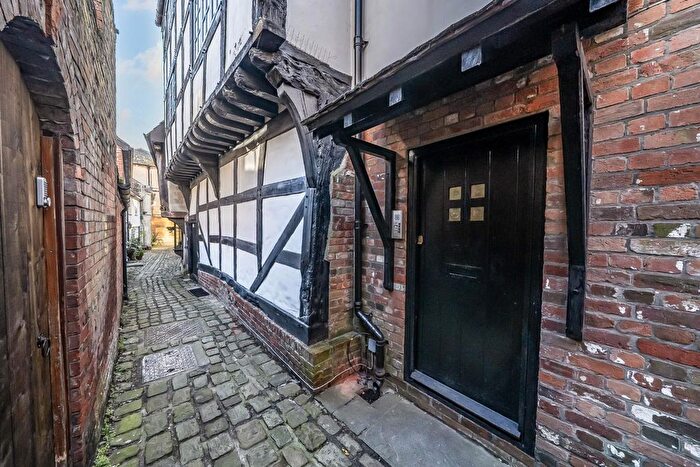
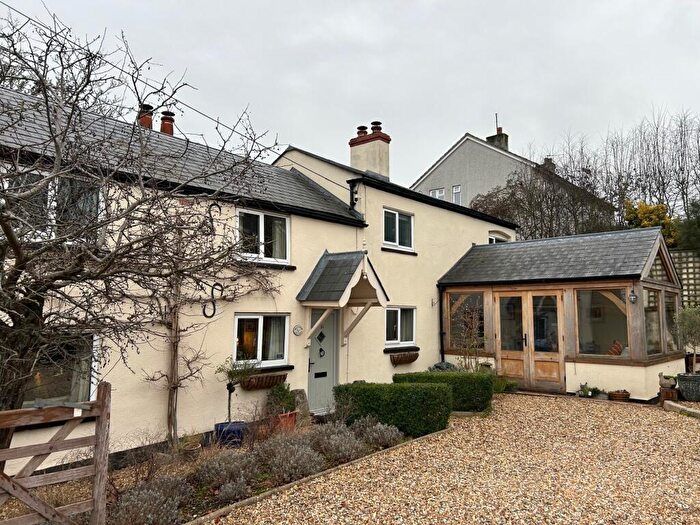
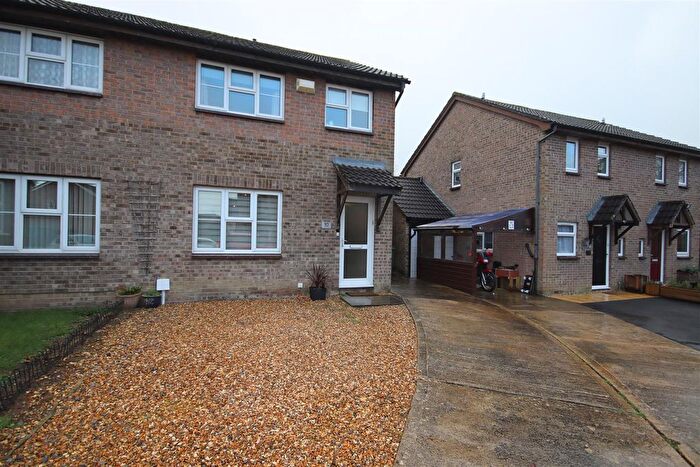
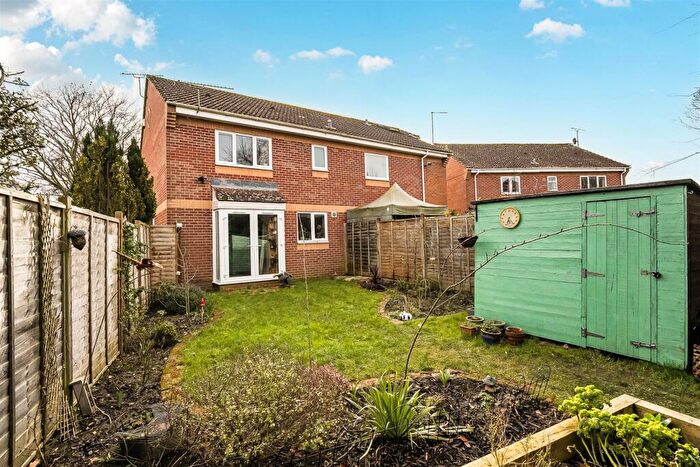
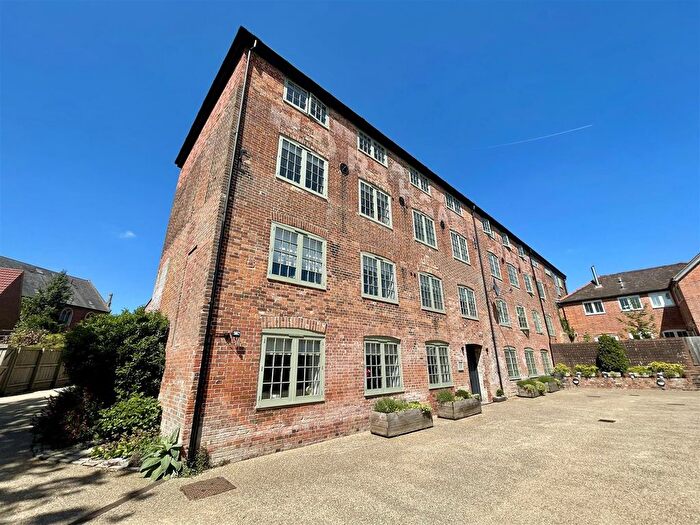
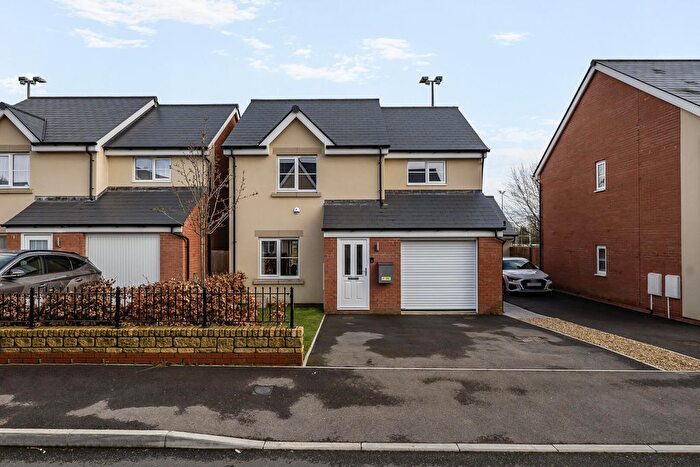
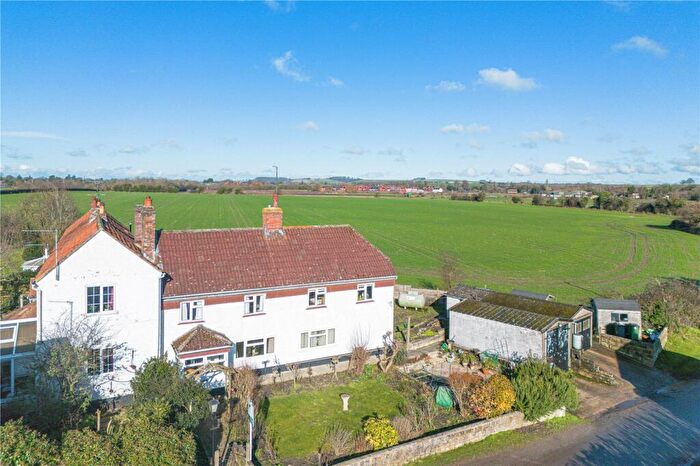
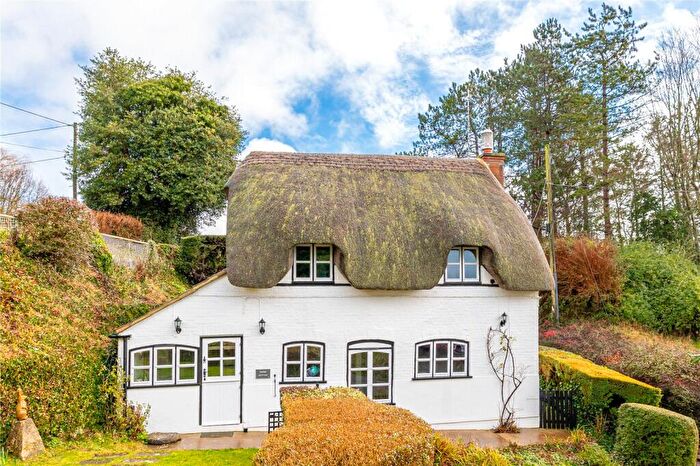
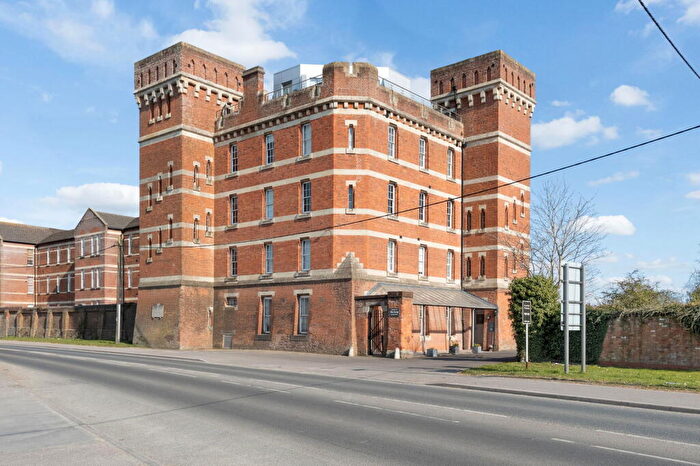
Houses for sale & to rent in Devizes, Wiltshire
House Prices in Devizes
Properties in Devizes have an average house price of £339,348.00 and had 1,342 Property Transactions within the last 3 years.¹
Devizes is an area in Wiltshire with 13,298 households², where the most expensive property was sold for £1,800,000.00.
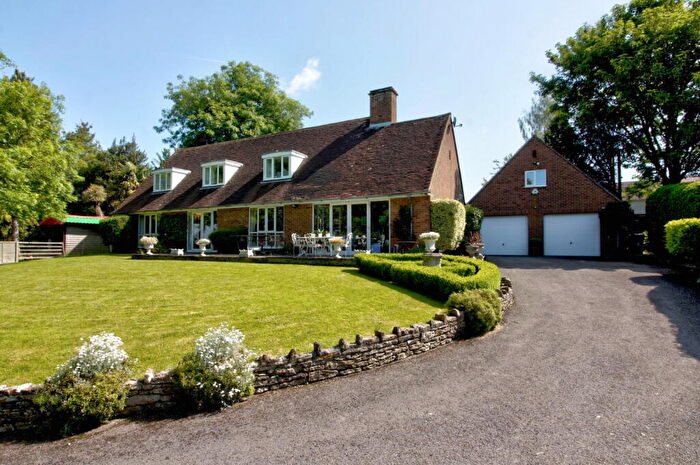
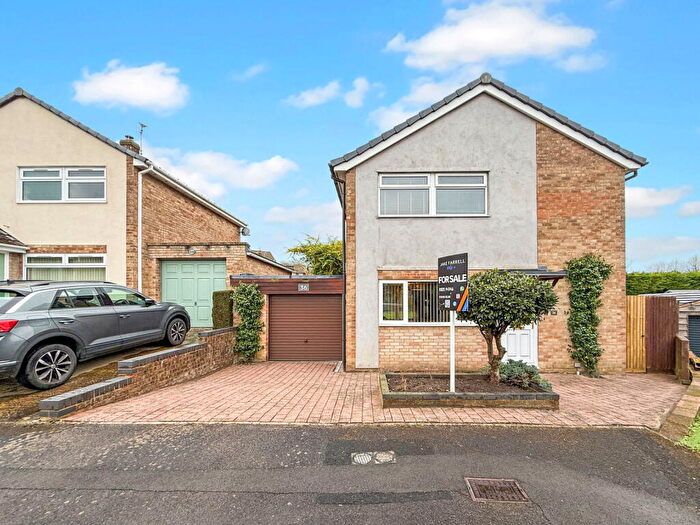
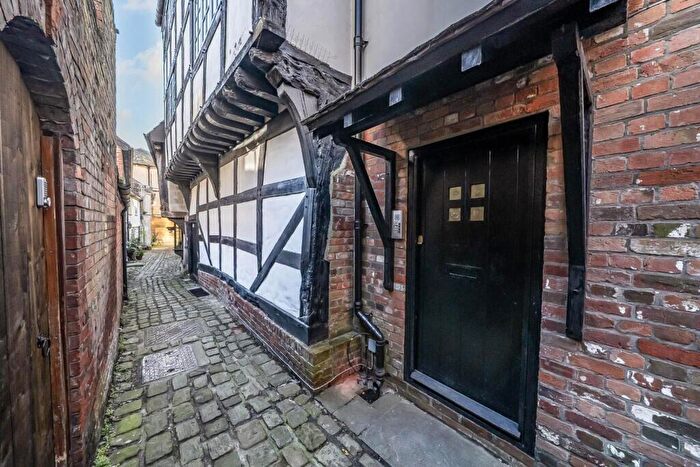
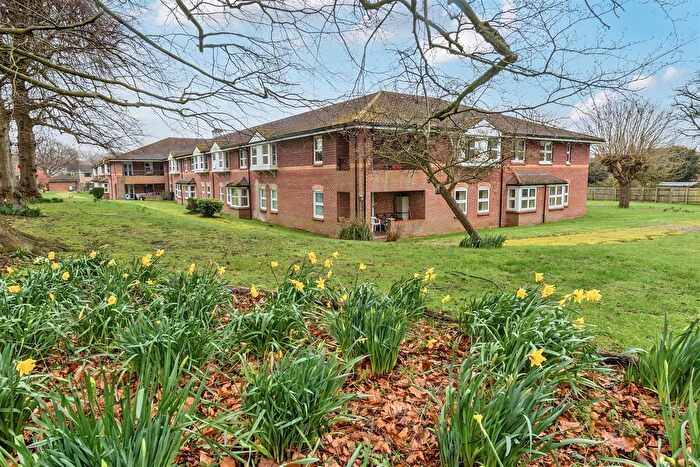
Properties for sale in Devizes
Neighbourhoods in Devizes
Navigate through our locations to find the location of your next house in Devizes, Wiltshire for sale or to rent.
Transport in Devizes
Please see below transportation links in this area:
- FAQ
- Price Paid By Year
- Property Type Price
Frequently asked questions about Devizes
What is the average price for a property for sale in Devizes?
The average price for a property for sale in Devizes is £339,348. This amount is 7% lower than the average price in Wiltshire. There are 8,390 property listings for sale in Devizes.
What locations have the most expensive properties for sale in Devizes?
The locations with the most expensive properties for sale in Devizes are Summerham And Seend at an average of £510,952, Urchfont And The Cannings at an average of £449,013 and The Lavingtons And Erlestoke at an average of £375,986.
What locations have the most affordable properties for sale in Devizes?
The locations with the most affordable properties for sale in Devizes are Devizes North at an average of £254,165, Devizes East at an average of £273,728 and Roundway at an average of £292,860.
Which train stations are available in or near Devizes?
Some of the train stations available in or near Devizes are Melksham, Pewsey and Trowbridge.
Property Price Paid in Devizes by Year
The average sold property price by year was:
| Year | Average Sold Price | Price Change |
Sold Properties
|
|---|---|---|---|
| 2025 | £342,826 | -1% |
427 Properties |
| 2024 | £344,979 | 4% |
474 Properties |
| 2023 | £329,927 | -7% |
441 Properties |
| 2022 | £353,834 | 6% |
567 Properties |
| 2021 | £331,191 | 6% |
748 Properties |
| 2020 | £310,128 | 6% |
535 Properties |
| 2019 | £292,141 | -3% |
654 Properties |
| 2018 | £301,841 | 3% |
505 Properties |
| 2017 | £291,657 | 10% |
583 Properties |
| 2016 | £263,062 | -3% |
574 Properties |
| 2015 | £269,781 | 11% |
576 Properties |
| 2014 | £238,992 | 3% |
632 Properties |
| 2013 | £231,339 | 4% |
500 Properties |
| 2012 | £221,204 | -4% |
445 Properties |
| 2011 | £229,412 | 3% |
516 Properties |
| 2010 | £222,374 | 6% |
462 Properties |
| 2009 | £209,835 | -10% |
445 Properties |
| 2008 | £230,736 | 1% |
456 Properties |
| 2007 | £227,569 | 0,3% |
757 Properties |
| 2006 | £226,878 | 6% |
712 Properties |
| 2005 | £213,874 | 6% |
583 Properties |
| 2004 | £200,411 | 6% |
703 Properties |
| 2003 | £187,519 | 12% |
693 Properties |
| 2002 | £165,050 | 16% |
749 Properties |
| 2001 | £138,075 | 12% |
621 Properties |
| 2000 | £121,082 | 13% |
578 Properties |
| 1999 | £105,345 | 11% |
697 Properties |
| 1998 | £94,204 | 8% |
618 Properties |
| 1997 | £86,848 | 19% |
577 Properties |
| 1996 | £70,440 | - |
620 Properties |
| 1995 | £70,416 | - |
487 Properties |
Property Price per Property Type in Devizes
Here you can find historic sold price data in order to help with your property search.
The average Property Paid Price for specific property types in the last three years are:
| Property Type | Average Sold Price | Sold Properties |
|---|---|---|
| Semi Detached House | £319,748.00 | 354 Semi Detached Houses |
| Terraced House | £261,554.00 | 385 Terraced Houses |
| Detached House | £517,339.00 | 407 Detached Houses |
| Flat | £157,951.00 | 196 Flats |

