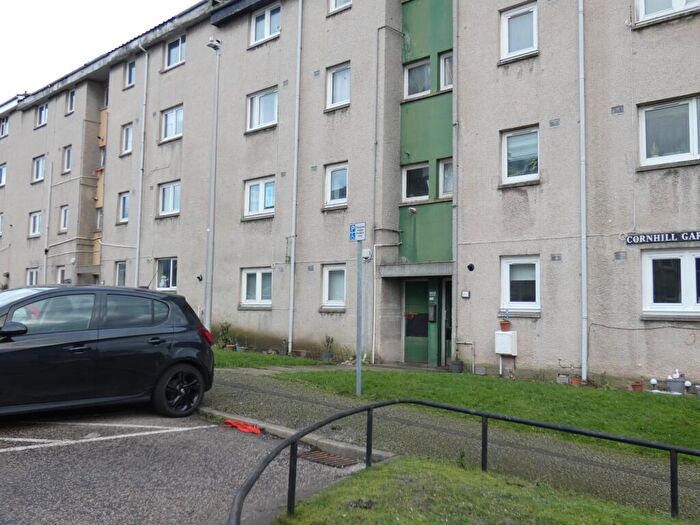
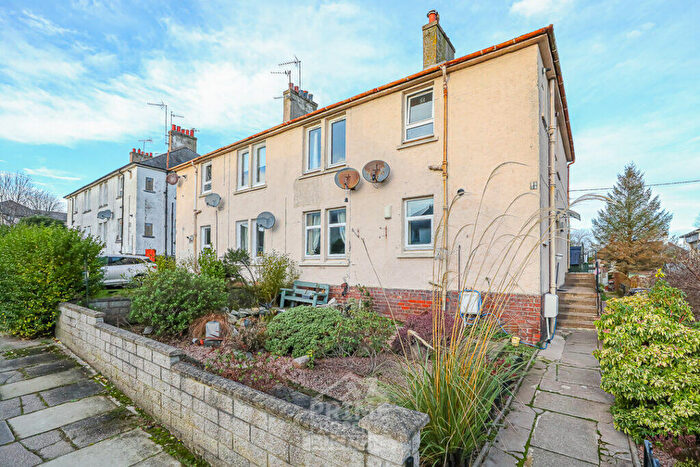
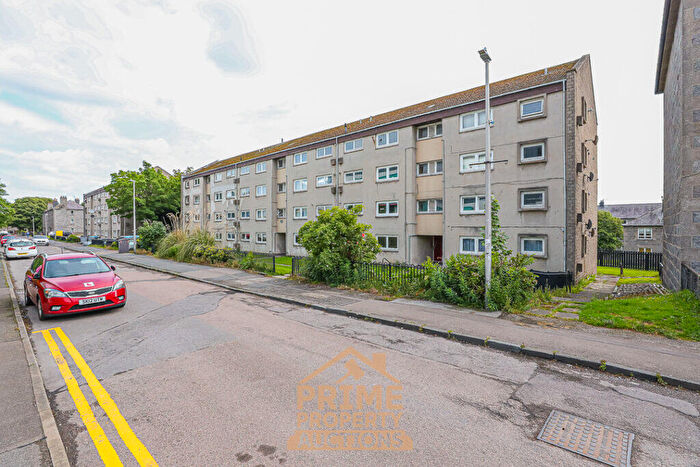
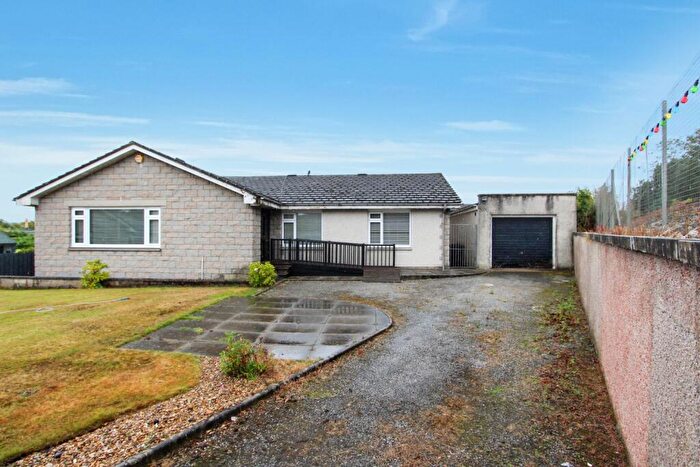
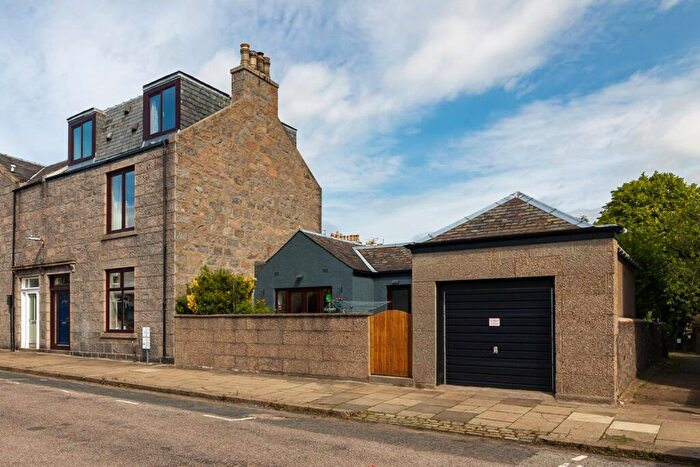
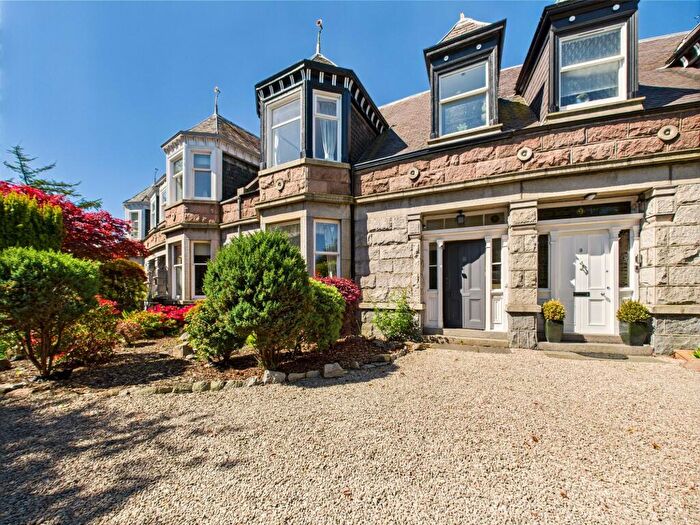
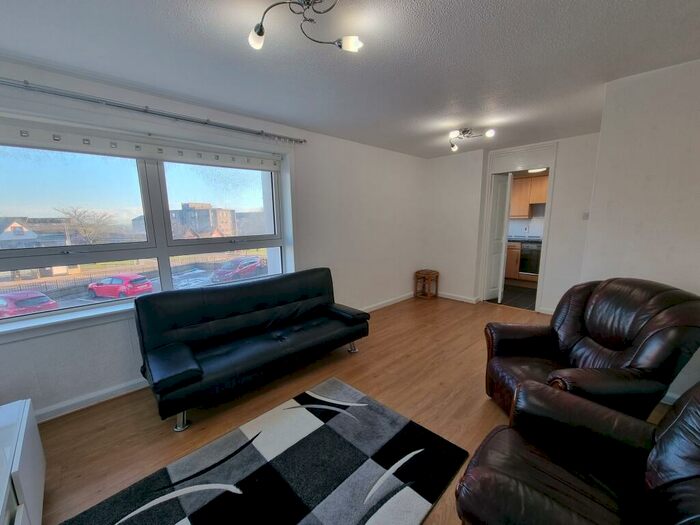
Houses for sale & to rent in Hilton/Woodside/Stockethill, Aberdeen
House Prices in Hilton/Woodside/Stockethill
Properties in Hilton/Woodside/Stockethill have an average house price of £121,677.00 and had 281 Property Transactions within the last 3 years¹.
Hilton/Woodside/Stockethill is an area in Aberdeen, Aberdeen City with 7,784 households², where the most expensive property was sold for £432,500.00.
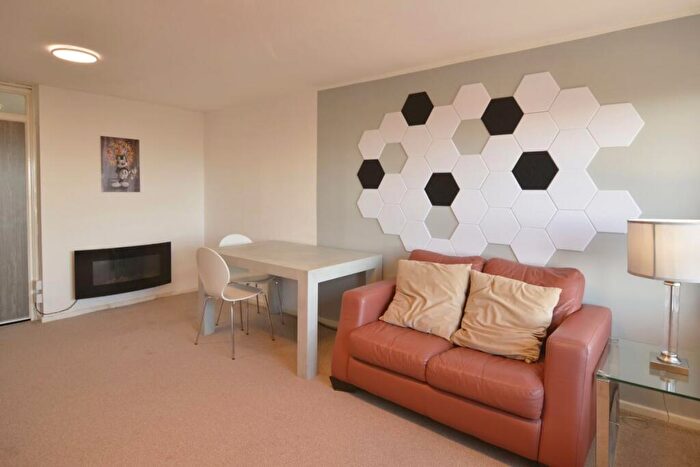
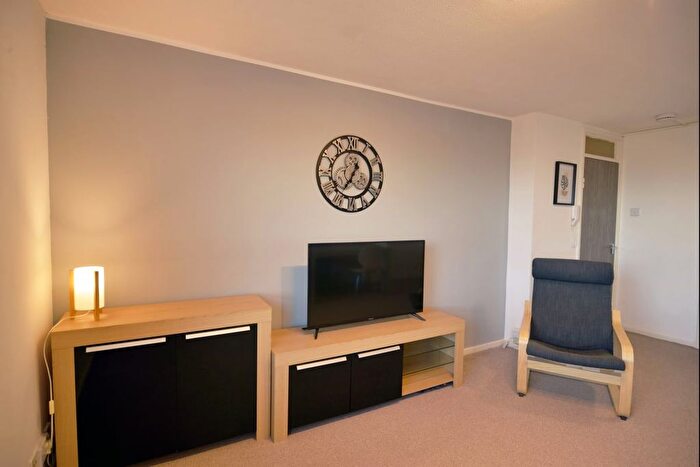
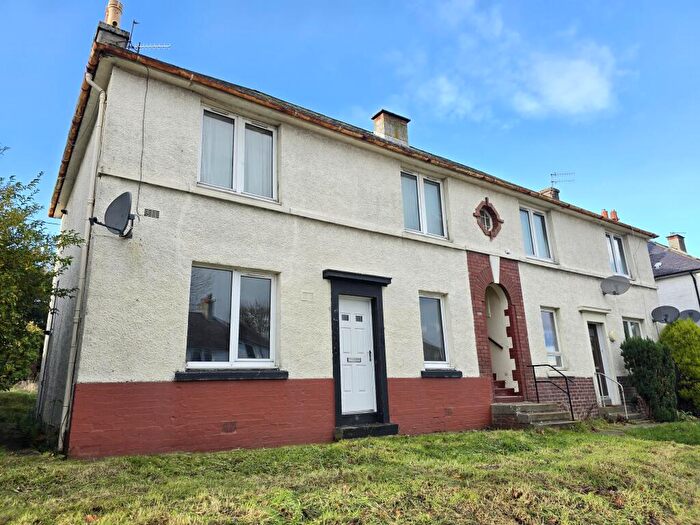
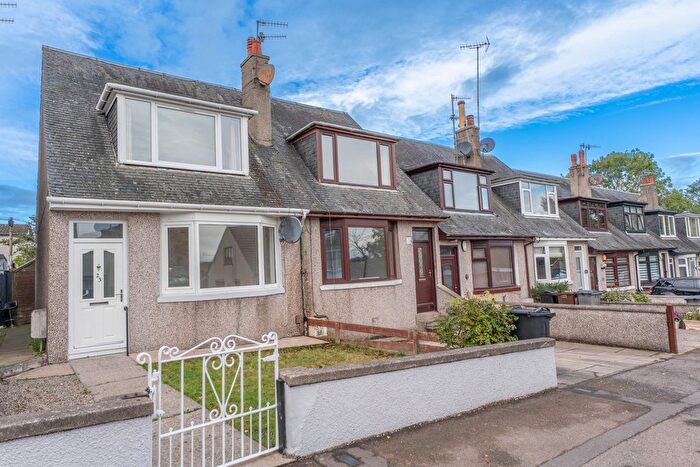
Properties for sale in Hilton/Woodside/Stockethill
Previously listed properties in Hilton/Woodside/Stockethill
Roads and Postcodes in Hilton/Woodside/Stockethill
Navigate through our locations to find the location of your next house in Hilton/Woodside/Stockethill, Aberdeen for sale or to rent.
Transport near Hilton/Woodside/Stockethill
- FAQ
- Price Paid By Year
Frequently asked questions about Hilton/Woodside/Stockethill
What is the average price for a property for sale in Hilton/Woodside/Stockethill?
The average price for a property for sale in Hilton/Woodside/Stockethill is £121,677. This amount is 31% lower than the average price in Aberdeen. There are 289 property listings for sale in Hilton/Woodside/Stockethill.
Which train stations are available in or near Hilton/Woodside/Stockethill?
Some of the train stations available in or near Hilton/Woodside/Stockethill are Aberdeen, Dyce and Portlethen.
Property Price Paid in Hilton/Woodside/Stockethill by Year
The average sold property price by year was:
| Year | Average Sold Price | Price Change |
Sold Properties
|
|---|---|---|---|
| 2023 | £104,953 | -19% |
41 Properties |
| 2022 | £124,535 | -5% |
240 Properties |
| 2021 | £130,437 | 4% |
224 Properties |
| 2020 | £125,362 | -9% |
172 Properties |
| 2019 | £136,155 | -14% |
221 Properties |
| 2018 | £155,297 | -1% |
225 Properties |
| 2017 | £156,132 | -7% |
217 Properties |
| 2016 | £167,679 | -8% |
235 Properties |
| 2015 | £181,839 | 4% |
312 Properties |
| 2014 | £174,852 | 6% |
370 Properties |
| 2013 | £164,683 | 5% |
397 Properties |
| 2012 | £156,066 | 3% |
309 Properties |
| 2011 | £151,864 | 3% |
285 Properties |
| 2010 | £146,627 | 8% |
249 Properties |
| 2009 | £135,393 | -10% |
269 Properties |
| 2008 | £149,324 | -1% |
363 Properties |
| 2007 | £151,496 | -1387,1% |
458 Properties |
| 2006 | £2,252,909 | 97% |
427 Properties |
| 2005 | £73,713 | 12% |
458 Properties |
| 2004 | £64,967 | 19% |
408 Properties |
| 2003 | £52,539 | 2% |
419 Properties |
| 2002 | £51,489 | -12% |
411 Properties |
| 2001 | £57,562 | - |
24 Properties |

